| Param | Original file | Final file |
|---|---|---|
| Filename | modeM0/AS1A12_018T01_9000005874_43406cztM0_level2.fits | modeM0/AS1A12_018T01_9000005874_43406cztM0_level2_quad_clean.evt |
| Size (bytes) | 331,692,480 | 91,059,840 |
| Size | 316.3 MB | 86.8 MB |
| Events in quadrant A | 3,358,619 | 606,461 |
| Events in quadrant B | 2,874,615 | 618,996 |
| Events in quadrant C | 2,622,467 | 593,430 |
| Events in quadrant D | 2,979,347 | 540,375 |
| Mode M0 | |||
|---|---|---|---|
| Quadrant | BADHDUFLAG | Total packets | Discarded packets |
| A | 0 | 13318 | 2 |
| B | 0 | 12482 | 2 |
| C | 0 | 11491 | 2 |
| D | 0 | 12775 | 2 |
| Mode M9 | |||
|---|---|---|---|
| Quadrant | BADHDUFLAG | Total packets | Discarded packets |
| A | 0 | 24 | 0 |
| B | 0 | 25 | 0 |
| C | 0 | 25 | 0 |
| D | 0 | 25 | 0 |
| Mode SS | |||
|---|---|---|---|
| Quadrant | BADHDUFLAG | Total packets | Discarded packets |
| A | 0 | 116 | 0 |
| B | 0 | 116 | 0 |
| C | 0 | 116 | 0 |
| D | 0 | 116 | 0 |
| Quadrant | Total seconds | Saturated seconds | Saturation percentage |
|---|---|---|---|
| A | 5687 | 116 | 2.039740% |
| B | 5687 | 117 | 2.057324% |
| C | 5687 | 3 | 0.052752% |
| D | 5687 | 73 | 1.283629% |
Noise dominated data is calculated using 1-second bins in cleaned event files. If a bin has >2000 counts, and if more than 50% of those come from <1% of pixels, then it is considered to be noise-dominated and hence unusable.
| Quadrant | # 1 sec bins | Bins with >0 counts | Bins with >2000 counts | High rate bins dominated by noise | Noise dominated (total time) | Noise dominated (detector-on time) | Marked lightcurve |
|---|---|---|---|---|---|---|---|
| A | 7090 | 5688 | 67 | 67 | 0.94% | 1.18% | 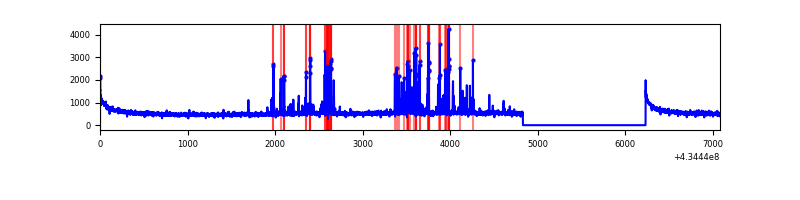 |
| B | 7090 | 5688 | 98 | 98 | 1.38% | 1.72% | 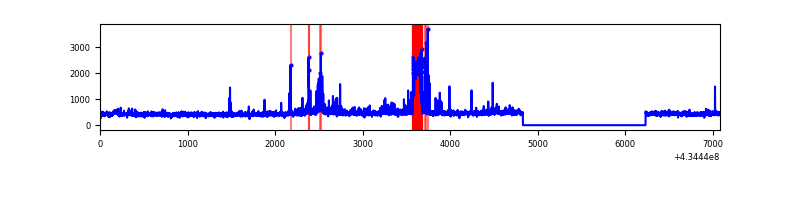 |
| C | 7090 | 5688 | 0 | 0 | 0.00% | 0.00% | 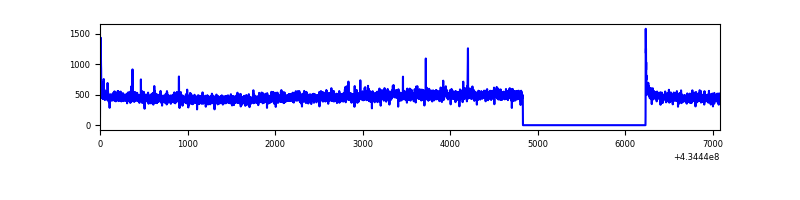 |
| D | 7090 | 5688 | 60 | 60 | 0.85% | 1.05% |  |
Top three noisy pixels from each quadrant. If the there are fewer than three noisy pixels in the level2.evt file, extra rows are filled as -1
| Pixel properties | Quadrant properties | ||||||
|---|---|---|---|---|---|---|---|
| Quadrant | DetID | PixID | Counts | Sigma | Mean | Median | Sigma |
| A | 10 | 83 | 635812 | 5098.06 | 604 | 589 | 124.6 |
| A | 15 | 237 | 338796 | 2714.32 | 604 | 589 | 124.6 |
| A | 13 | 248 | 21066 | 164.34 | 604 | 589 | 124.6 |
| B | 5 | 255 | 283658 | 2448.9 | 597 | 580 | 115.6 |
| B | 0 | 189 | 96095 | 826.3 | 597 | 580 | 115.6 |
| B | 0 | 190 | 53144 | 454.73 | 597 | 580 | 115.6 |
| C | 15 | 214 | 237260 | 1692.74 | 590 | 591 | 139.8 |
| C | 3 | 233 | 68035 | 482.38 | 590 | 591 | 139.8 |
| C | 14 | 254 | 10419 | 70.29 | 590 | 591 | 139.8 |
| D | 1 | 52 | 359091 | 2532.2 | 585 | 568 | 141.6 |
| D | 2 | 249 | 109283 | 767.84 | 585 | 568 | 141.6 |
| D | 13 | 249 | 84911 | 595.7 | 585 | 568 | 141.6 |
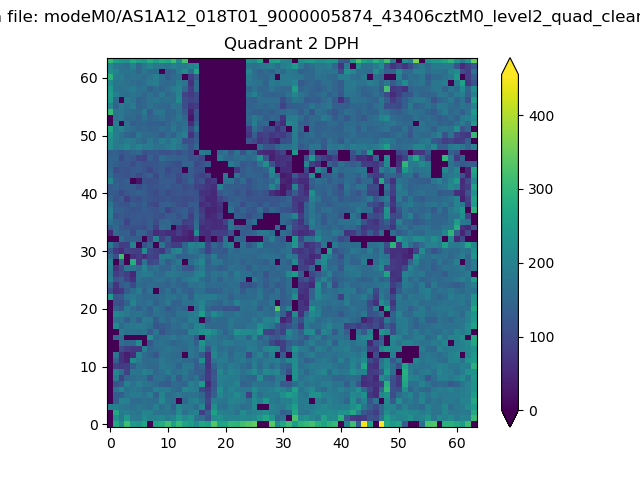
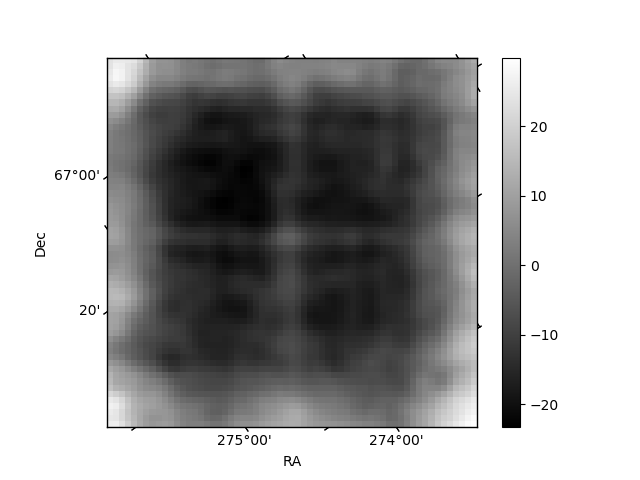
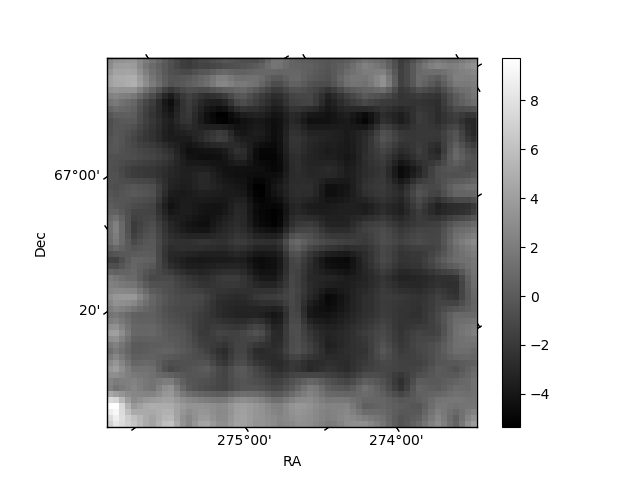
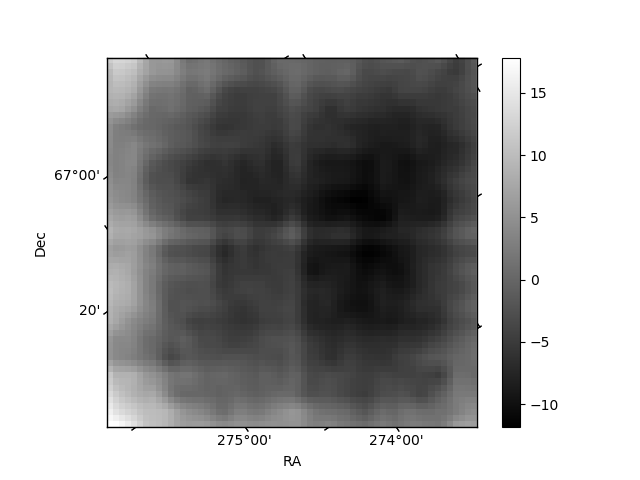
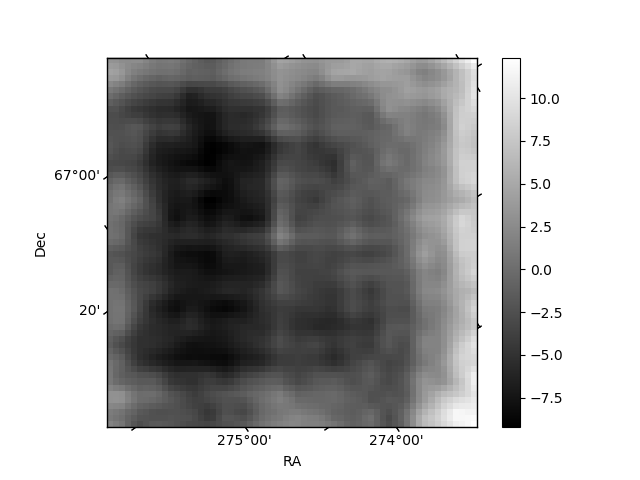
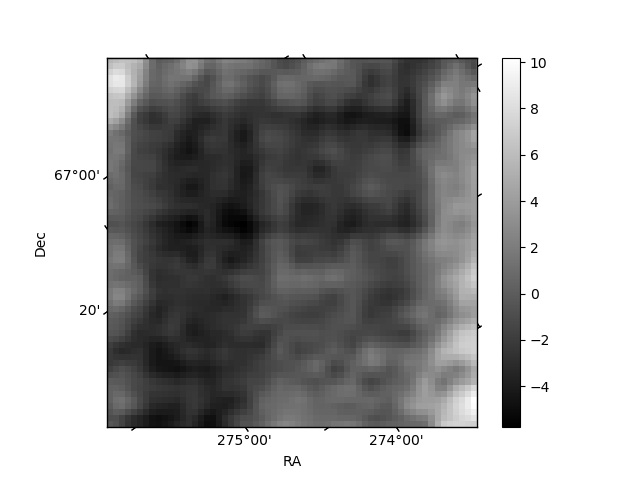
Histogram calculated using DETX and DETY for each event in the final _common_clean file
| Quadrant A | 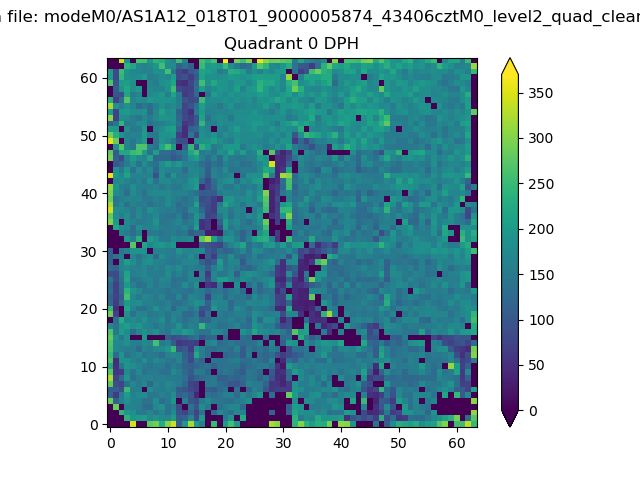 |
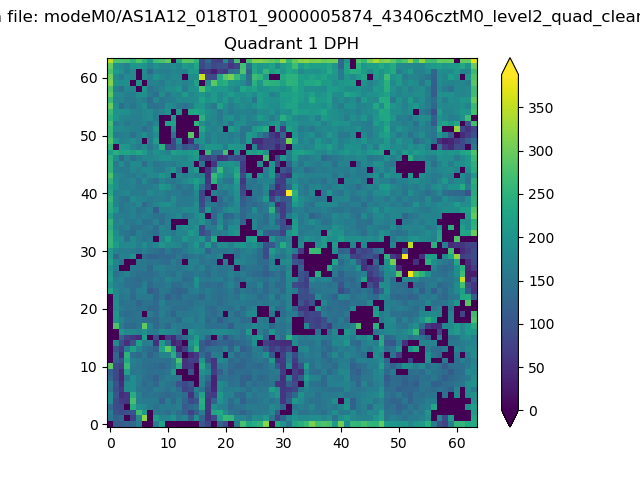 |
Quadrant B |
|---|---|---|---|
| Quadrant D | 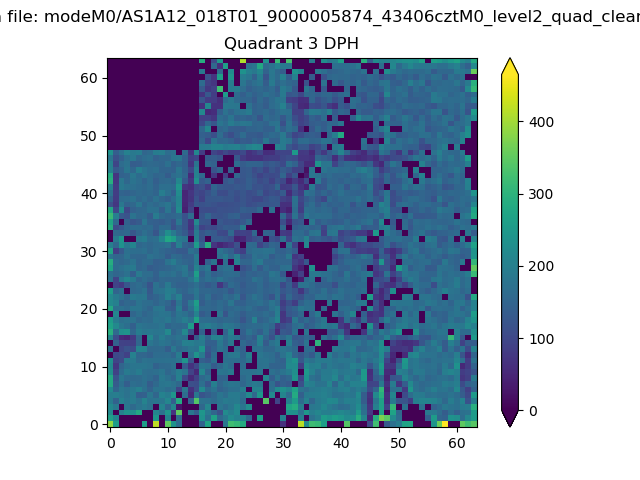 |
 |
Quadrant C |
| Plot type | Count rate plots | Images |
|---|---|---|
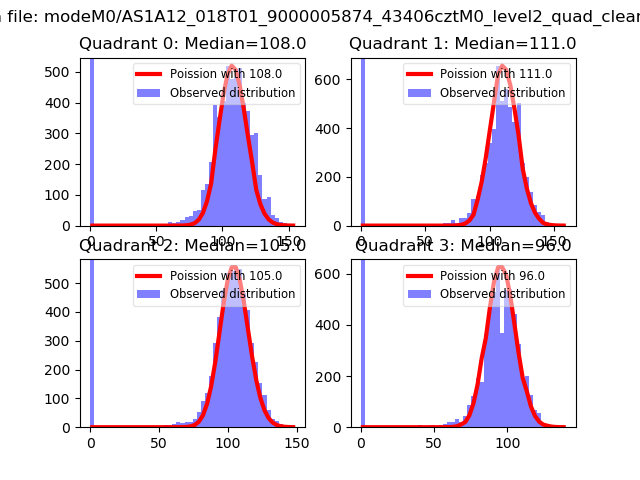
| Comparison with Poisson distribution Blue bars denote a histogram of data divided into 1 sec bins. Red curve is a Poisson curve with rate = median count rate of data. |
 |
 |
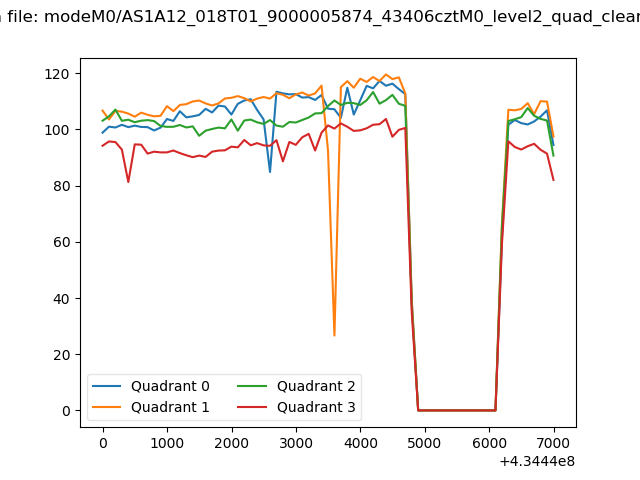
| Quadrant-wise count rates Data is divided into 100 sec bins |
 |
|
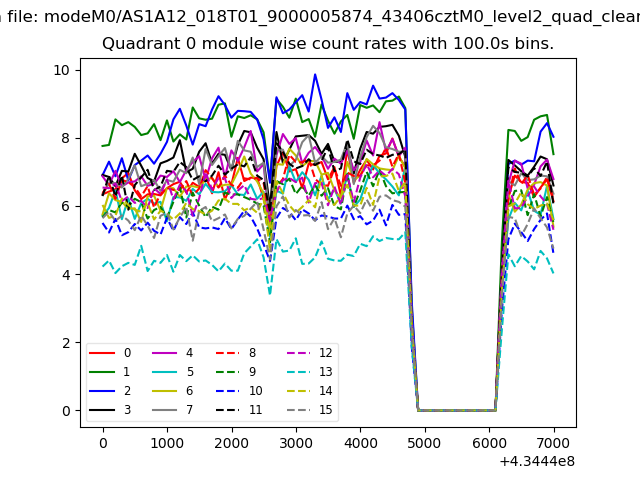
| Module-wise count rates for Quadrant A Data is divided into 100 sec bins |
 |
 |
| Module-wise count rates for Quadrant B Data is divided into 100 sec bins |
 |
 |
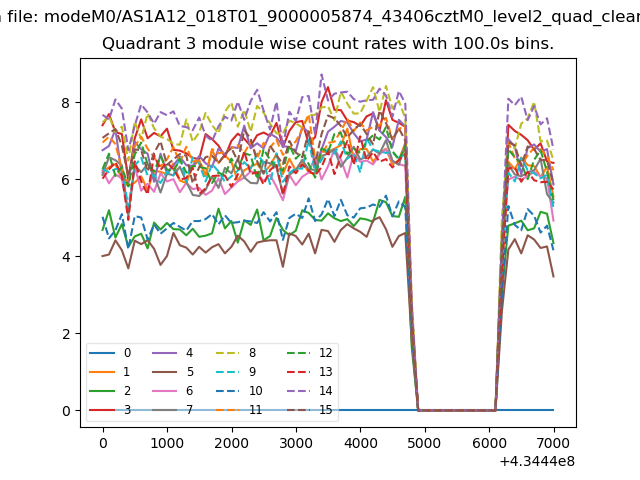
| Module-wise count rates for Quadrant C Data is divided into 100 sec bins |
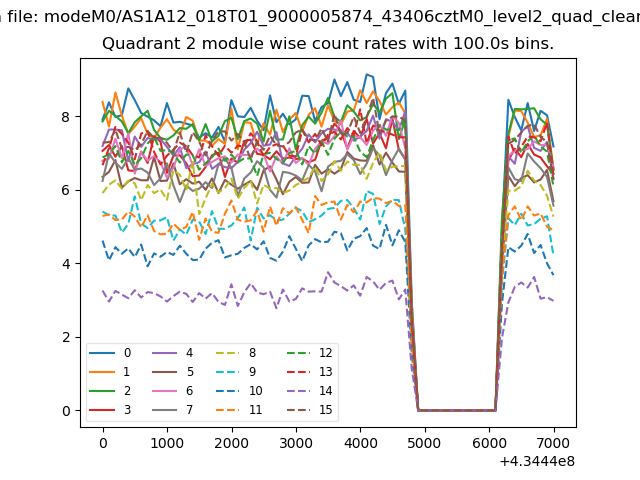 |
 |
| Module-wise count rates for Quadrant D Data is divided into 100 sec bins |
 |
 |
| Parameter | Plot |
|---|---|
| CZT HV Monitor | 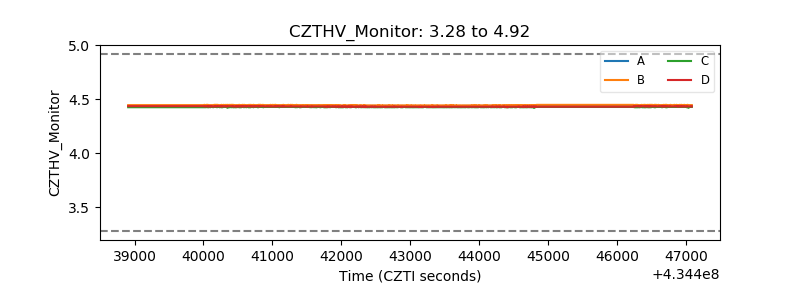 |
| D_VDD | 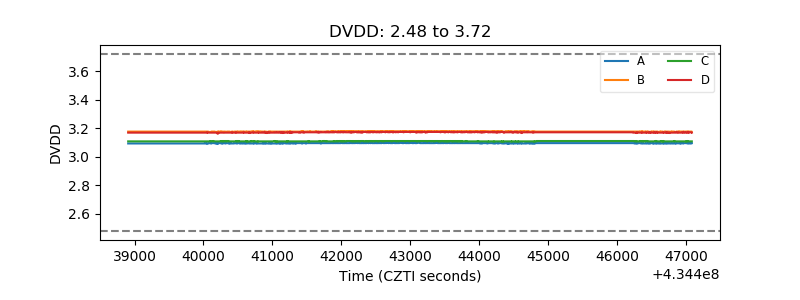 |
| Temperature 1 | 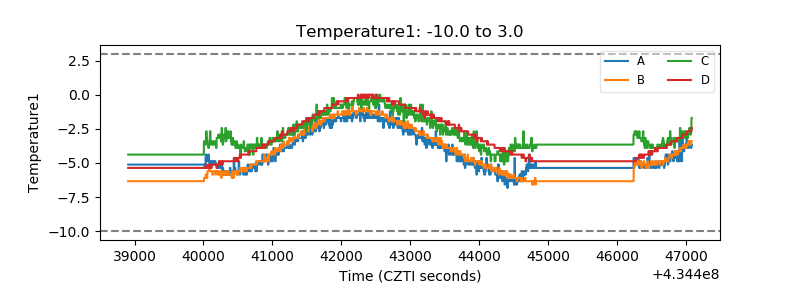 |
| Veto HV Monitor | 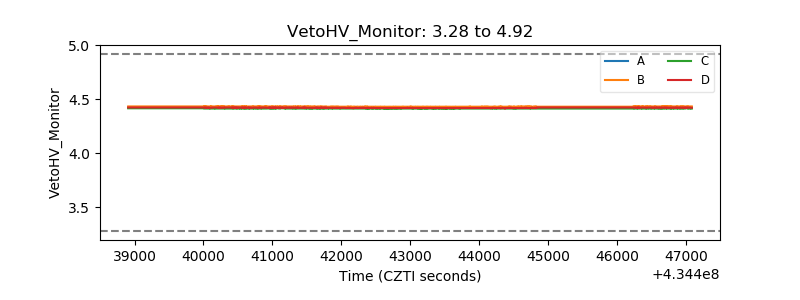 |
| Veto LLD | 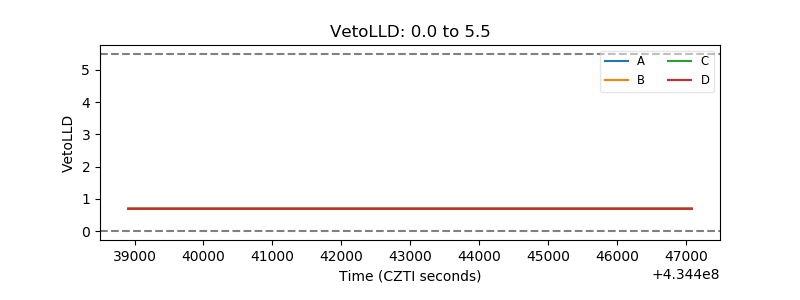 |
| Alpha Counter | 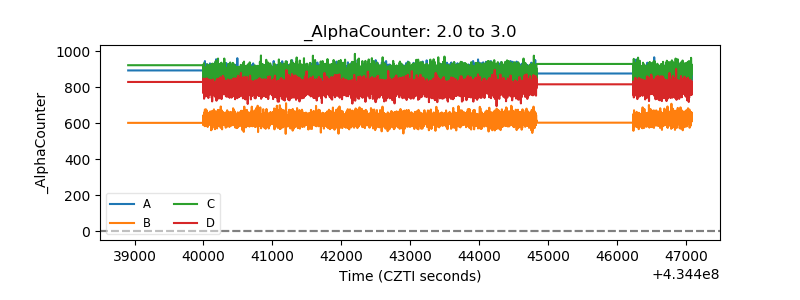 |
| _CPM_Rate | 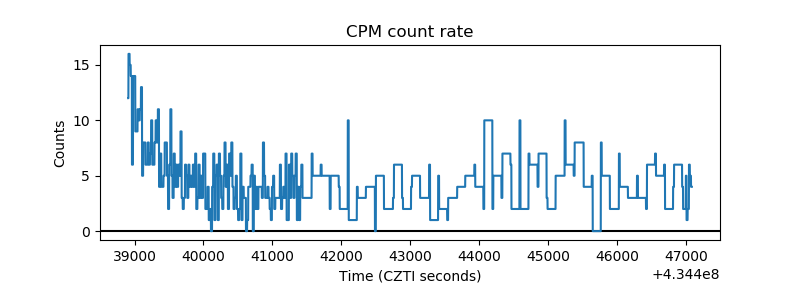 |
| CZT Counter | 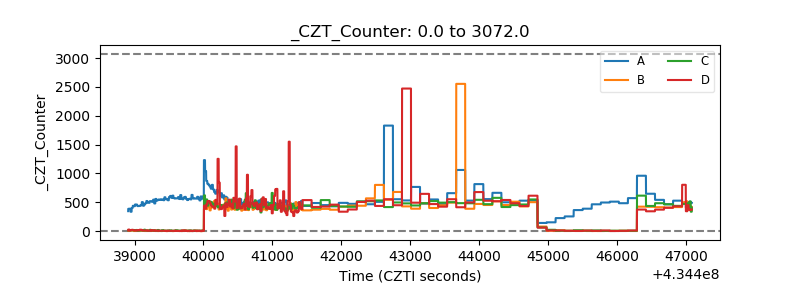 |
| +2.5 Volts monitor | 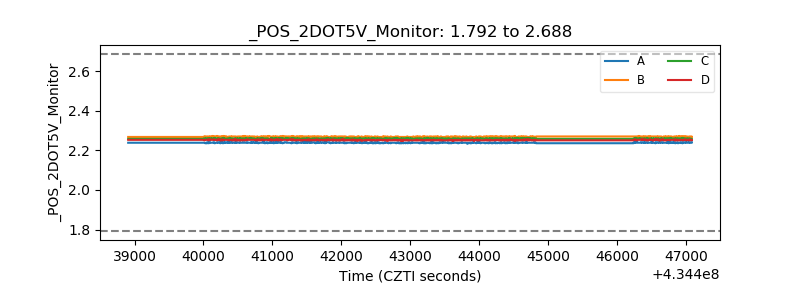 |
| +5 Volts monitor | 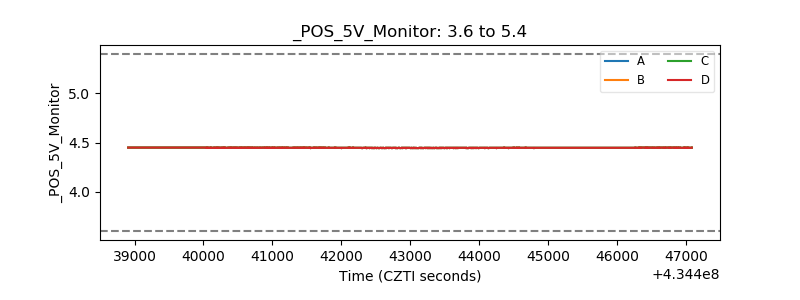 |
| _ROLL_ROT | 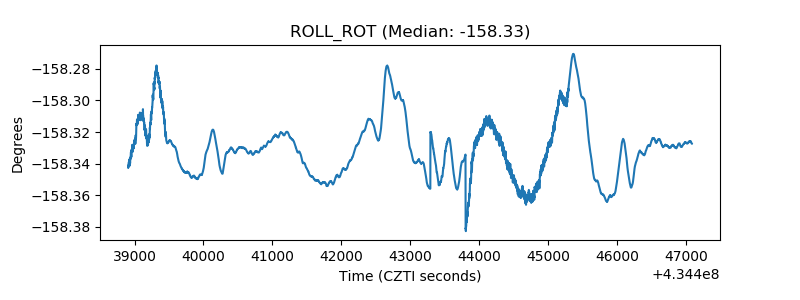 |
| _Roll_DEC | 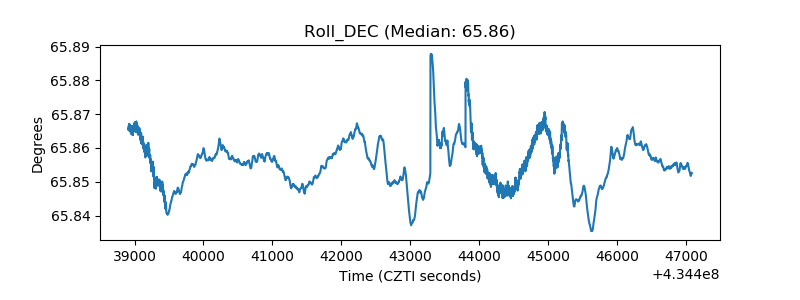 |
| _Roll_RA | 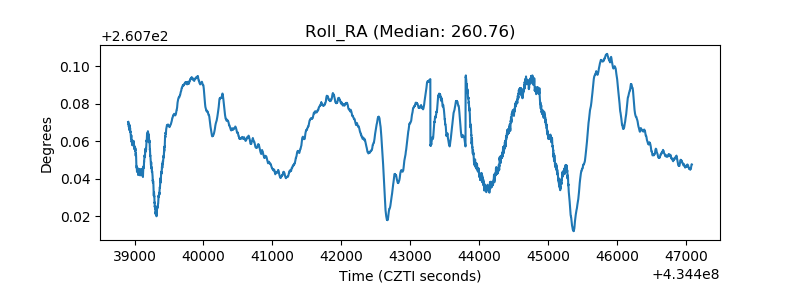 |
| Veto Counter | 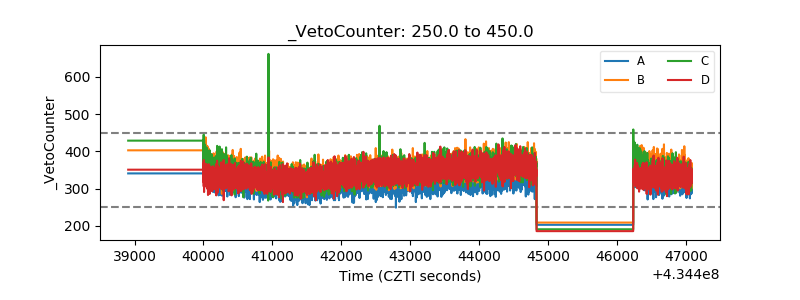 |