| Param | Original file | Final file |
|---|---|---|
| Filename | modeM0/AS1A12_018T01_9000005874_43407cztM0_level2.fits | modeM0/AS1A12_018T01_9000005874_43407cztM0_level2_quad_clean.evt |
| Size (bytes) | 343,379,520 | 95,480,640 |
| Size | 327.5 MB | 91.1 MB |
| Events in quadrant A | 3,462,189 | 639,412 |
| Events in quadrant B | 2,804,570 | 660,138 |
| Events in quadrant C | 2,706,421 | 612,351 |
| Events in quadrant D | 3,274,939 | 564,104 |
| Mode M0 | |||
|---|---|---|---|
| Quadrant | BADHDUFLAG | Total packets | Discarded packets |
| A | 0 | 13751 | 2 |
| B | 0 | 12413 | 2 |
| C | 0 | 11952 | 2 |
| D | 0 | 13901 | 2 |
| Mode M9 | |||
|---|---|---|---|
| Quadrant | BADHDUFLAG | Total packets | Discarded packets |
| A | 0 | 13 | 0 |
| B | 0 | 14 | 0 |
| C | 0 | 14 | 0 |
| D | 0 | 14 | 0 |
| Mode SS | |||
|---|---|---|---|
| Quadrant | BADHDUFLAG | Total packets | Discarded packets |
| A | 0 | 120 | 0 |
| B | 0 | 120 | 0 |
| C | 0 | 120 | 0 |
| D | 0 | 120 | 0 |
| Quadrant | Total seconds | Saturated seconds | Saturation percentage |
|---|---|---|---|
| A | 5941 | 78 | 1.312910% |
| B | 5941 | 31 | 0.521798% |
| C | 5941 | 3 | 0.050497% |
| D | 5940 | 91 | 1.531987% |
Noise dominated data is calculated using 1-second bins in cleaned event files. If a bin has >2000 counts, and if more than 50% of those come from <1% of pixels, then it is considered to be noise-dominated and hence unusable.
| Quadrant | # 1 sec bins | Bins with >0 counts | Bins with >2000 counts | High rate bins dominated by noise | Noise dominated (total time) | Noise dominated (detector-on time) | Marked lightcurve |
|---|---|---|---|---|---|---|---|
| A | 7253 | 5942 | 53 | 53 | 0.73% | 0.89% | 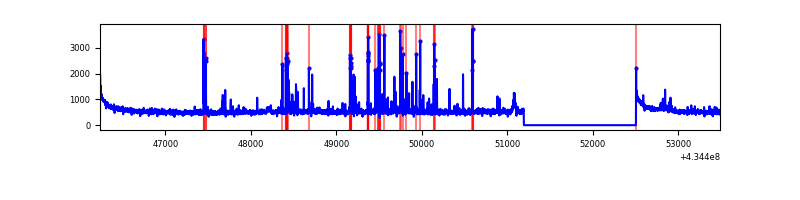 |
| B | 7253 | 5942 | 17 | 17 | 0.23% | 0.29% | 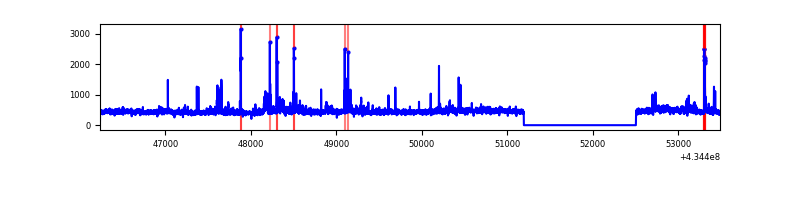 |
| C | 7253 | 5942 | 0 | 0 | 0.00% | 0.00% | 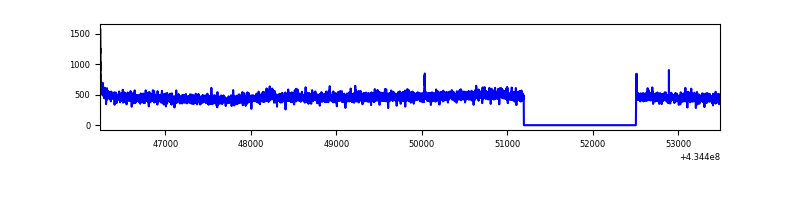 |
| D | 7252 | 5941 | 88 | 88 | 1.21% | 1.48% | 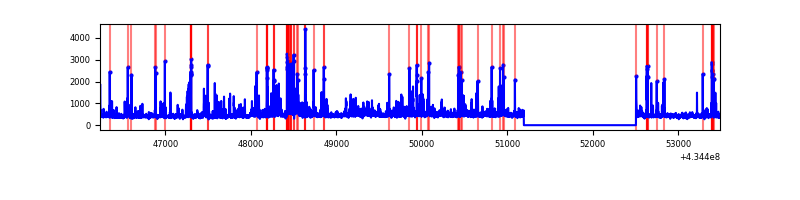 |
Top three noisy pixels from each quadrant. If the there are fewer than three noisy pixels in the level2.evt file, extra rows are filled as -1
| Pixel properties | Quadrant properties | ||||||
|---|---|---|---|---|---|---|---|
| Quadrant | DetID | PixID | Counts | Sigma | Mean | Median | Sigma |
| A | 10 | 83 | 657221 | 5015.22 | 638 | 624 | 130.9 |
| A | 15 | 237 | 293851 | 2239.73 | 638 | 624 | 130.9 |
| A | 15 | 223 | 20460 | 151.51 | 638 | 624 | 130.9 |
| B | 0 | 189 | 93019 | 760.71 | 635 | 619 | 121.5 |
| B | 0 | 190 | 52731 | 429.03 | 635 | 619 | 121.5 |
| B | 0 | 186 | 49615 | 403.37 | 635 | 619 | 121.5 |
| C | 15 | 214 | 250198 | 1716.47 | 617 | 617 | 145.4 |
| C | 3 | 233 | 45978 | 311.97 | 617 | 617 | 145.4 |
| C | 13 | 61 | 4144 | 24.26 | 617 | 617 | 145.4 |
| D | 1 | 52 | 491519 | 3284.7 | 615 | 595 | 149.5 |
| D | 13 | 249 | 114293 | 760.73 | 615 | 595 | 149.5 |
| D | 12 | 6 | 92875 | 617.43 | 615 | 595 | 149.5 |
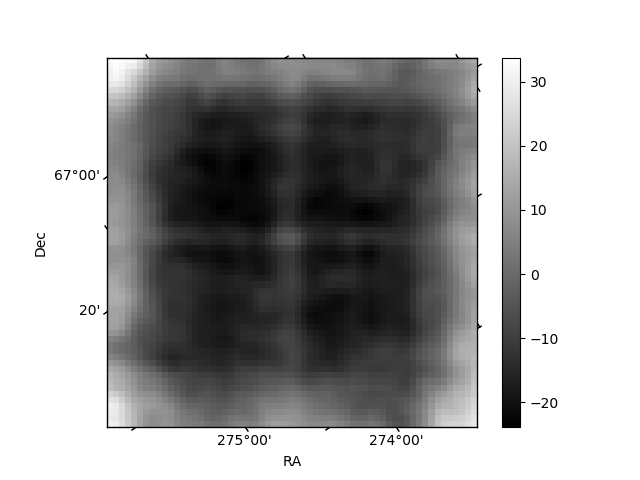
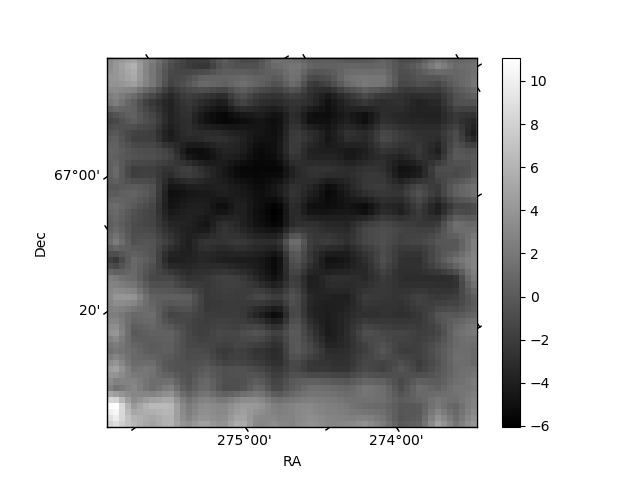
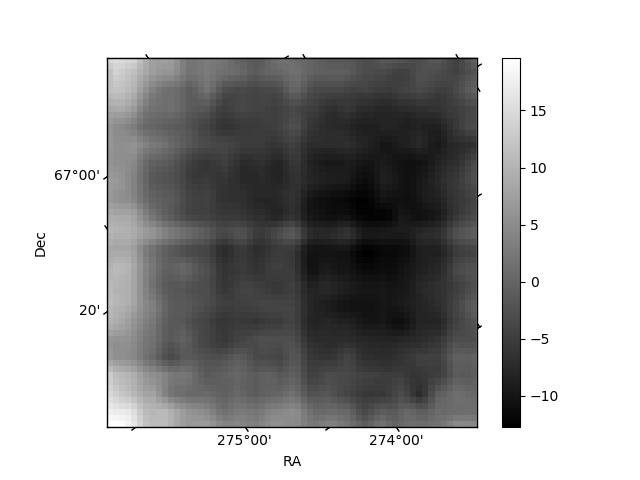
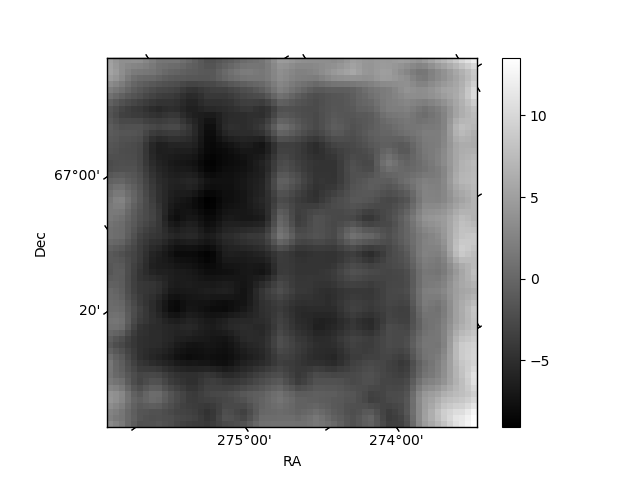
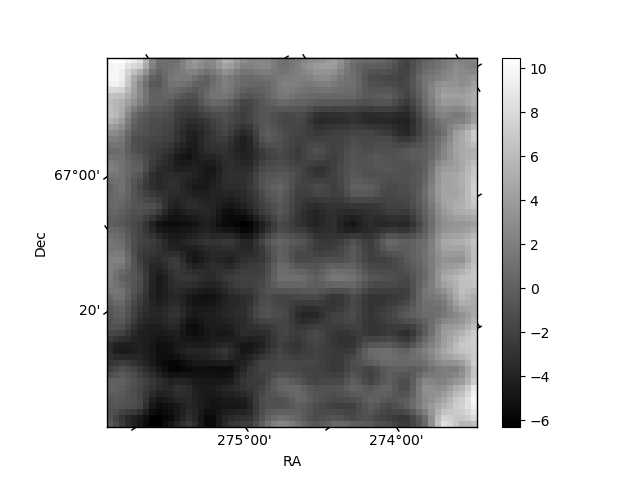
Histogram calculated using DETX and DETY for each event in the final _common_clean file
| Quadrant A | 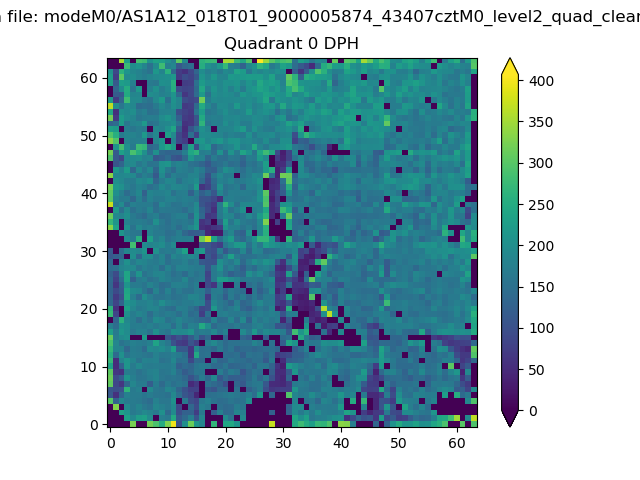 |
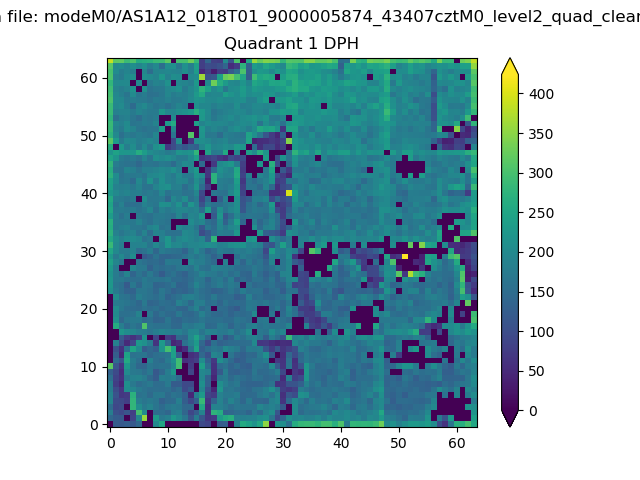 |
Quadrant B |
|---|---|---|---|
| Quadrant D | 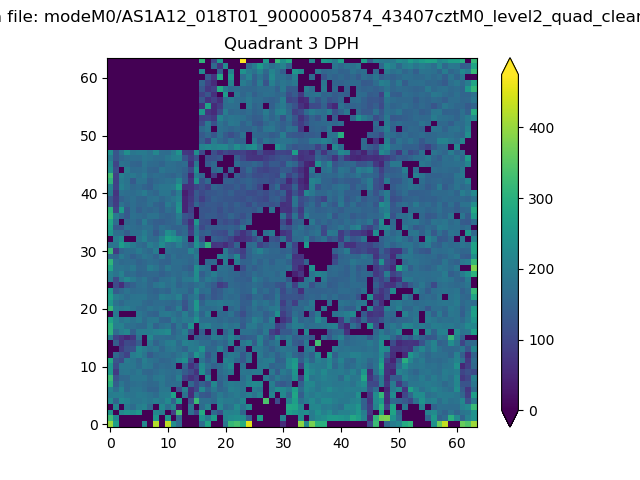 |
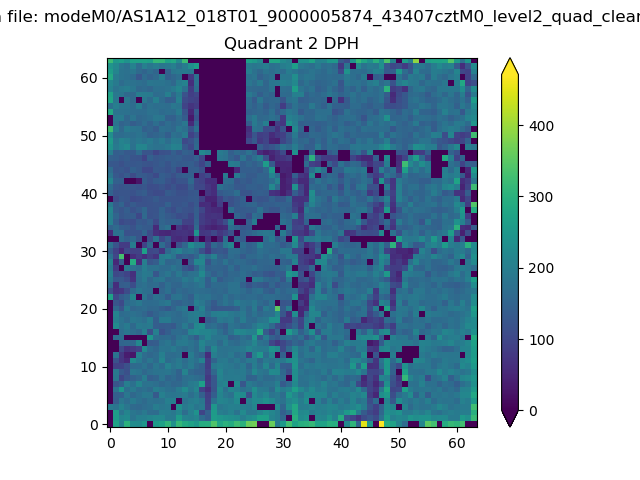 |
Quadrant C |
| Plot type | Count rate plots | Images |
|---|---|---|
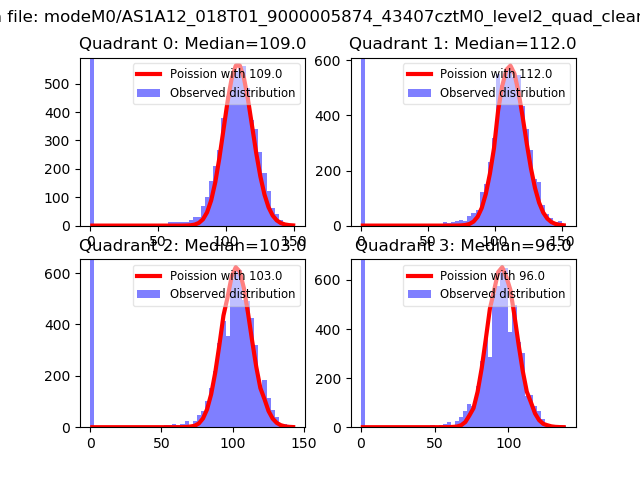
| Comparison with Poisson distribution Blue bars denote a histogram of data divided into 1 sec bins. Red curve is a Poisson curve with rate = median count rate of data. |
 |
 |
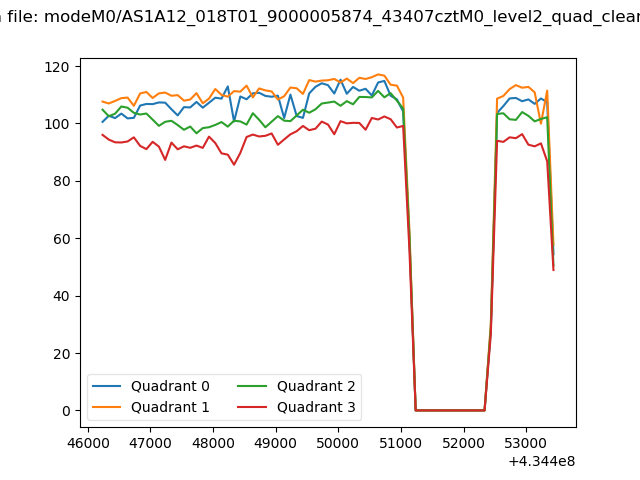
| Quadrant-wise count rates Data is divided into 100 sec bins |
 |
|
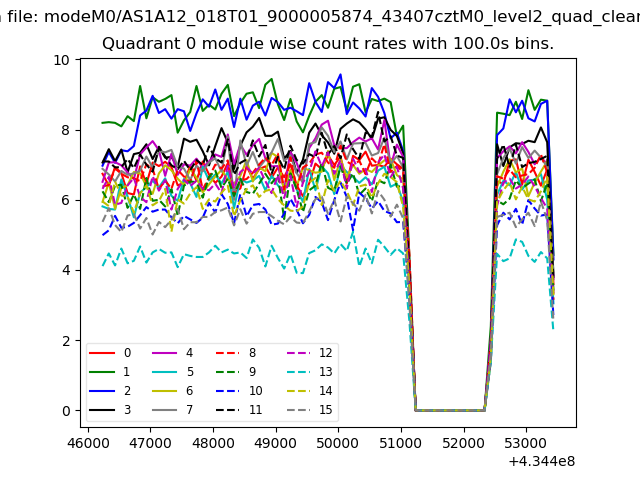
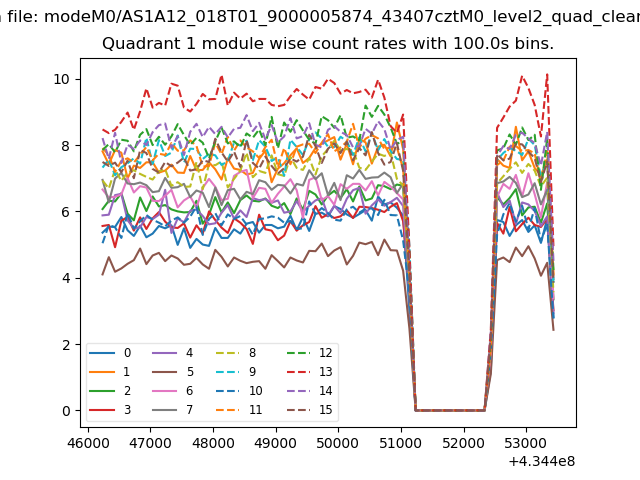
| Module-wise count rates for Quadrant A Data is divided into 100 sec bins |
 |
 |
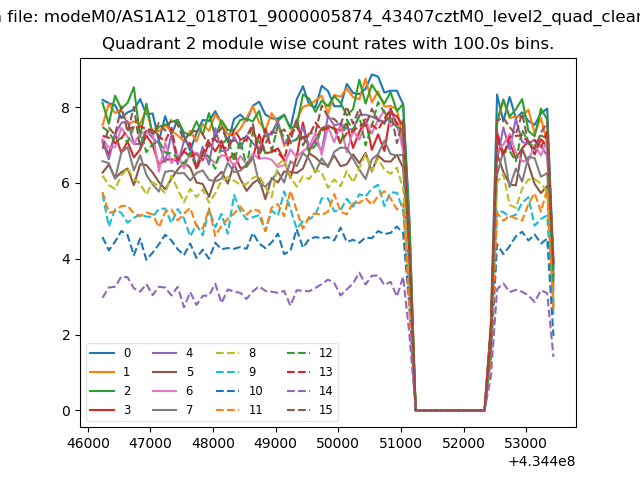
| Module-wise count rates for Quadrant B Data is divided into 100 sec bins |
 |
 |
| Module-wise count rates for Quadrant C Data is divided into 100 sec bins |
 |
 |
| Module-wise count rates for Quadrant D Data is divided into 100 sec bins |
 |
 |
| Parameter | Plot |
|---|---|
| CZT HV Monitor | 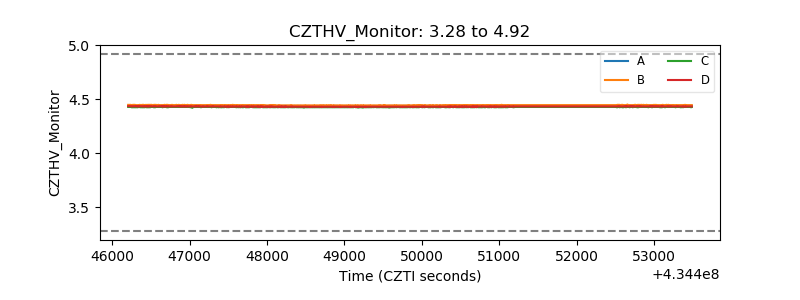 |
| D_VDD | 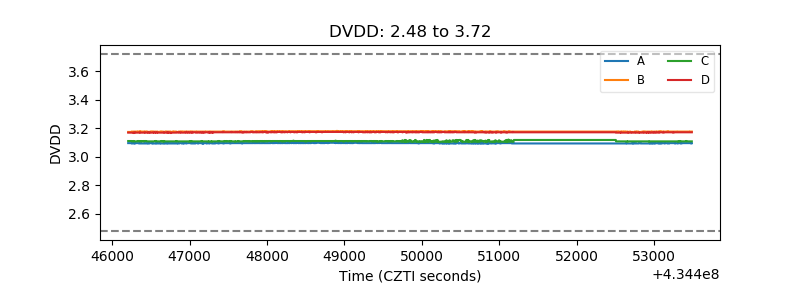 |
| Temperature 1 | 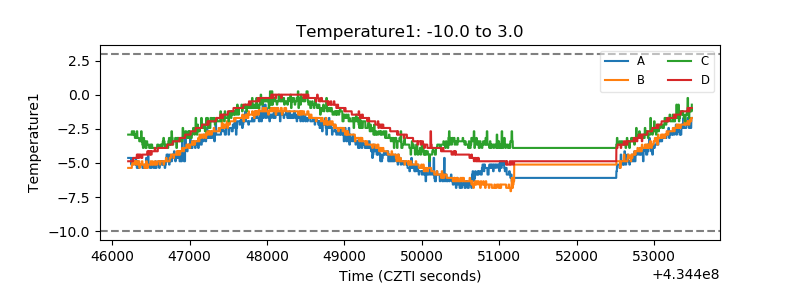 |
| Veto HV Monitor | 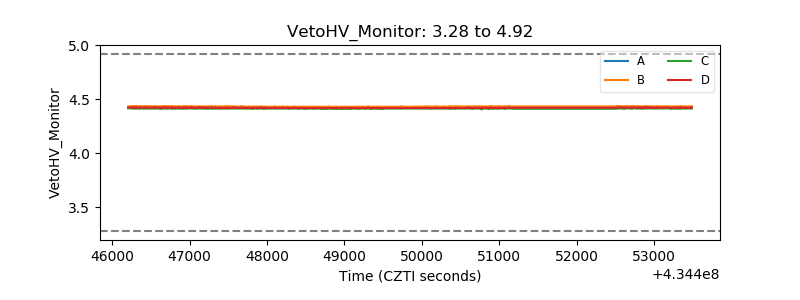 |
| Veto LLD | 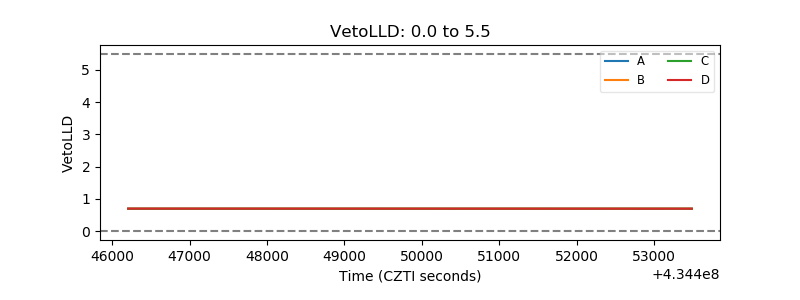 |
| Alpha Counter | 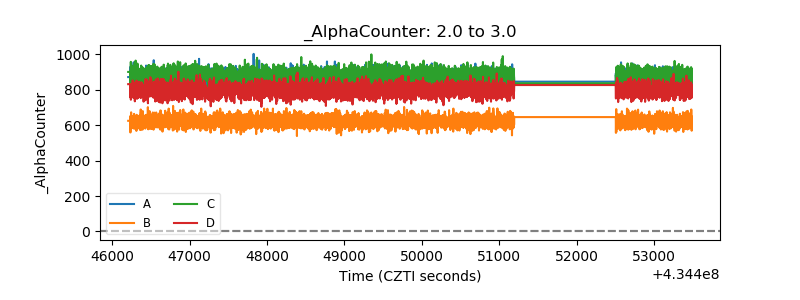 |
| _CPM_Rate | 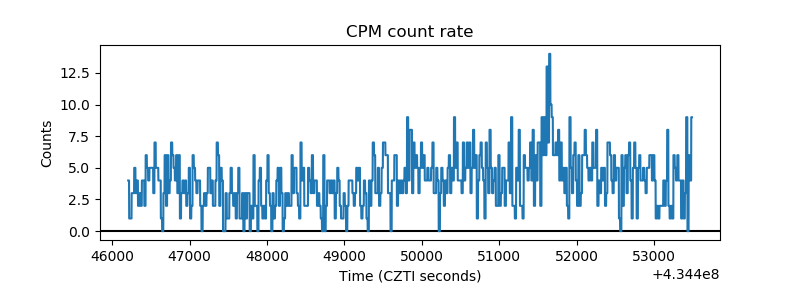 |
| CZT Counter | 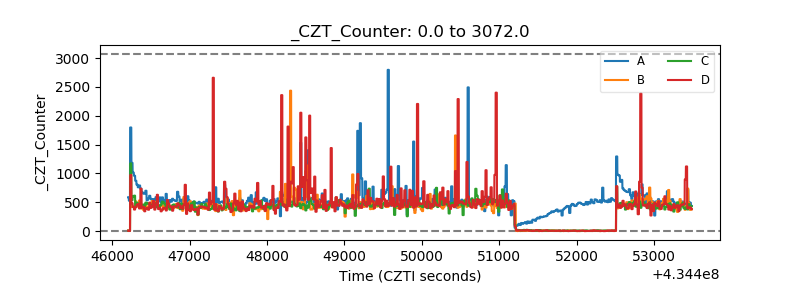 |
| +2.5 Volts monitor | 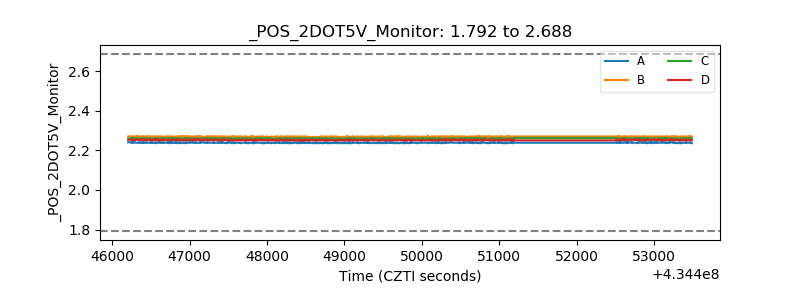 |
| +5 Volts monitor | 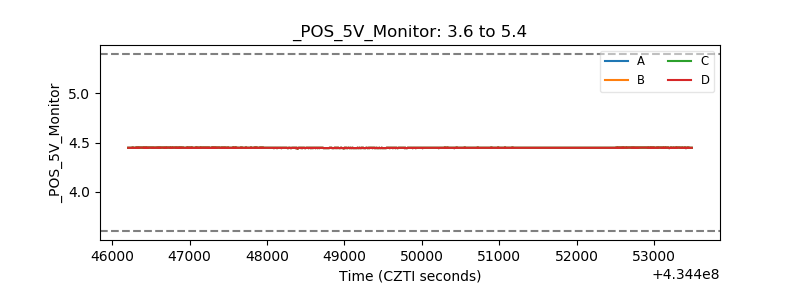 |
| _ROLL_ROT | 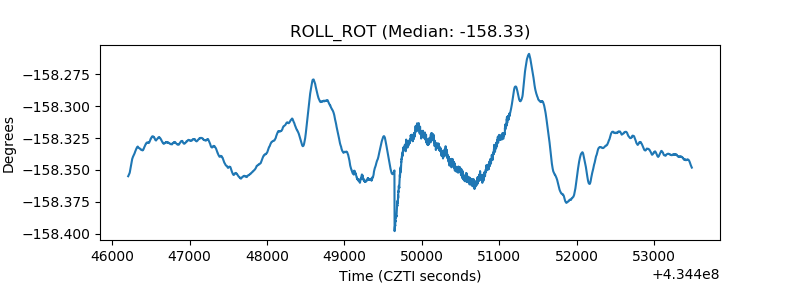 |
| _Roll_DEC | 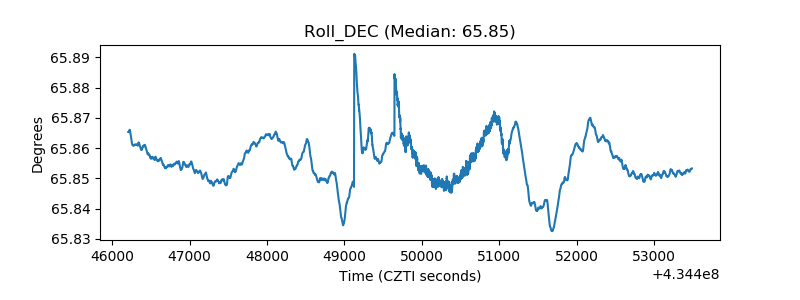 |
| _Roll_RA | 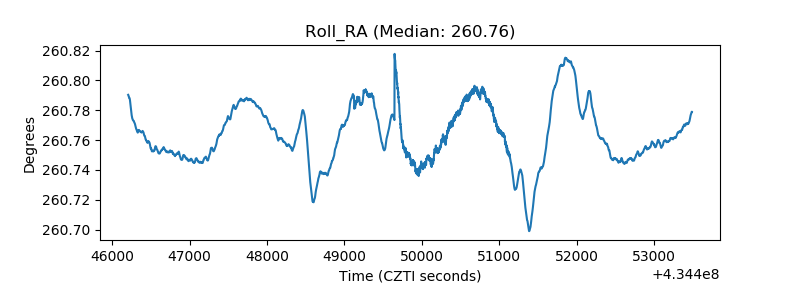 |
| Veto Counter | 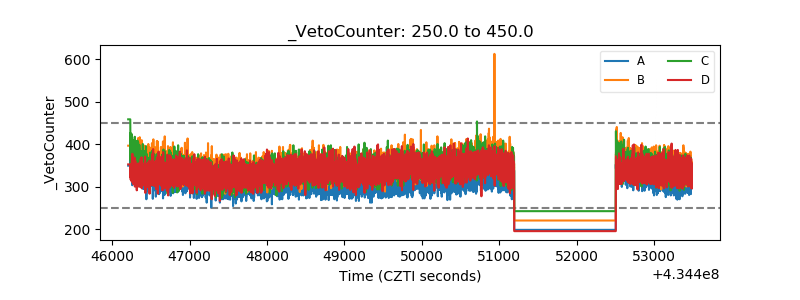 |