| Param | Original file | Final file |
|---|---|---|
| Filename | modeM0/AS1A12_018T01_9000005874_43410cztM0_level2.fits | modeM0/AS1A12_018T01_9000005874_43410cztM0_level2_quad_clean.evt |
| Size (bytes) | 1,059,969,600 | 244,863,360 |
| Size | 1010.9 MB | 233.5 MB |
| Events in quadrant A | 9,590,249 | 1,655,194 |
| Events in quadrant B | 7,889,519 | 1,713,537 |
| Events in quadrant C | 7,332,709 | 1,589,937 |
| Events in quadrant D | 13,210,412 | 1,372,491 |
| Mode M0 | |||
|---|---|---|---|
| Quadrant | BADHDUFLAG | Total packets | Discarded packets |
| A | 0 | 37804 | 4 |
| B | 0 | 33810 | 4 |
| C | 0 | 31988 | 4 |
| D | 0 | 50021 | 4 |
| Mode M9 | |||
|---|---|---|---|
| Quadrant | BADHDUFLAG | Total packets | Discarded packets |
| A | 0 | 44 | 0 |
| B | 0 | 45 | 0 |
| C | 0 | 45 | 0 |
| D | 0 | 45 | 0 |
| Mode SS | |||
|---|---|---|---|
| Quadrant | BADHDUFLAG | Total packets | Discarded packets |
| A | 0 | 320 | 0 |
| B | 0 | 320 | 0 |
| C | 0 | 320 | 0 |
| D | 0 | 320 | 0 |
| Quadrant | Total seconds | Saturated seconds | Saturation percentage |
|---|---|---|---|
| A | 15681 | 397 | 2.531726% |
| B | 15681 | 105 | 0.669600% |
| C | 15681 | 34 | 0.216823% |
| D | 15680 | 1288 | 8.214286% |
Noise dominated data is calculated using 1-second bins in cleaned event files. If a bin has >2000 counts, and if more than 50% of those come from <1% of pixels, then it is considered to be noise-dominated and hence unusable.
| Quadrant | # 1 sec bins | Bins with >0 counts | Bins with >2000 counts | High rate bins dominated by noise | Noise dominated (total time) | Noise dominated (detector-on time) | Marked lightcurve |
|---|---|---|---|---|---|---|---|
| A | 19887 | 15684 | 299 | 299 | 1.50% | 1.91% | 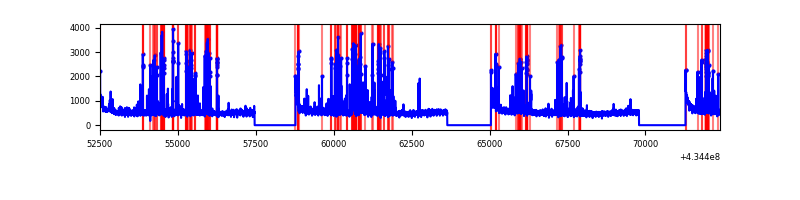 |
| B | 19887 | 15684 | 53 | 53 | 0.27% | 0.34% | 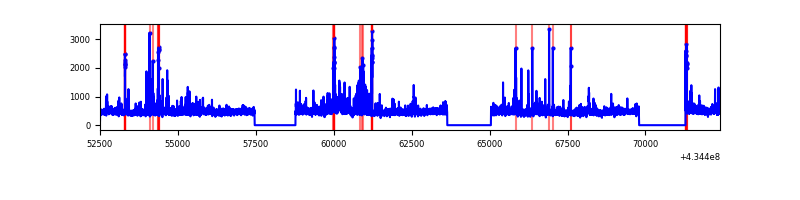 |
| C | 19887 | 15684 | 26 | 26 | 0.13% | 0.17% | 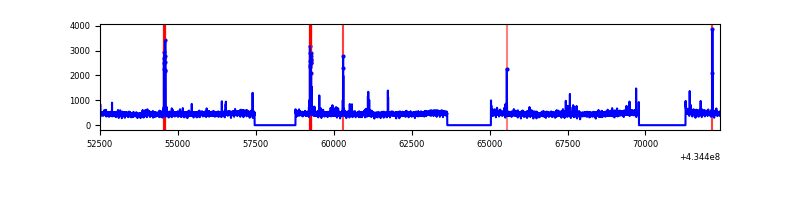 |
| D | 19886 | 15683 | 1321 | 1321 | 6.64% | 8.42% | 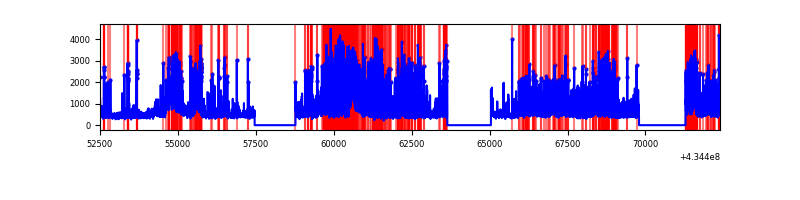 |
Top three noisy pixels from each quadrant. If the there are fewer than three noisy pixels in the level2.evt file, extra rows are filled as -1
| Pixel properties | Quadrant properties | ||||||
|---|---|---|---|---|---|---|---|
| Quadrant | DetID | PixID | Counts | Sigma | Mean | Median | Sigma |
| A | 10 | 83 | 1645900 | 4849.45 | 1665 | 1630 | 339.1 |
| A | 15 | 237 | 1301329 | 3833.2 | 1665 | 1630 | 339.1 |
| A | 15 | 222 | 83457 | 241.33 | 1665 | 1630 | 339.1 |
| B | 0 | 189 | 554345 | 1756.41 | 1673 | 1627 | 314.7 |
| B | 0 | 186 | 233506 | 736.86 | 1673 | 1627 | 314.7 |
| B | 0 | 245 | 191303 | 602.74 | 1673 | 1627 | 314.7 |
| C | 15 | 214 | 645222 | 1685.56 | 1636 | 1645 | 381.8 |
| C | 3 | 233 | 186490 | 484.12 | 1636 | 1645 | 381.8 |
| C | 14 | 254 | 96676 | 248.89 | 1636 | 1645 | 381.8 |
| D | 1 | 52 | 3714905 | 9650.94 | 1587 | 1541 | 384.8 |
| D | 2 | 16 | 936190 | 2429.13 | 1587 | 1541 | 384.8 |
| D | 1 | 47 | 910956 | 2363.55 | 1587 | 1541 | 384.8 |
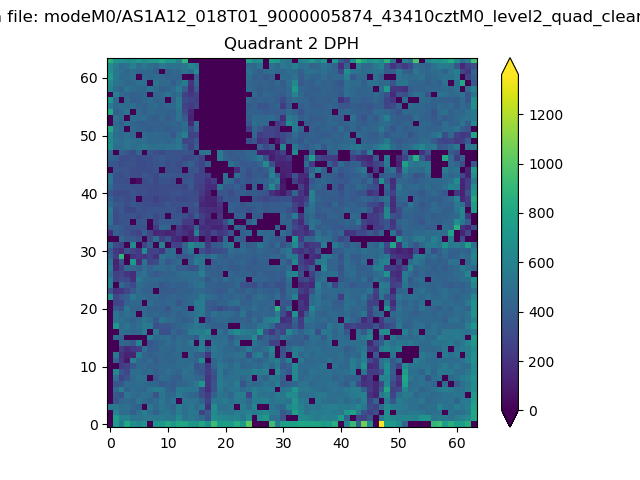
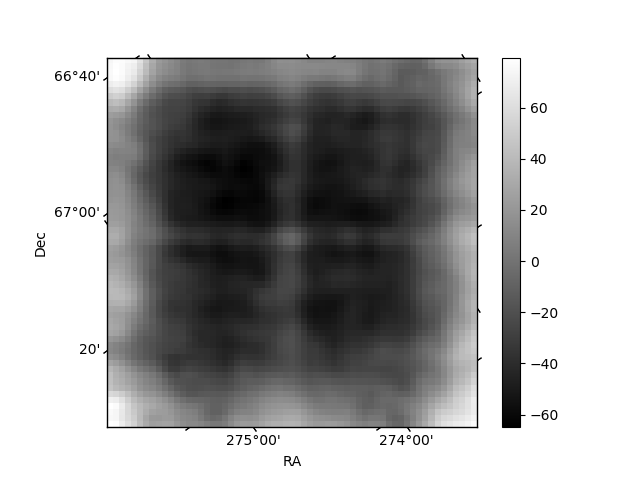
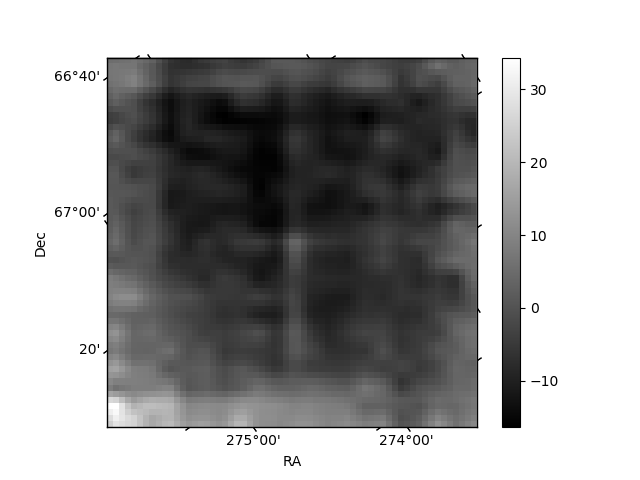
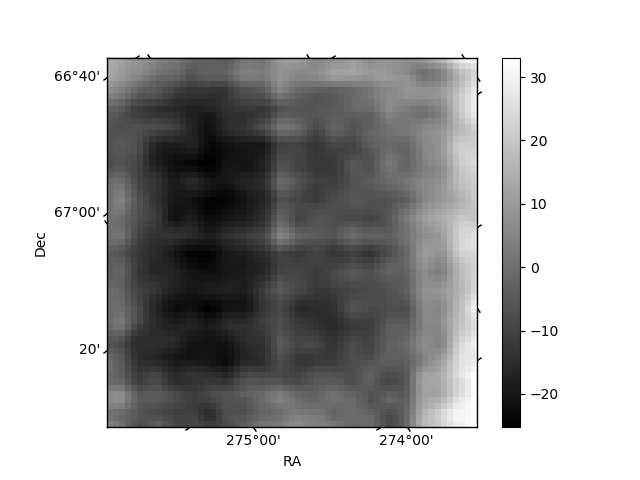
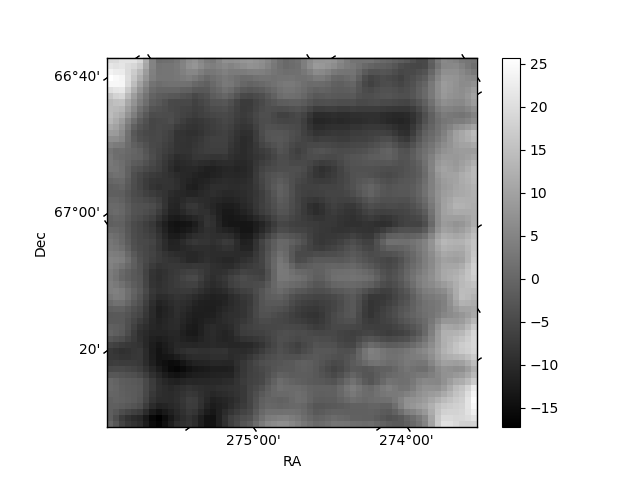
Histogram calculated using DETX and DETY for each event in the final _common_clean file
| Quadrant A | 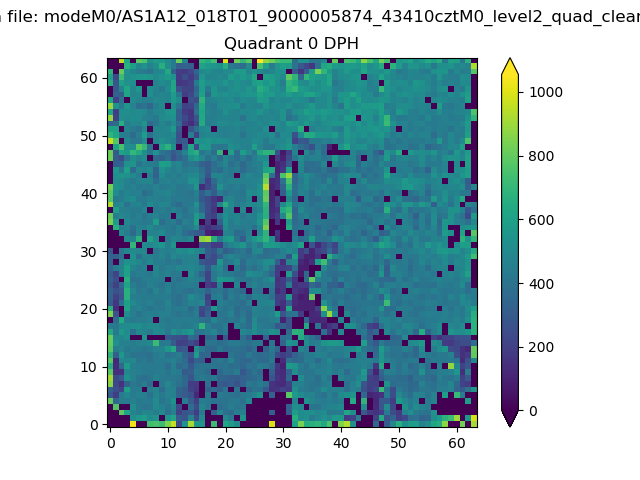 |
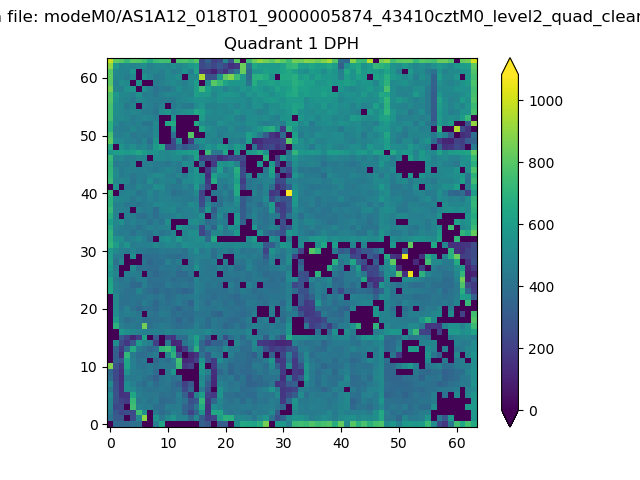 |
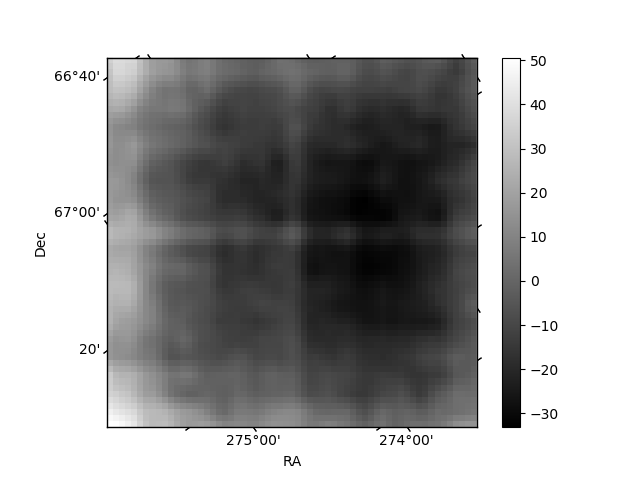
Quadrant B |
|---|---|---|---|
| Quadrant D | 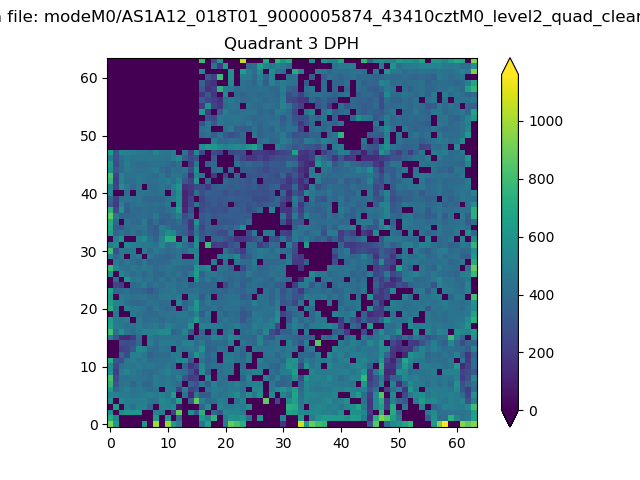 |
 |
Quadrant C |
| Plot type | Count rate plots | Images |
|---|---|---|
| Comparison with Poisson distribution Blue bars denote a histogram of data divided into 1 sec bins. Red curve is a Poisson curve with rate = median count rate of data. |
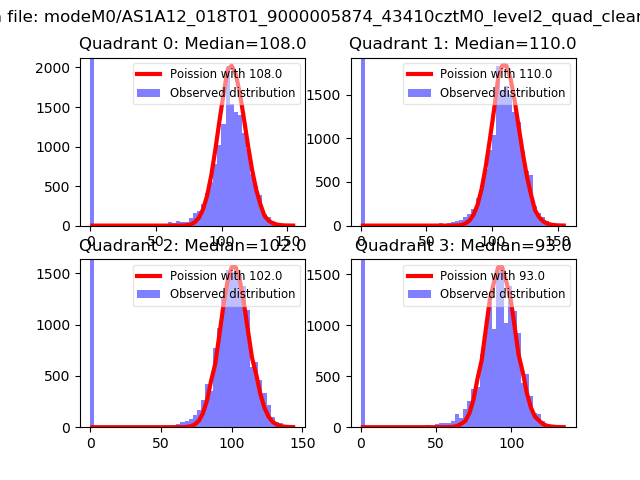 |
 |
| Quadrant-wise count rates Data is divided into 100 sec bins |
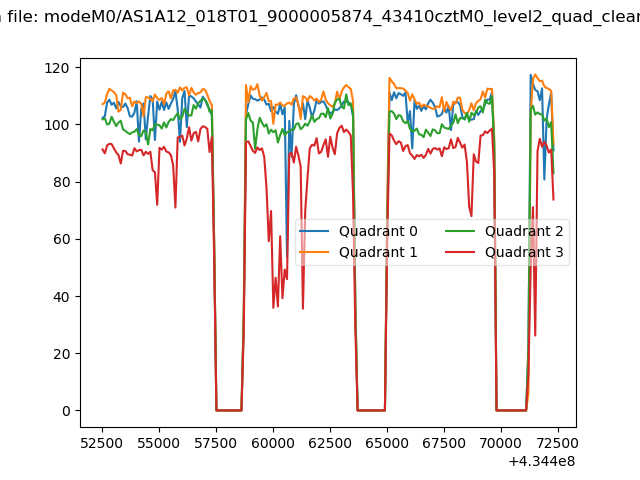 |
|
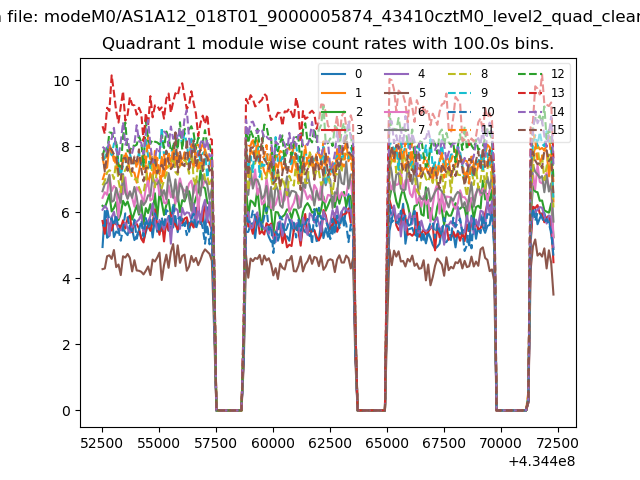
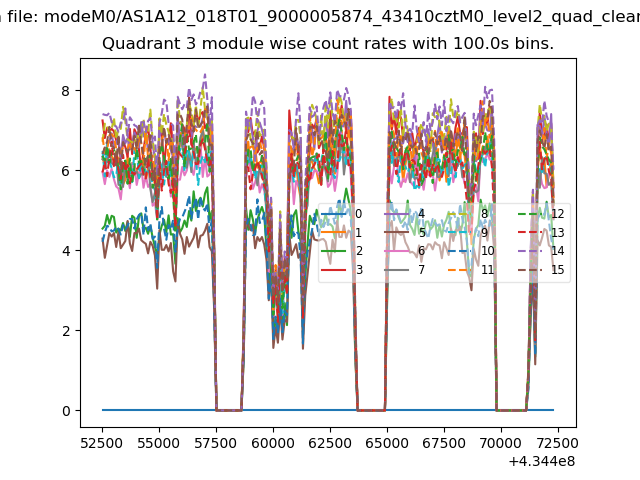
| Module-wise count rates for Quadrant A Data is divided into 100 sec bins |
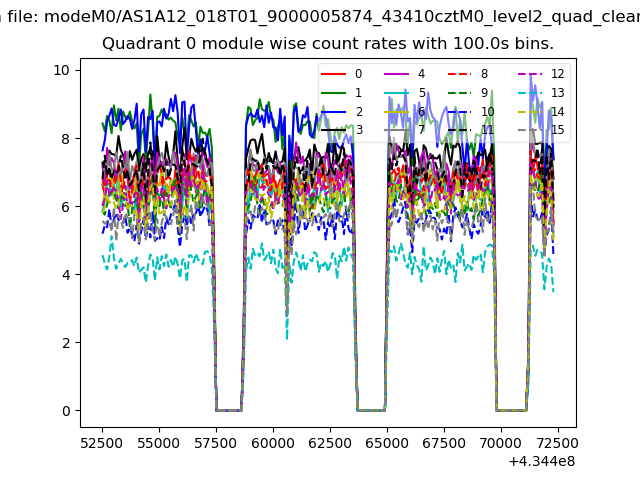 |
 |
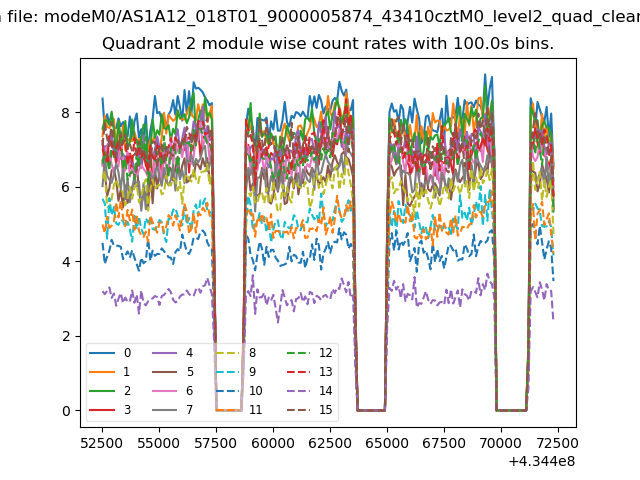
| Module-wise count rates for Quadrant B Data is divided into 100 sec bins |
 |
 |
| Module-wise count rates for Quadrant C Data is divided into 100 sec bins |
 |
 |
| Module-wise count rates for Quadrant D Data is divided into 100 sec bins |
 |
 |
| Parameter | Plot |
|---|---|
| CZT HV Monitor | 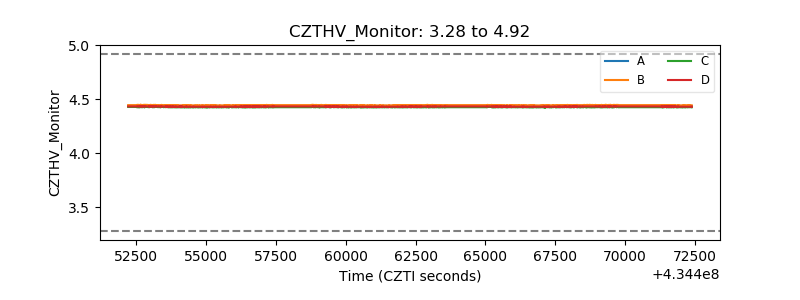 |
| D_VDD | 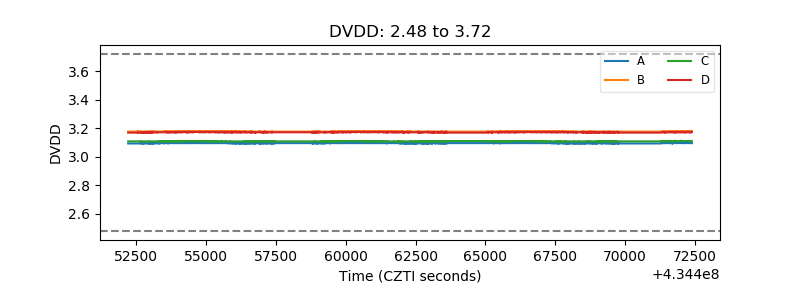 |
| Temperature 1 | 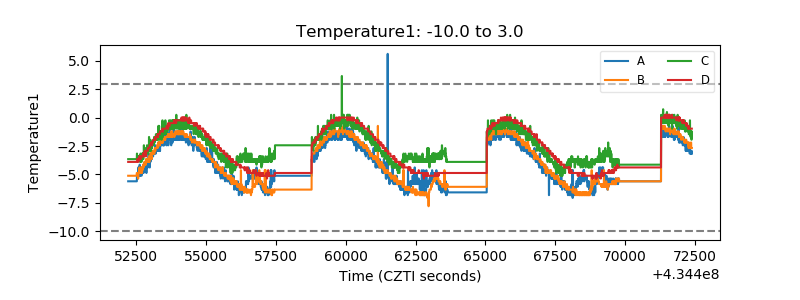 |
| Veto HV Monitor | 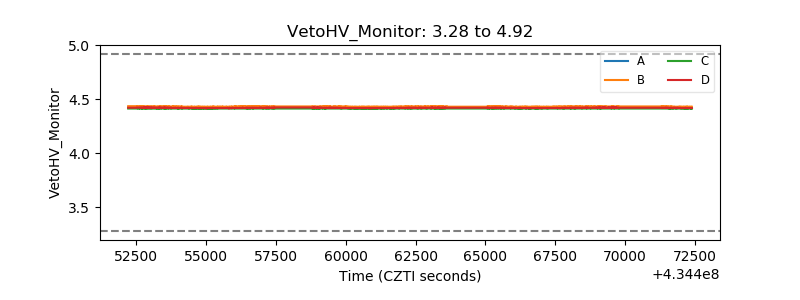 |
| Veto LLD | 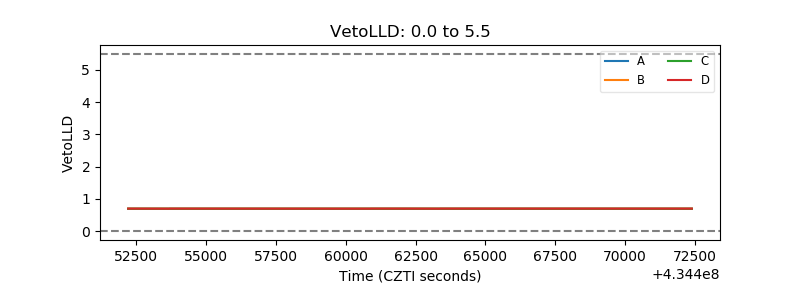 |
| Alpha Counter | 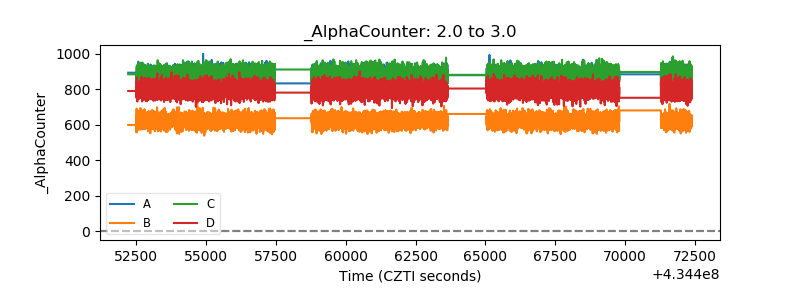 |
| _CPM_Rate | 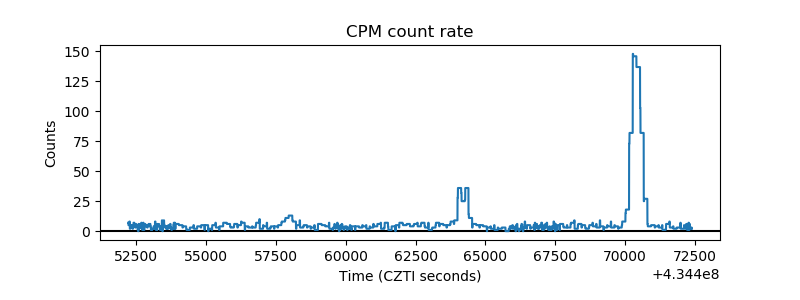 |
| CZT Counter | 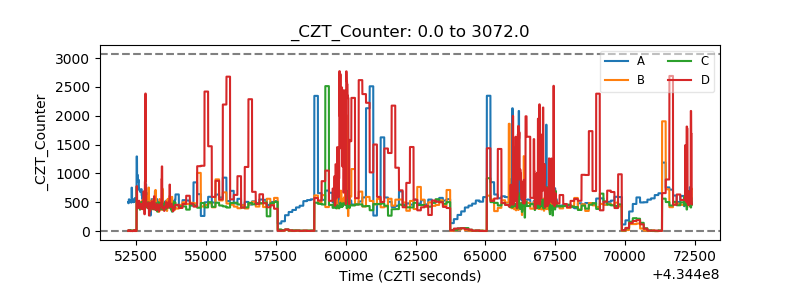 |
| +2.5 Volts monitor | 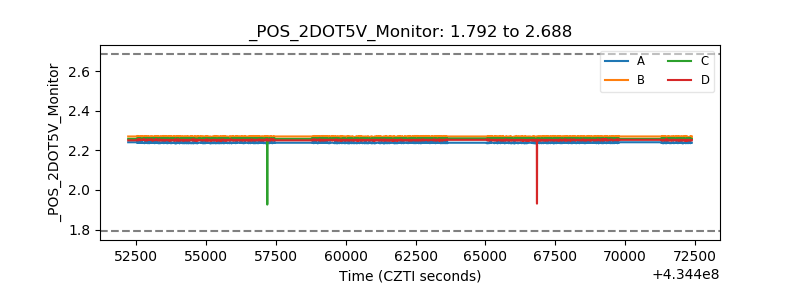 |
| +5 Volts monitor | 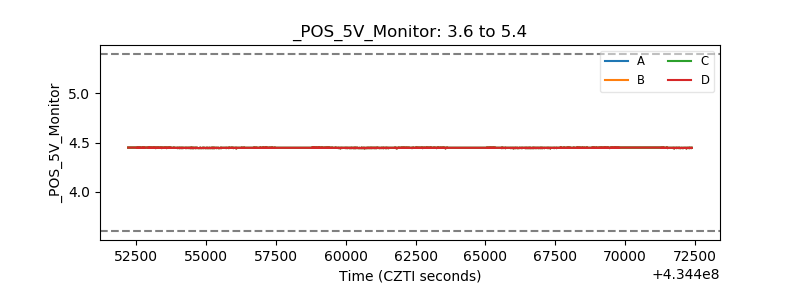 |
| _ROLL_ROT | 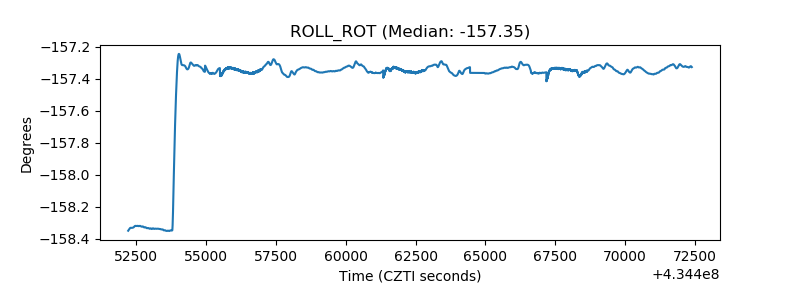 |
| _Roll_DEC | 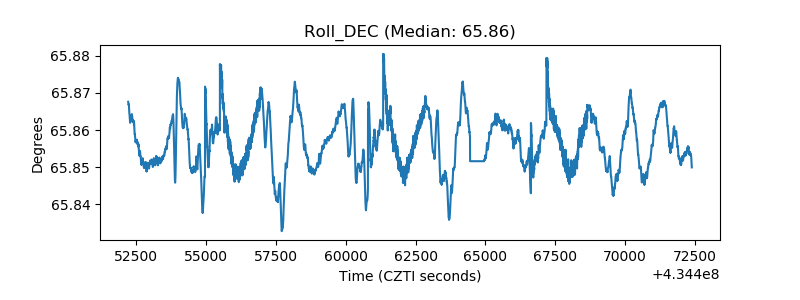 |
| _Roll_RA | 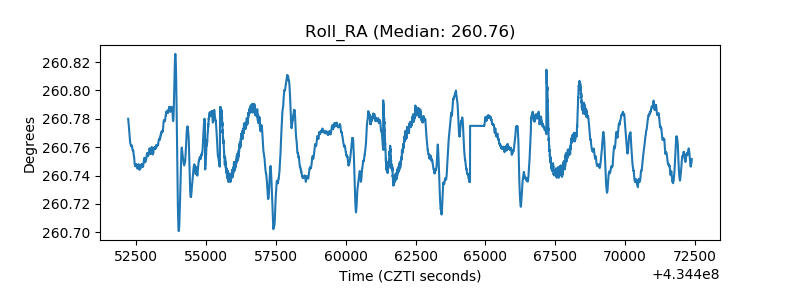 |
| Veto Counter | 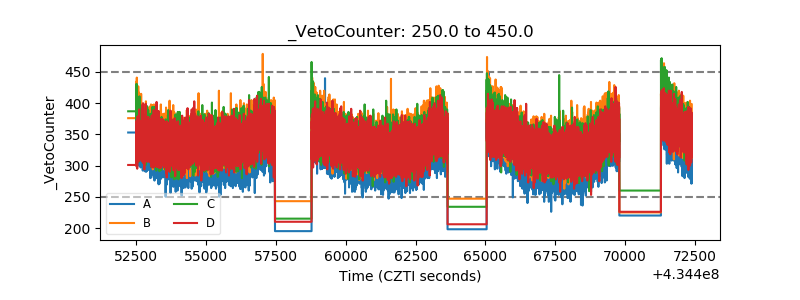 |