| Param | Original file | Final file |
|---|---|---|
| Filename | modeM0/AS1A12_018T01_9000005874_43411cztM0_level2.fits | modeM0/AS1A12_018T01_9000005874_43411cztM0_level2_quad_clean.evt |
| Size (bytes) | 358,539,840 | 86,040,000 |
| Size | 341.9 MB | 82.1 MB |
| Events in quadrant A | 3,535,610 | 564,937 |
| Events in quadrant B | 2,708,792 | 594,495 |
| Events in quadrant C | 2,639,345 | 558,727 |
| Events in quadrant D | 3,971,519 | 511,632 |
| Mode M0 | |||
|---|---|---|---|
| Quadrant | BADHDUFLAG | Total packets | Discarded packets |
| A | 0 | 13866 | 1 |
| B | 0 | 11710 | 2 |
| C | 0 | 11346 | 1 |
| D | 0 | 15518 | 1 |
| Mode M9 | |||
|---|---|---|---|
| Quadrant | BADHDUFLAG | Total packets | Discarded packets |
| A | 0 | 16 | 0 |
| B | 0 | 16 | 0 |
| C | 0 | 16 | 0 |
| D | 0 | 16 | 0 |
| Mode SS | |||
|---|---|---|---|
| Quadrant | BADHDUFLAG | Total packets | Discarded packets |
| A | 0 | 110 | 0 |
| B | 0 | 110 | 0 |
| C | 0 | 110 | 0 |
| D | 0 | 110 | 0 |
| Quadrant | Total seconds | Saturated seconds | Saturation percentage |
|---|---|---|---|
| A | 5355 | 239 | 4.463119% |
| B | 5354 | 28 | 0.522973% |
| C | 5355 | 8 | 0.149393% |
| D | 5355 | 139 | 2.595705% |
Noise dominated data is calculated using 1-second bins in cleaned event files. If a bin has >2000 counts, and if more than 50% of those come from <1% of pixels, then it is considered to be noise-dominated and hence unusable.
| Quadrant | # 1 sec bins | Bins with >0 counts | Bins with >2000 counts | High rate bins dominated by noise | Noise dominated (total time) | Noise dominated (detector-on time) | Marked lightcurve |
|---|---|---|---|---|---|---|---|
| A | 6968 | 5356 | 197 | 197 | 2.83% | 3.68% | 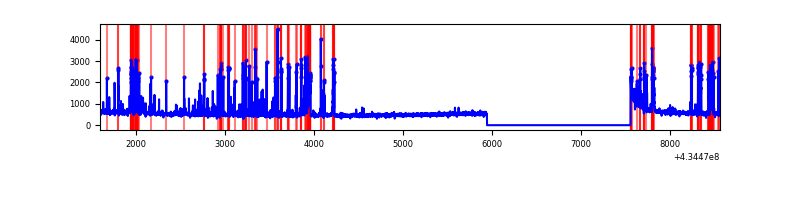 |
| B | 6967 | 5355 | 18 | 18 | 0.26% | 0.34% | 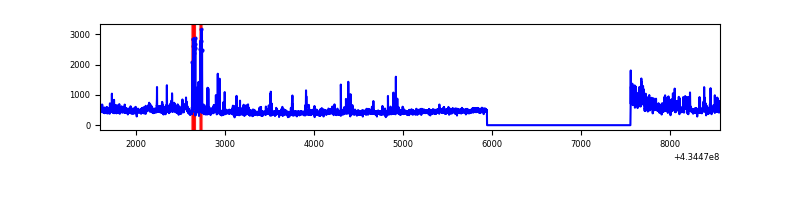 |
| C | 6968 | 5356 | 3 | 3 | 0.04% | 0.06% | 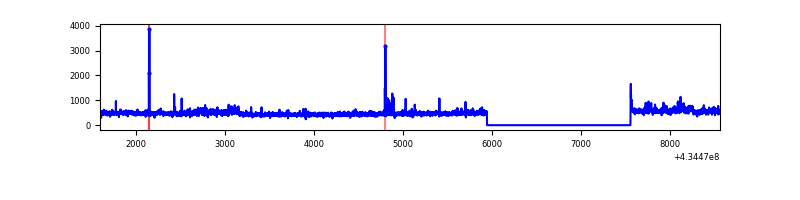 |
| D | 6968 | 5356 | 157 | 157 | 2.25% | 2.93% | 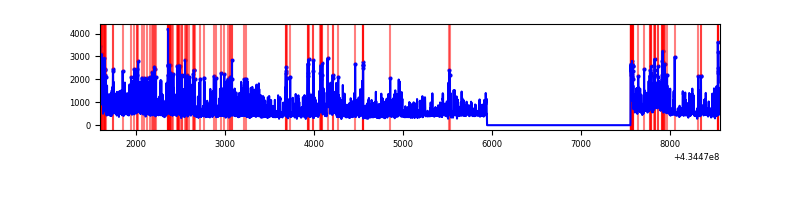 |
Top three noisy pixels from each quadrant. If the there are fewer than three noisy pixels in the level2.evt file, extra rows are filled as -1
| Pixel properties | Quadrant properties | ||||||
|---|---|---|---|---|---|---|---|
| Quadrant | DetID | PixID | Counts | Sigma | Mean | Median | Sigma |
| A | 15 | 237 | 790224 | 6862.88 | 556 | 543 | 115.1 |
| A | 10 | 83 | 546777 | 4747.15 | 556 | 543 | 115.1 |
| A | 13 | 248 | 15440 | 129.47 | 556 | 543 | 115.1 |
| B | 0 | 189 | 223669 | 2051.5 | 569 | 554 | 108.8 |
| B | 0 | 190 | 85790 | 783.73 | 569 | 554 | 108.8 |
| B | 15 | 85 | 75978 | 693.51 | 569 | 554 | 108.8 |
| C | 15 | 214 | 218934 | 1659.69 | 560 | 562 | 131.6 |
| C | 3 | 233 | 189108 | 1433.01 | 560 | 562 | 131.6 |
| C | 0 | 207 | 24590 | 182.62 | 560 | 562 | 131.6 |
| D | 2 | 16 | 732825 | 5423.84 | 554 | 537 | 135.0 |
| D | 1 | 52 | 611042 | 4521.83 | 554 | 537 | 135.0 |
| D | 12 | 233 | 144737 | 1068.05 | 554 | 537 | 135.0 |
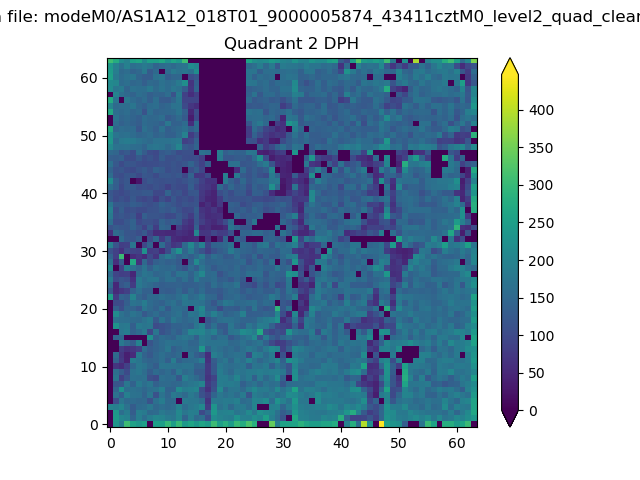
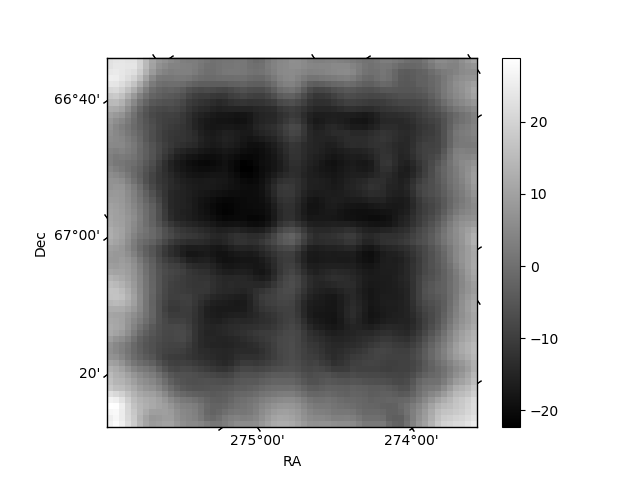
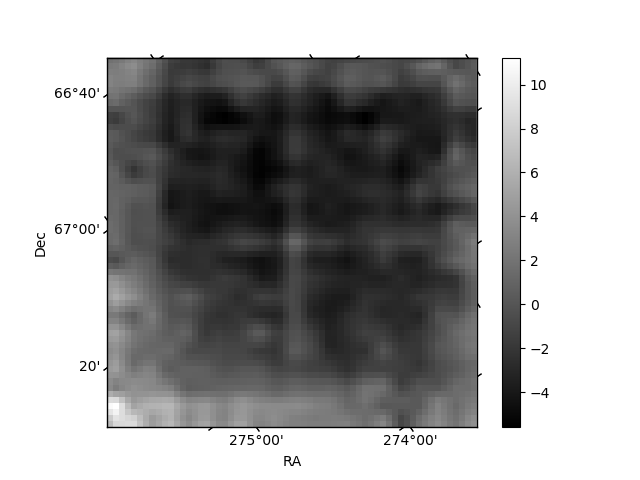
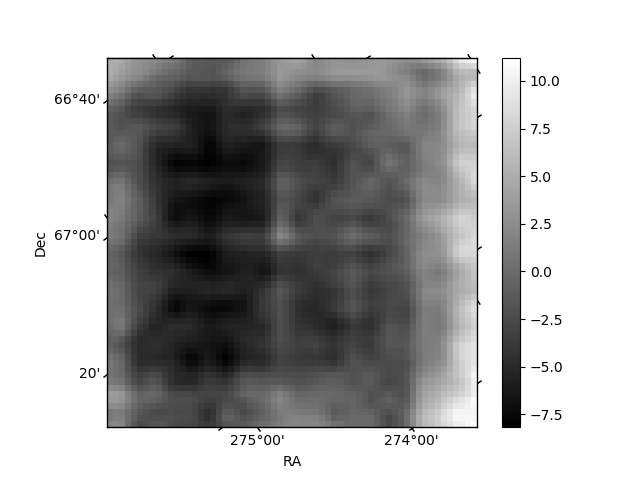
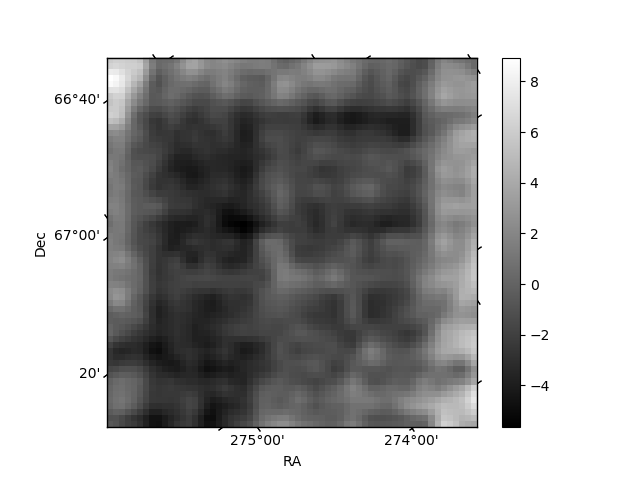
Histogram calculated using DETX and DETY for each event in the final _common_clean file
| Quadrant A | 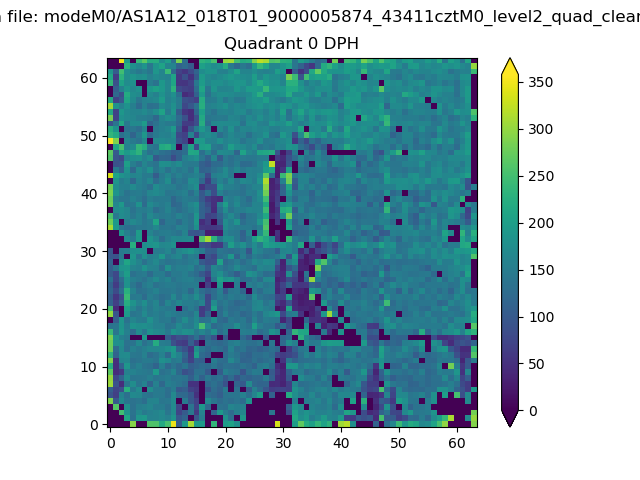 |
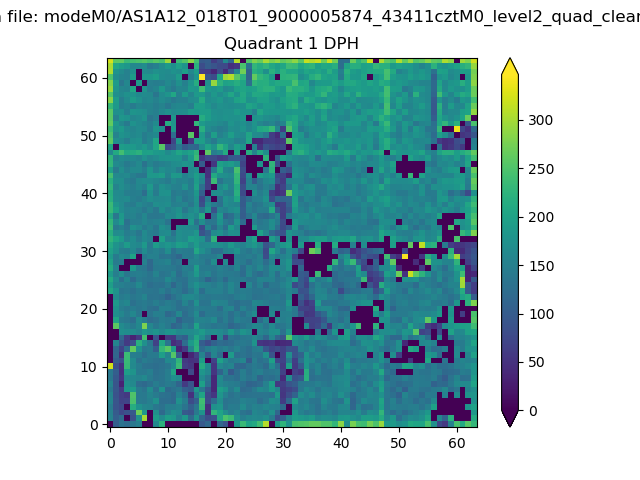 |
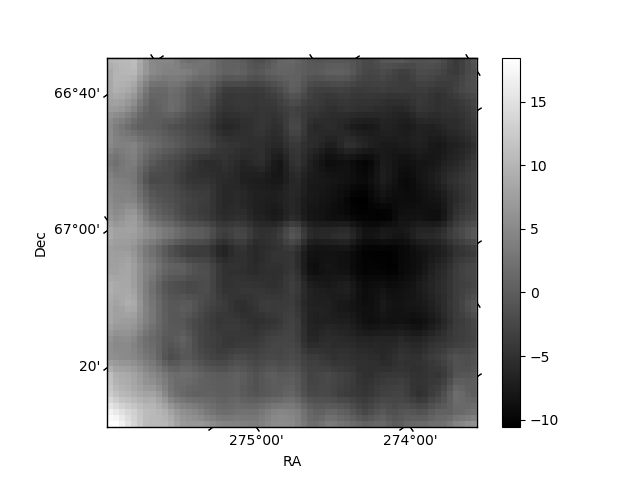
Quadrant B |
|---|---|---|---|
| Quadrant D | 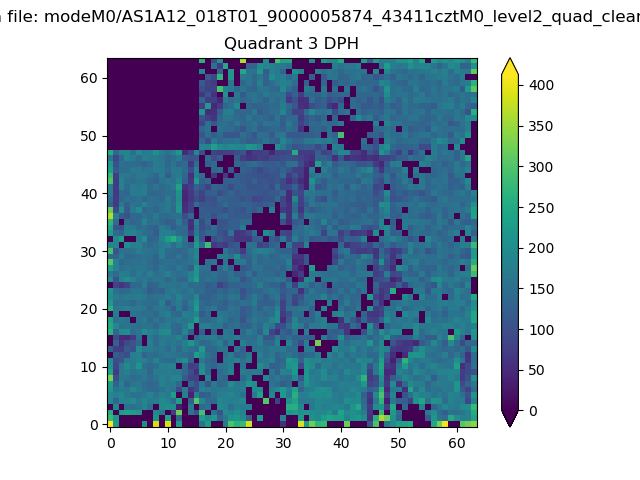 |
 |
Quadrant C |
| Plot type | Count rate plots | Images |
|---|---|---|
| Comparison with Poisson distribution Blue bars denote a histogram of data divided into 1 sec bins. Red curve is a Poisson curve with rate = median count rate of data. |
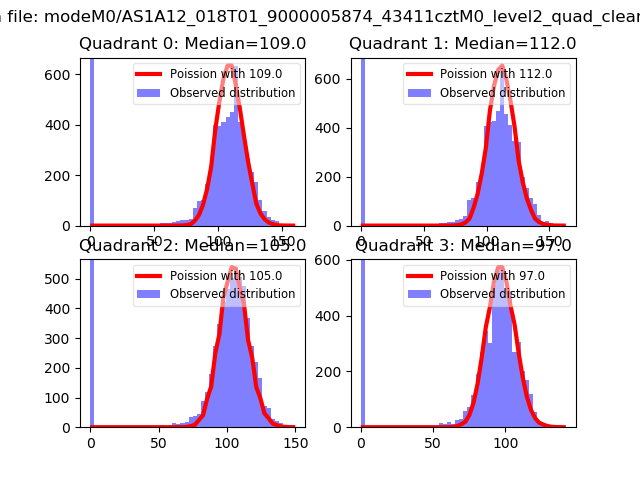 |
 |
| Quadrant-wise count rates Data is divided into 100 sec bins |
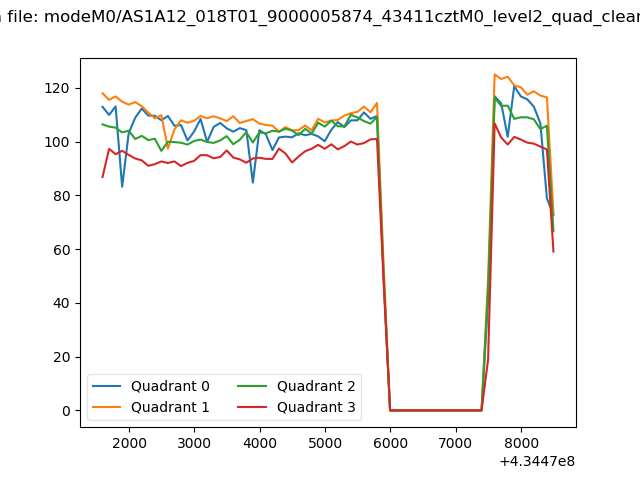 |
|
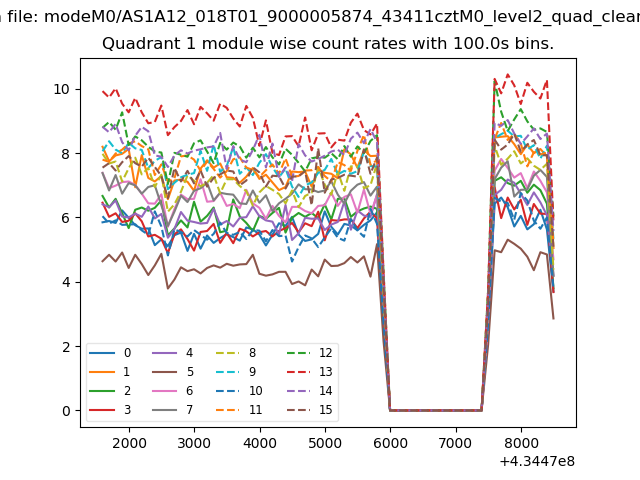
| Module-wise count rates for Quadrant A Data is divided into 100 sec bins |
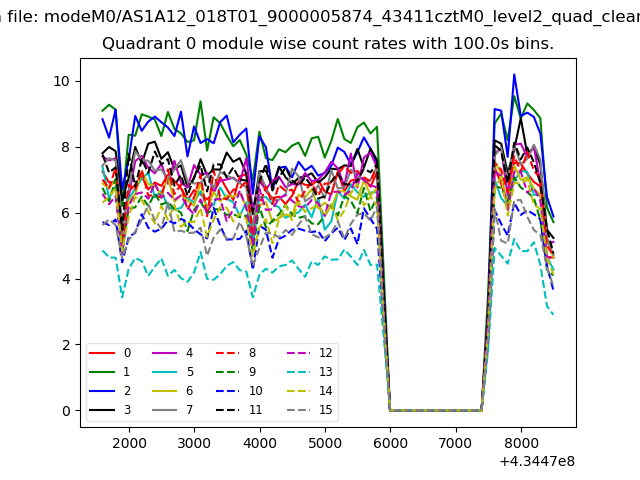 |
 |
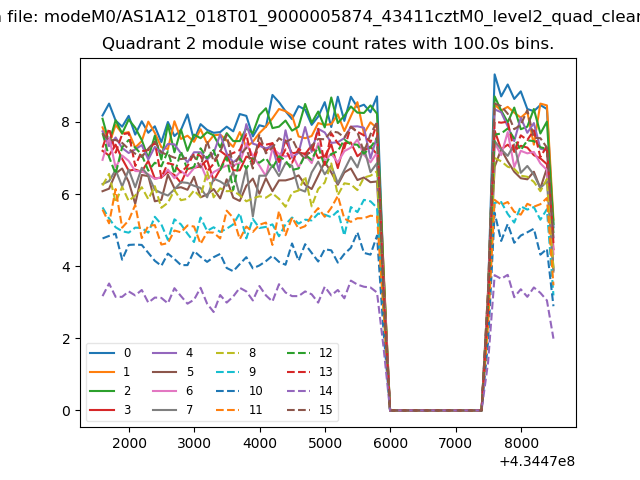
| Module-wise count rates for Quadrant B Data is divided into 100 sec bins |
 |
 |
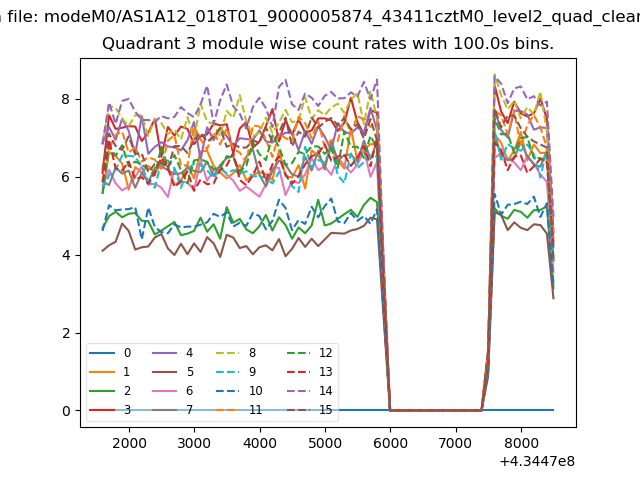
| Module-wise count rates for Quadrant C Data is divided into 100 sec bins |
 |
 |
| Module-wise count rates for Quadrant D Data is divided into 100 sec bins |
 |
 |
| Parameter | Plot |
|---|---|
| CZT HV Monitor | 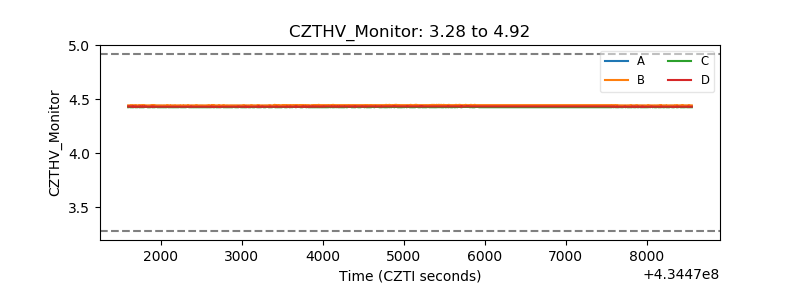 |
| D_VDD | 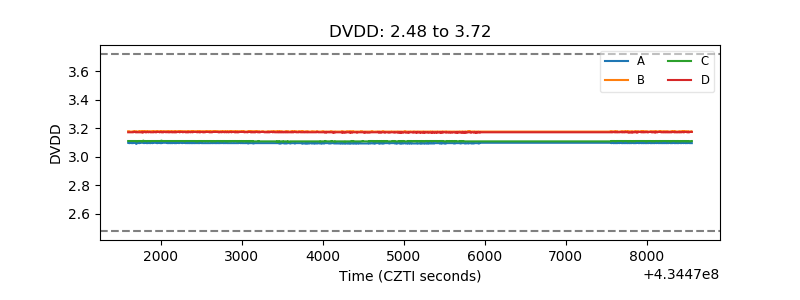 |
| Temperature 1 | 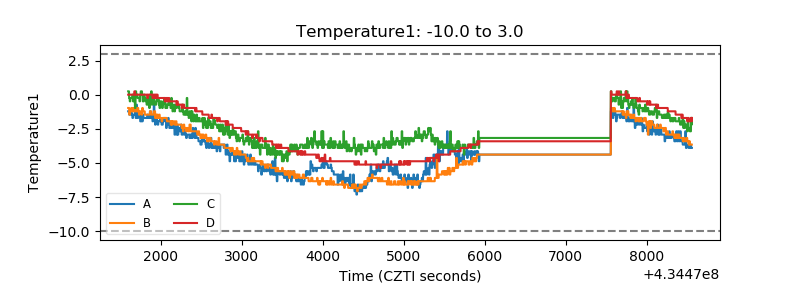 |
| Veto HV Monitor | 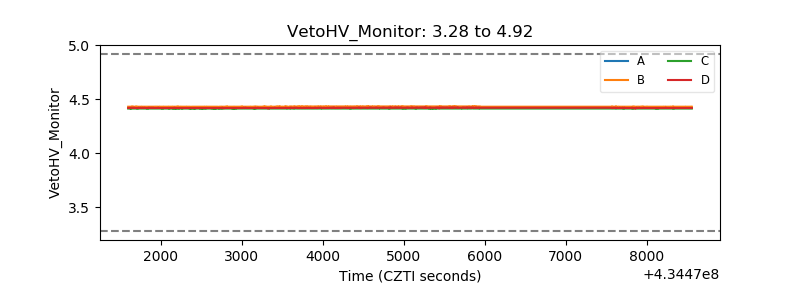 |
| Veto LLD | 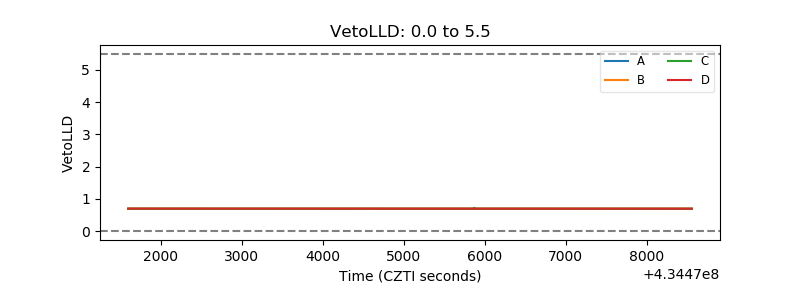 |
| Alpha Counter | 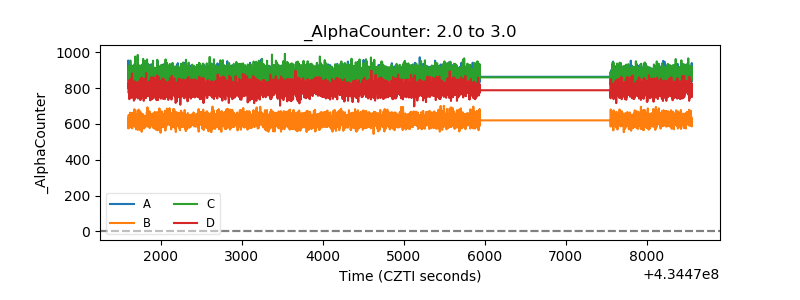 |
| _CPM_Rate | 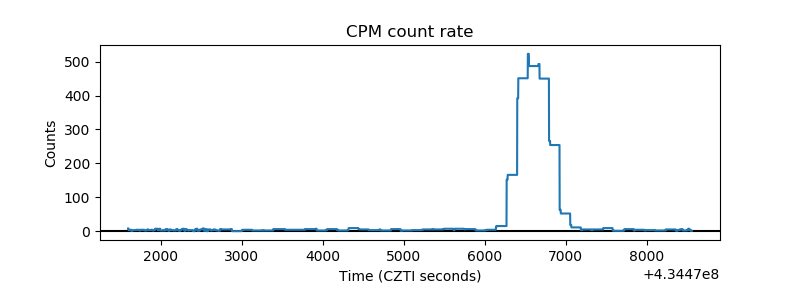 |
| CZT Counter | 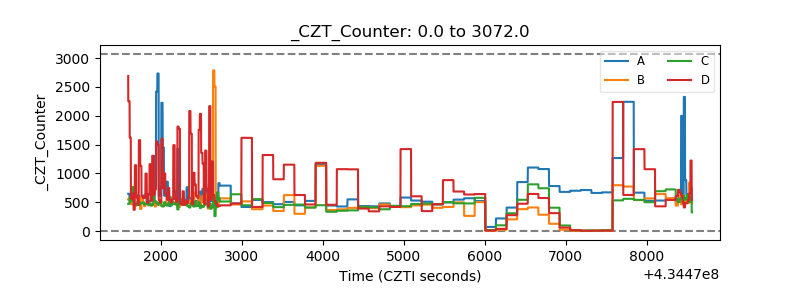 |
| +2.5 Volts monitor | 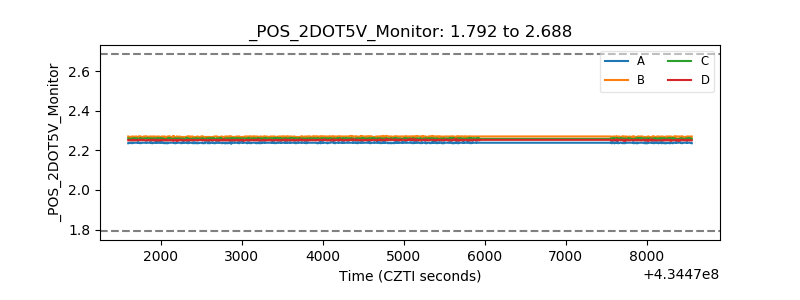 |
| +5 Volts monitor | 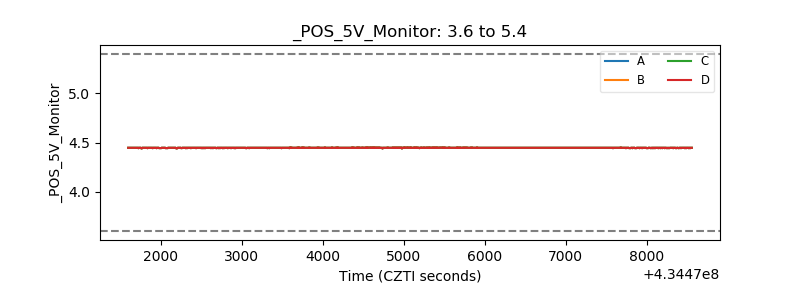 |
| _ROLL_ROT | 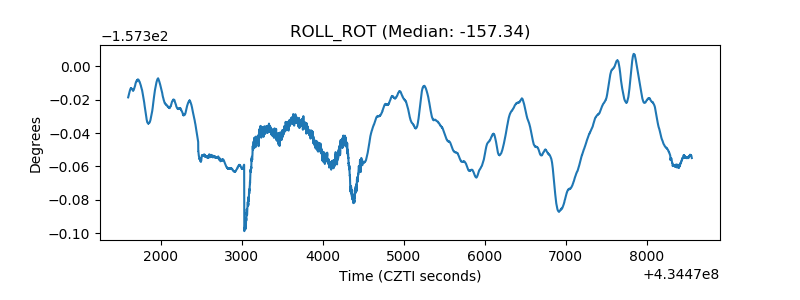 |
| _Roll_DEC | 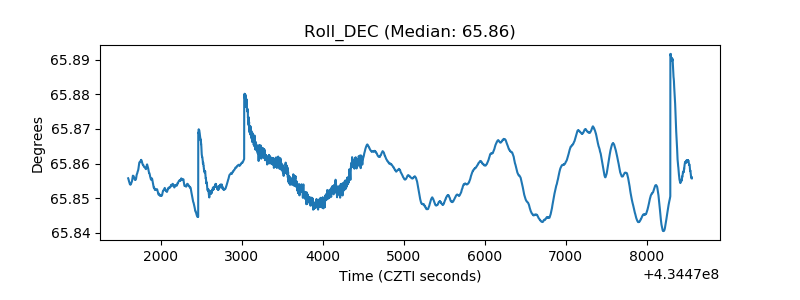 |
| _Roll_RA |  |
| Veto Counter | 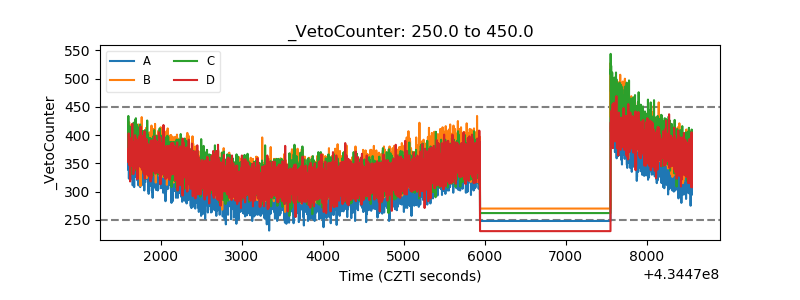 |