| Param | Original file | Final file |
|---|---|---|
| Filename | modeM0/AS1A12_018T01_9000005874_43414cztM0_level2.fits | modeM0/AS1A12_018T01_9000005874_43414cztM0_level2_quad_clean.evt |
| Size (bytes) | 341,553,600 | 87,215,040 |
| Size | 325.7 MB | 83.2 MB |
| Events in quadrant A | 3,152,291 | 581,439 |
| Events in quadrant B | 2,447,820 | 607,387 |
| Events in quadrant C | 2,589,343 | 580,616 |
| Events in quadrant D | 4,054,060 | 511,326 |
| Mode M0 | |||
|---|---|---|---|
| Quadrant | BADHDUFLAG | Total packets | Discarded packets |
| A | 0 | 12587 | 2 |
| B | 0 | 10727 | 3 |
| C | 0 | 11005 | 2 |
| D | 0 | 15779 | 2 |
| Mode M9 | |||
|---|---|---|---|
| Quadrant | BADHDUFLAG | Total packets | Discarded packets |
| A | 0 | 29 | 0 |
| B | 0 | 30 | 0 |
| C | 0 | 30 | 0 |
| D | 0 | 30 | 0 |
| Mode SS | |||
|---|---|---|---|
| Quadrant | BADHDUFLAG | Total packets | Discarded packets |
| A | 0 | 106 | 0 |
| B | 0 | 106 | 0 |
| C | 0 | 106 | 0 |
| D | 0 | 106 | 0 |
| Quadrant | Total seconds | Saturated seconds | Saturation percentage |
|---|---|---|---|
| A | 5134 | 102 | 1.986755% |
| B | 5133 | 19 | 0.370154% |
| C | 5133 | 12 | 0.233781% |
| D | 5133 | 273 | 5.318527% |
Noise dominated data is calculated using 1-second bins in cleaned event files. If a bin has >2000 counts, and if more than 50% of those come from <1% of pixels, then it is considered to be noise-dominated and hence unusable.
| Quadrant | # 1 sec bins | Bins with >0 counts | Bins with >2000 counts | High rate bins dominated by noise | Noise dominated (total time) | Noise dominated (detector-on time) | Marked lightcurve |
|---|---|---|---|---|---|---|---|
| A | 7016 | 5135 | 86 | 86 | 1.23% | 1.67% | 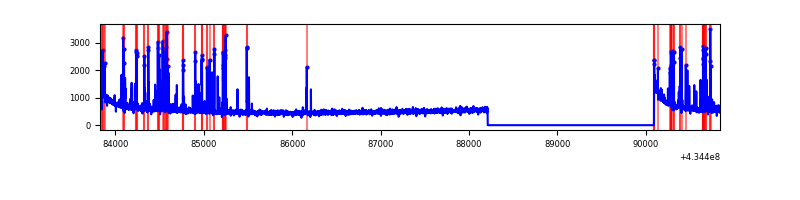 |
| B | 7015 | 5134 | 10 | 10 | 0.14% | 0.19% | 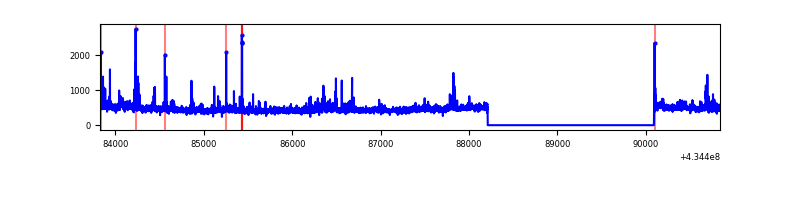 |
| C | 7015 | 5134 | 7 | 7 | 0.10% | 0.14% | 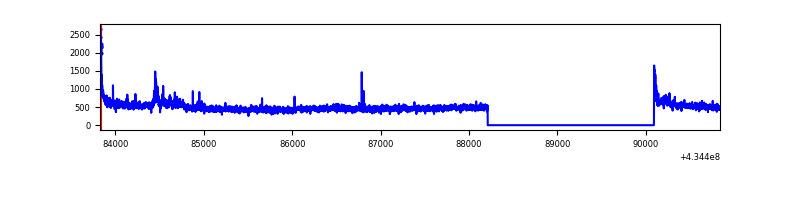 |
| D | 7015 | 5134 | 276 | 276 | 3.93% | 5.38% | 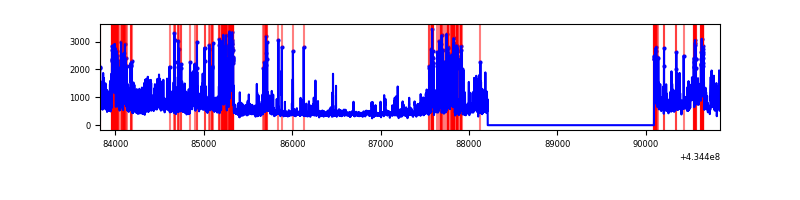 |
Top three noisy pixels from each quadrant. If the there are fewer than three noisy pixels in the level2.evt file, extra rows are filled as -1
| Pixel properties | Quadrant properties | ||||||
|---|---|---|---|---|---|---|---|
| Quadrant | DetID | PixID | Counts | Sigma | Mean | Median | Sigma |
| A | 10 | 83 | 599004 | 5317.25 | 551 | 540 | 112.6 |
| A | 15 | 237 | 366698 | 3253.25 | 551 | 540 | 112.6 |
| A | 13 | 6 | 23609 | 204.96 | 551 | 540 | 112.6 |
| B | 0 | 189 | 148249 | 1390.55 | 560 | 546 | 106.2 |
| B | 0 | 245 | 54121 | 504.38 | 560 | 546 | 106.2 |
| B | 5 | 255 | 19530 | 178.73 | 560 | 546 | 106.2 |
| C | 15 | 214 | 214886 | 1676.94 | 552 | 556 | 127.8 |
| C | 3 | 233 | 206275 | 1609.57 | 552 | 556 | 127.8 |
| C | 15 | 159 | 12935 | 96.85 | 552 | 556 | 127.8 |
| D | 1 | 52 | 936674 | 7090.62 | 538 | 523 | 132.0 |
| D | 2 | 16 | 278641 | 2106.53 | 538 | 523 | 132.0 |
| D | 1 | 47 | 174845 | 1320.36 | 538 | 523 | 132.0 |
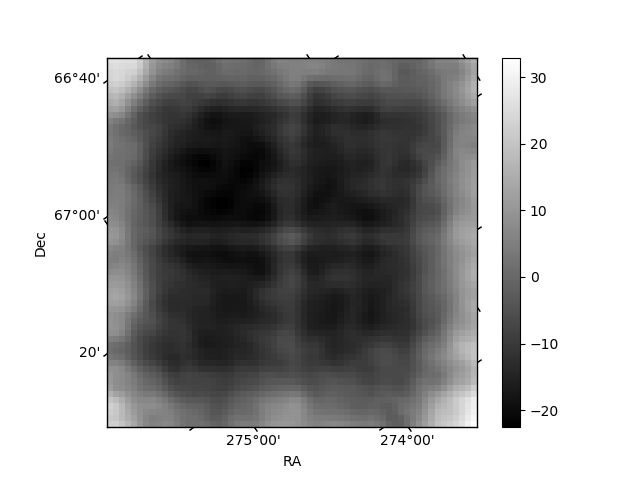
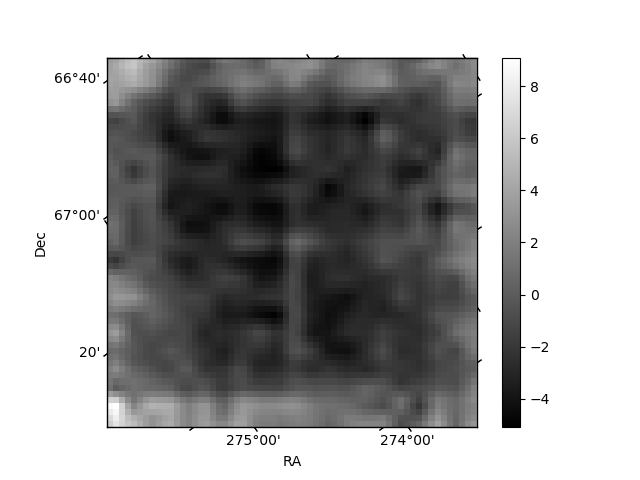
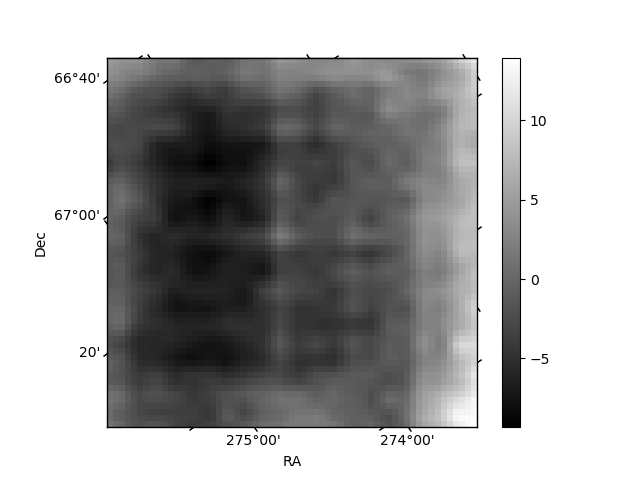
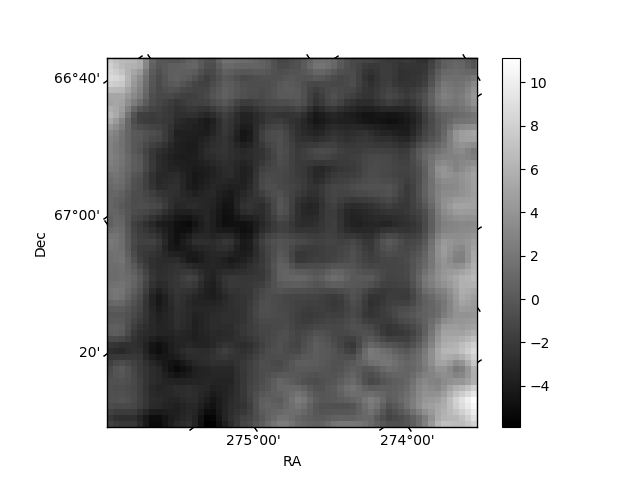
Histogram calculated using DETX and DETY for each event in the final _common_clean file
| Quadrant A | 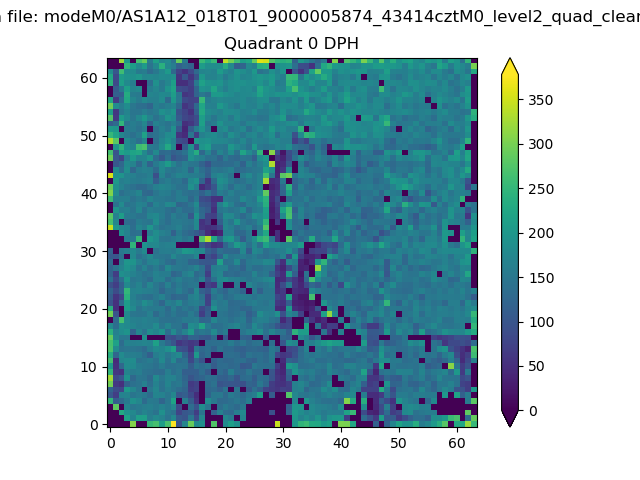 |
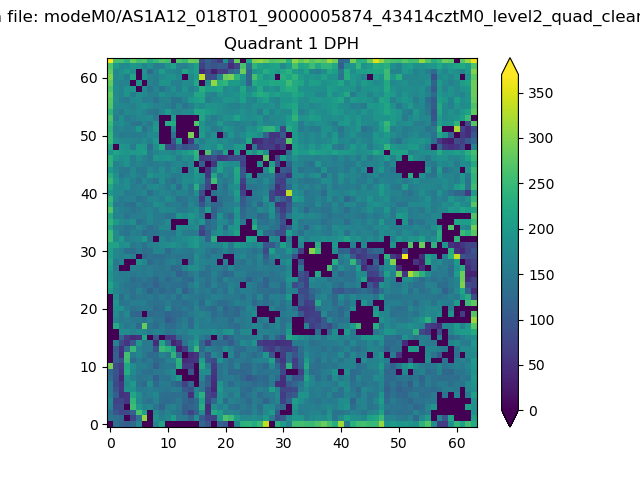 |
Quadrant B |
|---|---|---|---|
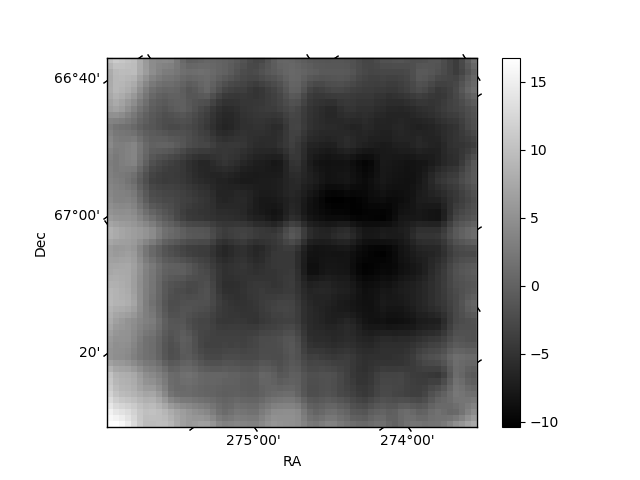
| Quadrant D | 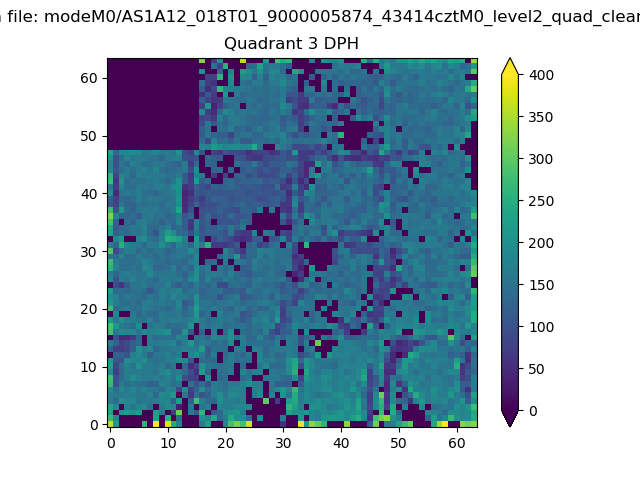 |
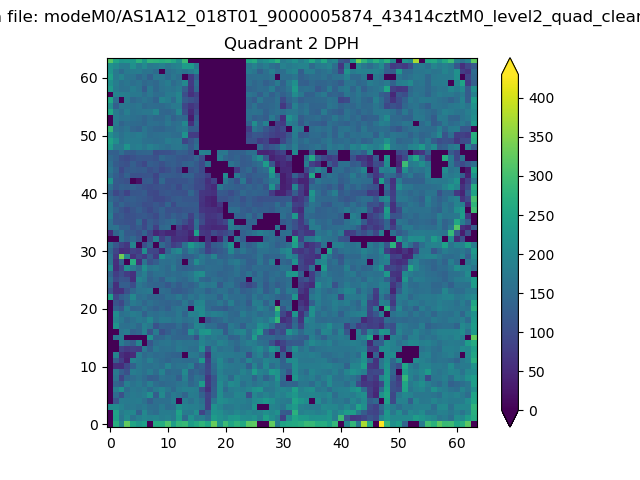 |
Quadrant C |
| Plot type | Count rate plots | Images |
|---|---|---|
| Comparison with Poisson distribution Blue bars denote a histogram of data divided into 1 sec bins. Red curve is a Poisson curve with rate = median count rate of data. |
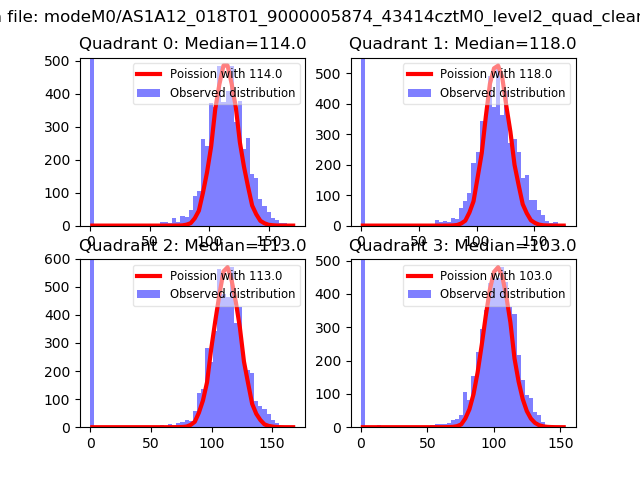 |
 |
| Quadrant-wise count rates Data is divided into 100 sec bins |
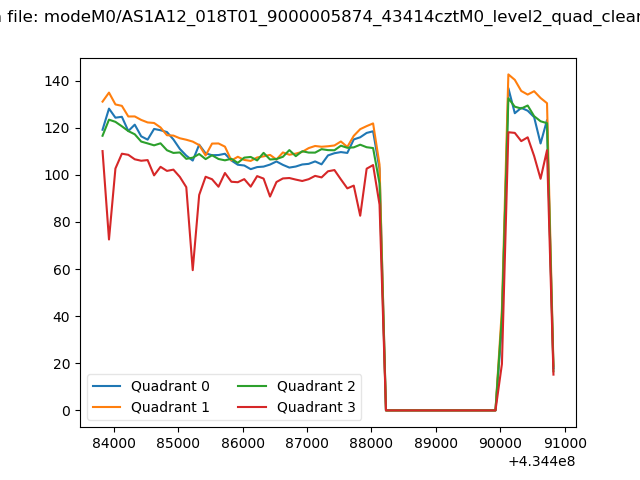 |
|
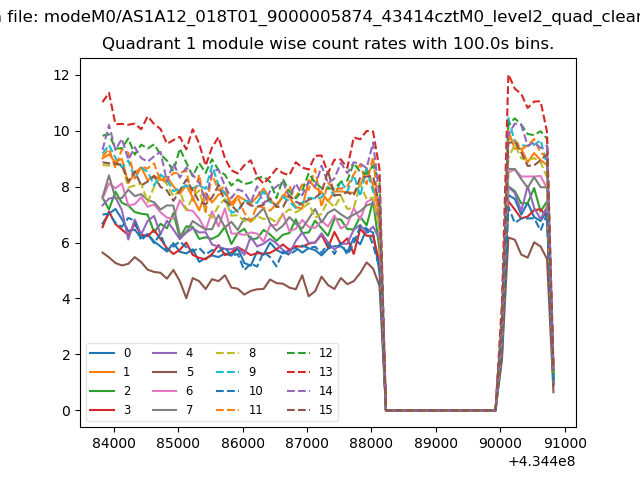
| Module-wise count rates for Quadrant A Data is divided into 100 sec bins |
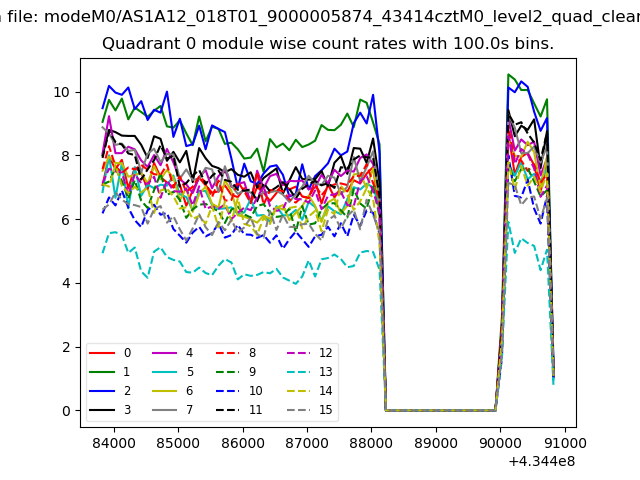 |
 |
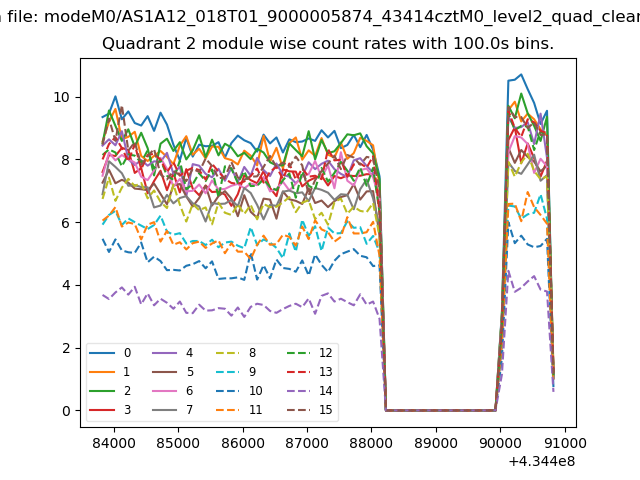
| Module-wise count rates for Quadrant B Data is divided into 100 sec bins |
 |
 |
| Module-wise count rates for Quadrant C Data is divided into 100 sec bins |
 |
 |
| Module-wise count rates for Quadrant D Data is divided into 100 sec bins |
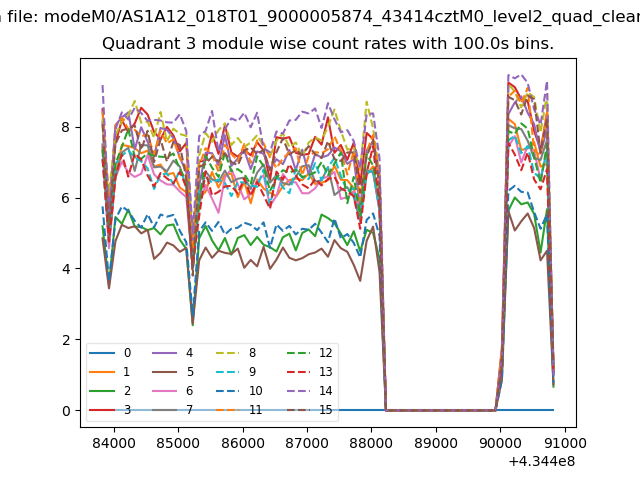 |
 |
| Parameter | Plot |
|---|---|
| CZT HV Monitor | 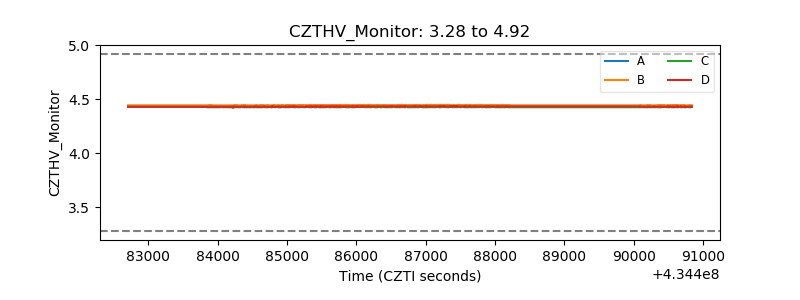 |
| D_VDD | 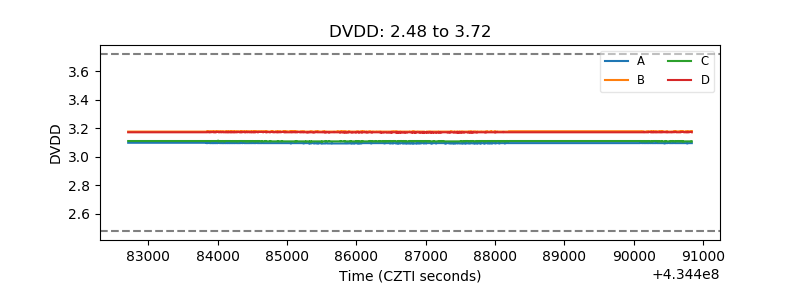 |
| Temperature 1 | 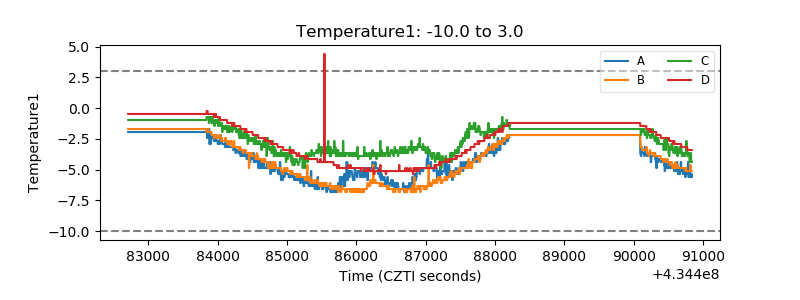 |
| Veto HV Monitor | 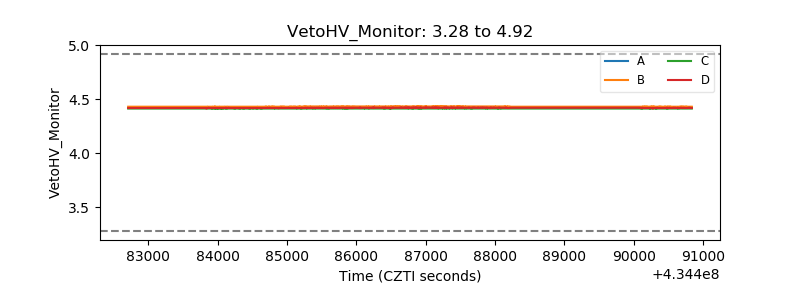 |
| Veto LLD | 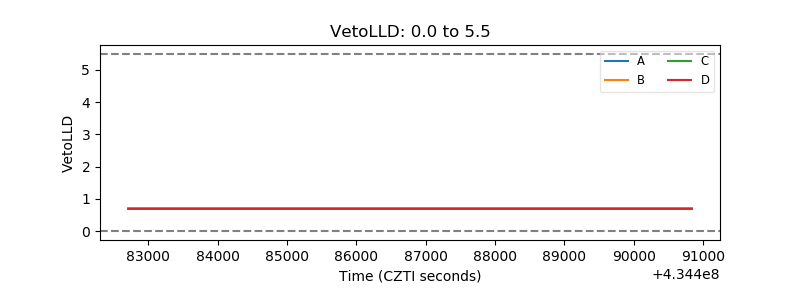 |
| Alpha Counter | 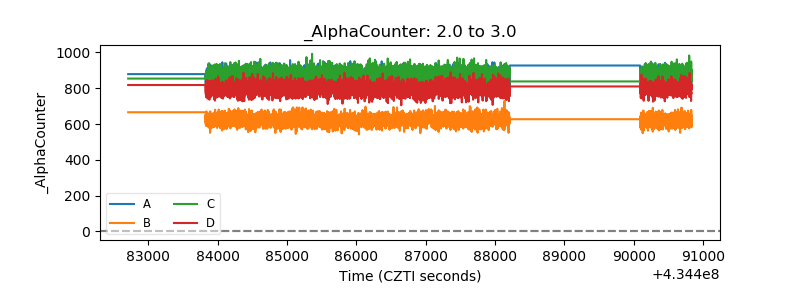 |
| _CPM_Rate | 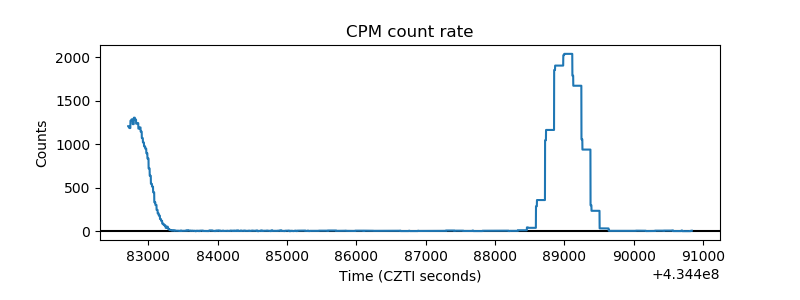 |
| CZT Counter | 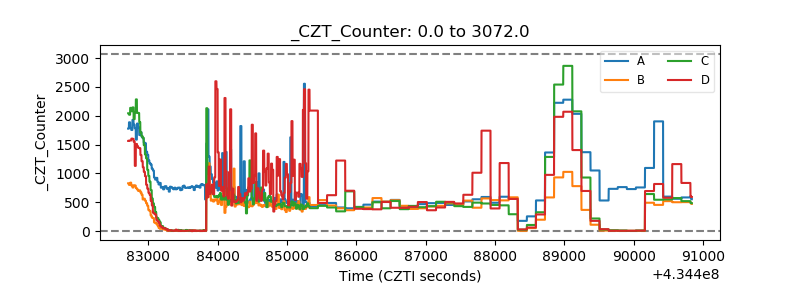 |
| +2.5 Volts monitor | 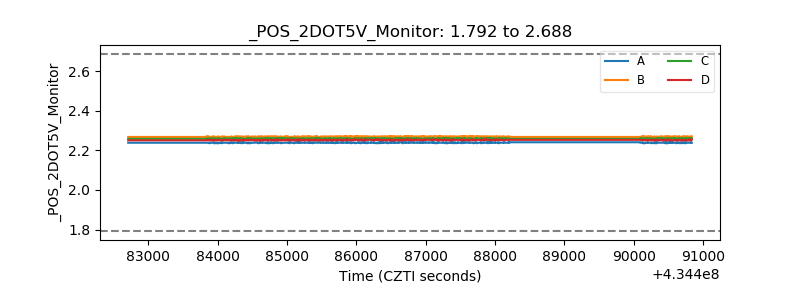 |
| +5 Volts monitor | 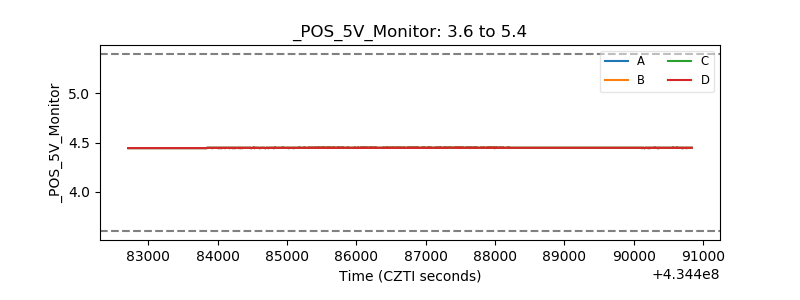 |
| _ROLL_ROT | 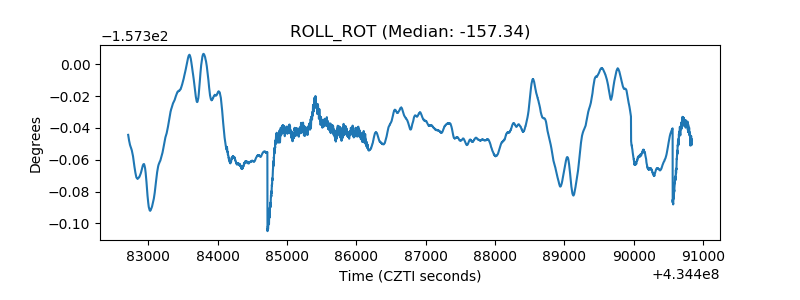 |
| _Roll_DEC | 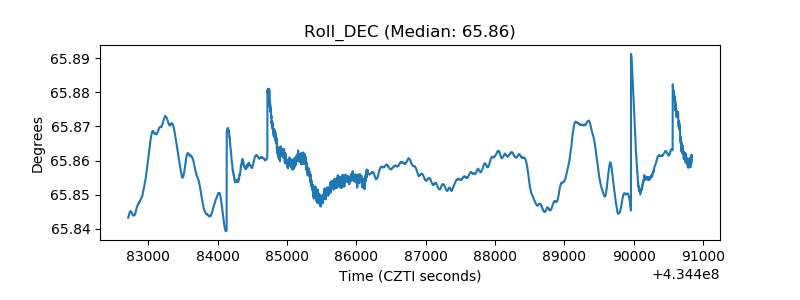 |
| _Roll_RA | 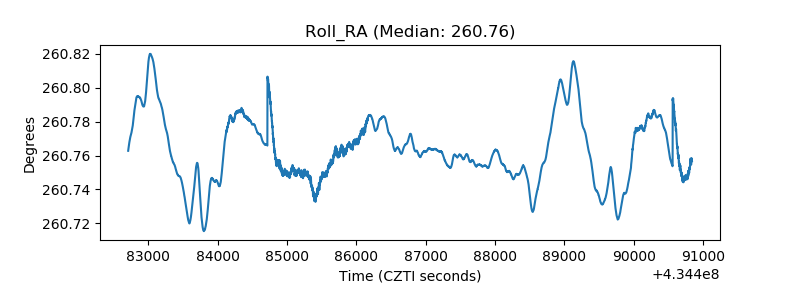 |
| Veto Counter | 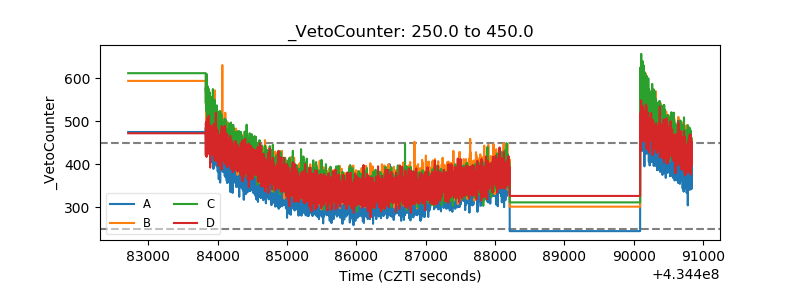 |