| Param | Original file | Final file |
|---|---|---|
| Filename | modeM0/AS1A12_018T01_9000005874_43415cztM0_level2.fits | modeM0/AS1A12_018T01_9000005874_43415cztM0_level2_quad_clean.evt |
| Size (bytes) | 326,586,240 | 85,956,480 |
| Size | 311.5 MB | 82.0 MB |
| Events in quadrant A | 2,917,633 | 574,346 |
| Events in quadrant B | 2,473,184 | 603,573 |
| Events in quadrant C | 2,404,341 | 576,808 |
| Events in quadrant D | 3,908,919 | 501,155 |
| Mode M0 | |||
|---|---|---|---|
| Quadrant | BADHDUFLAG | Total packets | Discarded packets |
| A | 0 | 11777 | 2 |
| B | 0 | 10535 | 3 |
| C | 0 | 10294 | 2 |
| D | 0 | 15136 | 2 |
| Mode M9 | |||
|---|---|---|---|
| Quadrant | BADHDUFLAG | Total packets | Discarded packets |
| A | 0 | 33 | 0 |
| B | 0 | 34 | 0 |
| C | 0 | 34 | 0 |
| D | 0 | 34 | 0 |
| Mode SS | |||
|---|---|---|---|
| Quadrant | BADHDUFLAG | Total packets | Discarded packets |
| A | 0 | 102 | 0 |
| B | 0 | 102 | 0 |
| C | 0 | 102 | 0 |
| D | 0 | 102 | 0 |
| Quadrant | Total seconds | Saturated seconds | Saturation percentage |
|---|---|---|---|
| A | 4944 | 77 | 1.557443% |
| B | 4943 | 15 | 0.303459% |
| C | 4943 | 5 | 0.101153% |
| D | 4943 | 289 | 5.846652% |
Noise dominated data is calculated using 1-second bins in cleaned event files. If a bin has >2000 counts, and if more than 50% of those come from <1% of pixels, then it is considered to be noise-dominated and hence unusable.
| Quadrant | # 1 sec bins | Bins with >0 counts | Bins with >2000 counts | High rate bins dominated by noise | Noise dominated (total time) | Noise dominated (detector-on time) | Marked lightcurve |
|---|---|---|---|---|---|---|---|
| A | 6946 | 4945 | 66 | 66 | 0.95% | 1.33% | 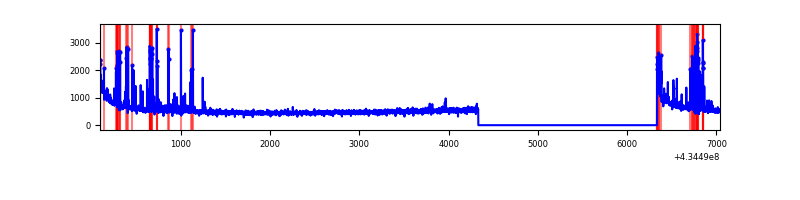 |
| B | 6945 | 4944 | 12 | 12 | 0.17% | 0.24% | 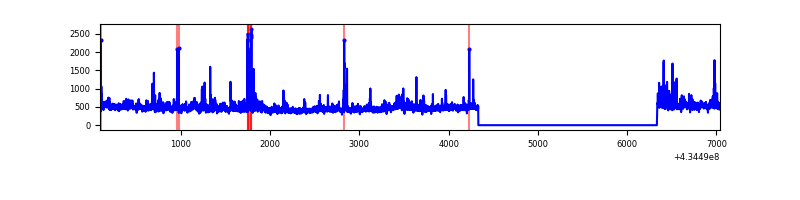 |
| C | 6945 | 4944 | 2 | 2 | 0.03% | 0.04% | 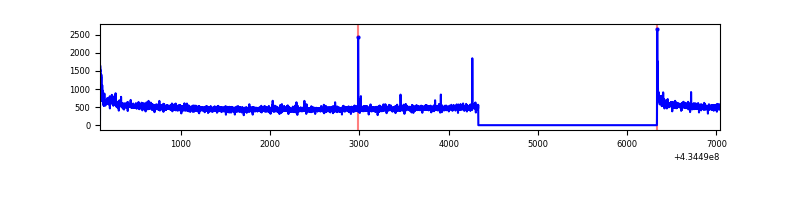 |
| D | 6945 | 4944 | 296 | 296 | 4.26% | 5.99% | 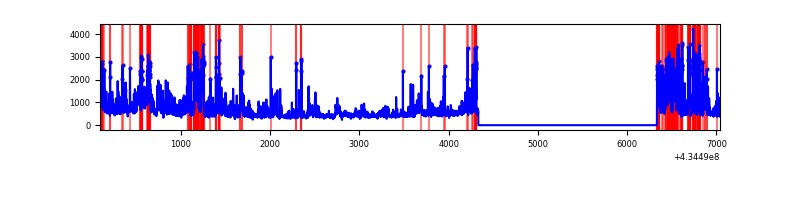 |
Top three noisy pixels from each quadrant. If the there are fewer than three noisy pixels in the level2.evt file, extra rows are filled as -1
| Pixel properties | Quadrant properties | ||||||
|---|---|---|---|---|---|---|---|
| Quadrant | DetID | PixID | Counts | Sigma | Mean | Median | Sigma |
| A | 10 | 83 | 554465 | 5059.76 | 537 | 527 | 109.5 |
| A | 15 | 237 | 260579 | 2375.36 | 537 | 527 | 109.5 |
| A | 13 | 6 | 17149 | 151.83 | 537 | 527 | 109.5 |
| B | 0 | 189 | 242326 | 2319.54 | 548 | 534 | 104.2 |
| B | 0 | 245 | 28894 | 272.06 | 548 | 534 | 104.2 |
| B | 5 | 255 | 23237 | 217.79 | 548 | 534 | 104.2 |
| C | 15 | 214 | 206394 | 1642.0 | 539 | 545 | 125.4 |
| C | 3 | 233 | 81208 | 643.43 | 539 | 545 | 125.4 |
| C | 15 | 159 | 12586 | 96.05 | 539 | 545 | 125.4 |
| D | 1 | 52 | 1042702 | 8210.84 | 520 | 505 | 126.9 |
| D | 2 | 16 | 264244 | 2077.84 | 520 | 505 | 126.9 |
| D | 5 | 222 | 227615 | 1789.26 | 520 | 505 | 126.9 |
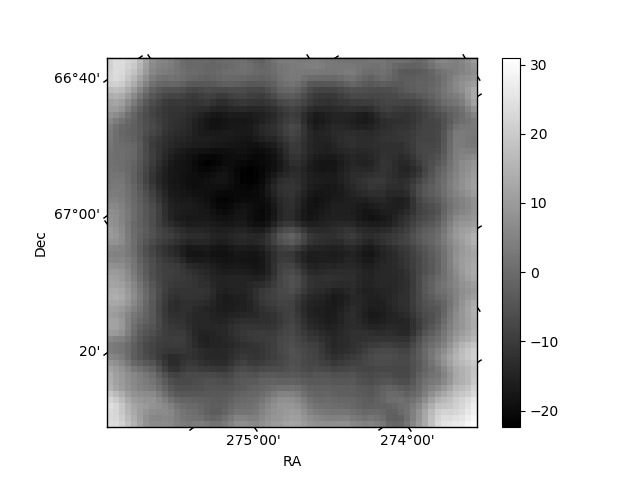
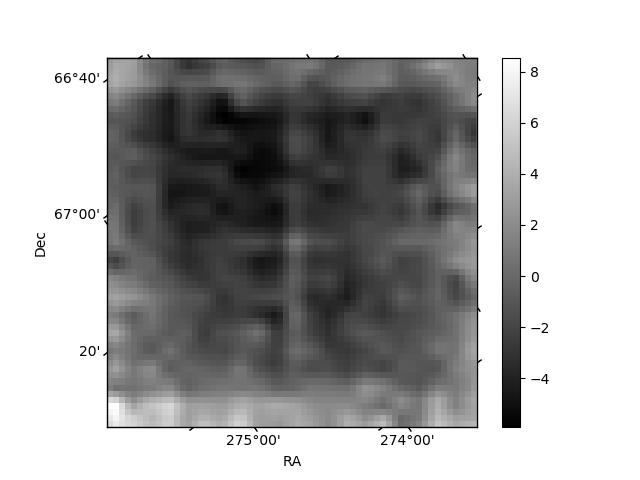
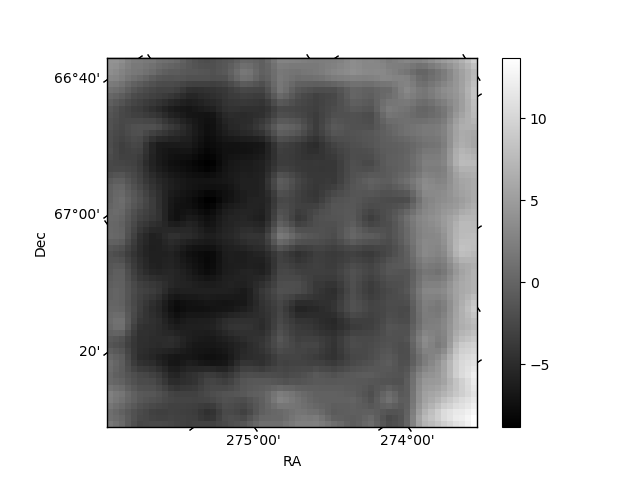
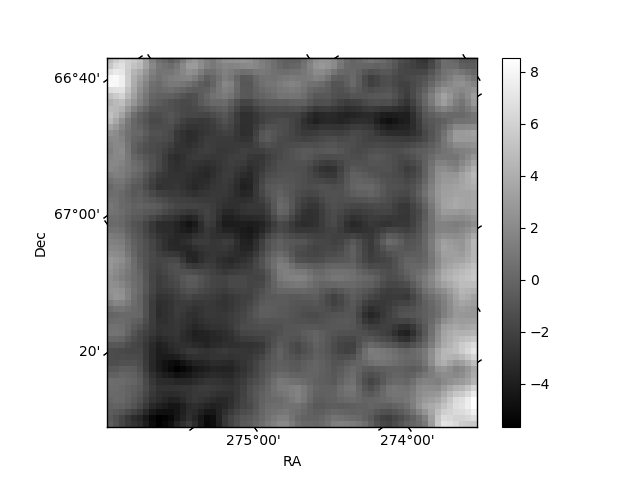
Histogram calculated using DETX and DETY for each event in the final _common_clean file
| Quadrant A | 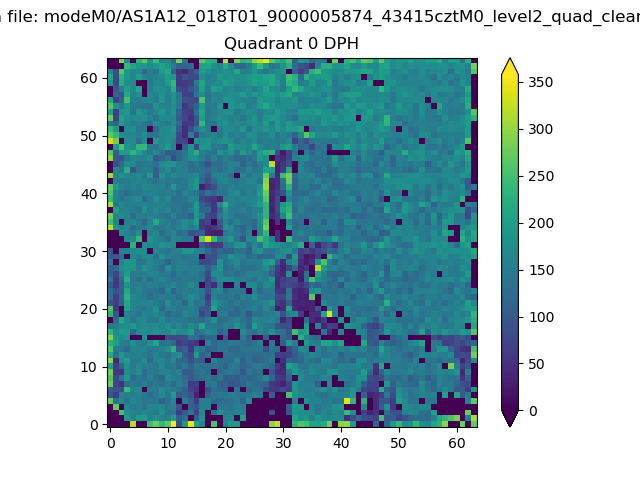 |
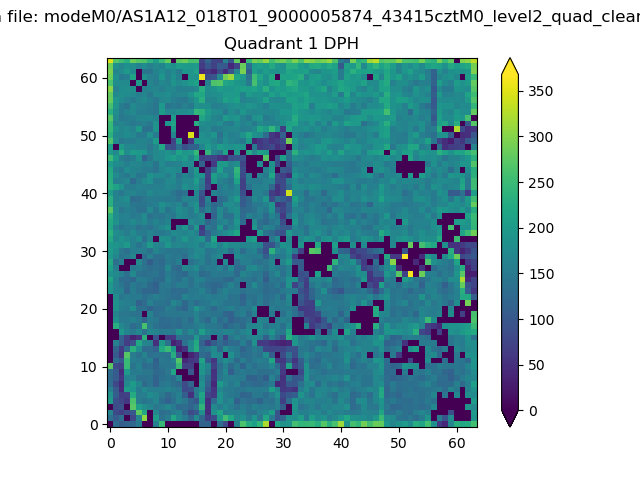 |
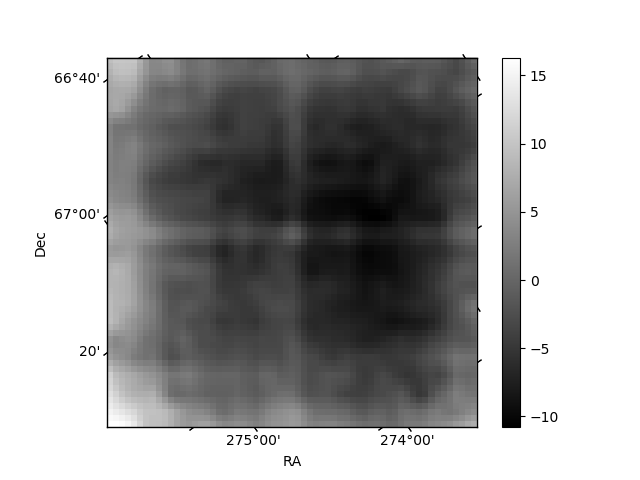
Quadrant B |
|---|---|---|---|
| Quadrant D | 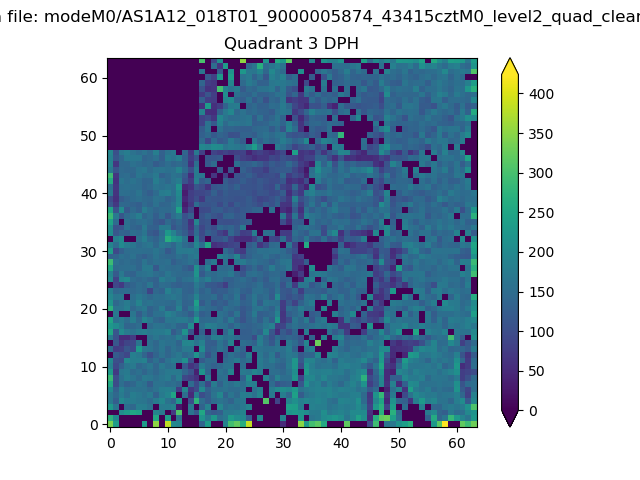 |
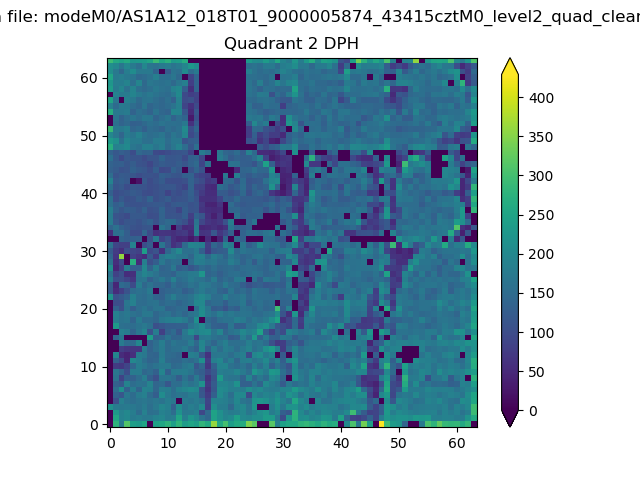 |
Quadrant C |
| Plot type | Count rate plots | Images |
|---|---|---|
| Comparison with Poisson distribution Blue bars denote a histogram of data divided into 1 sec bins. Red curve is a Poisson curve with rate = median count rate of data. |
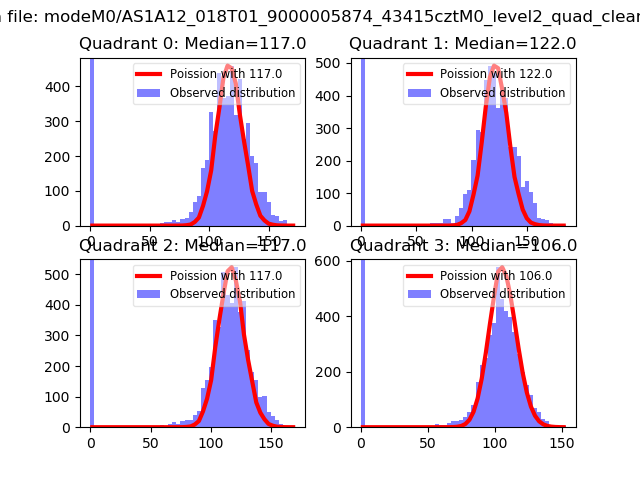 |
 |
| Quadrant-wise count rates Data is divided into 100 sec bins |
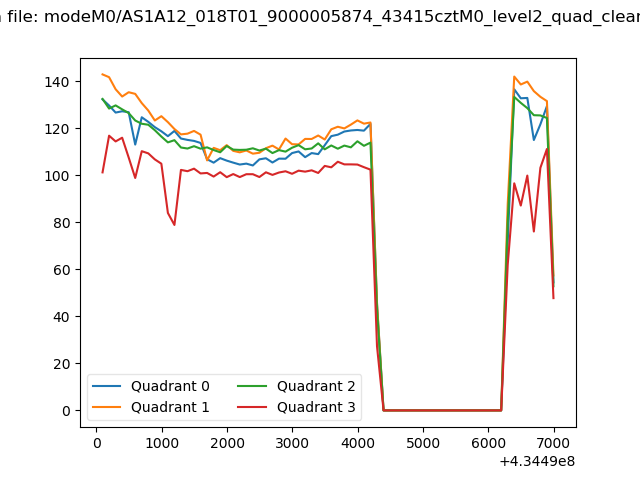 |
|
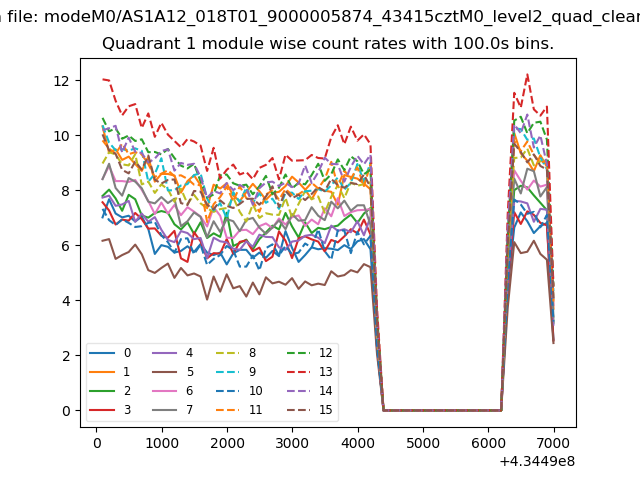
| Module-wise count rates for Quadrant A Data is divided into 100 sec bins |
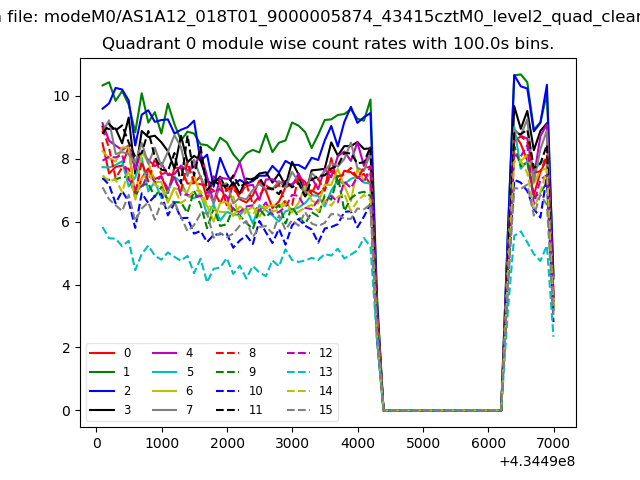 |
 |
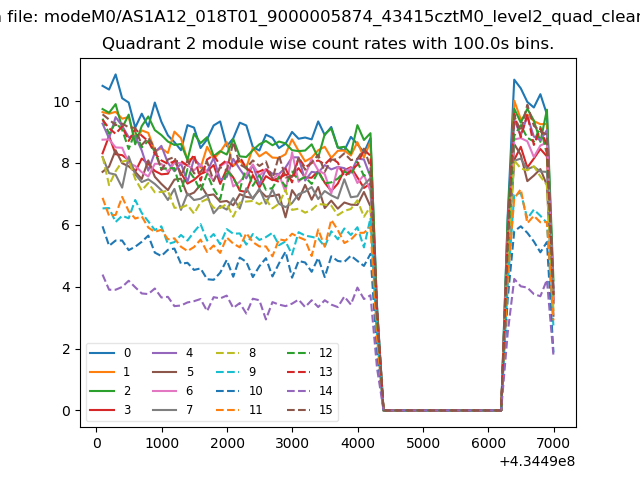
| Module-wise count rates for Quadrant B Data is divided into 100 sec bins |
 |
 |
| Module-wise count rates for Quadrant C Data is divided into 100 sec bins |
 |
 |
| Module-wise count rates for Quadrant D Data is divided into 100 sec bins |
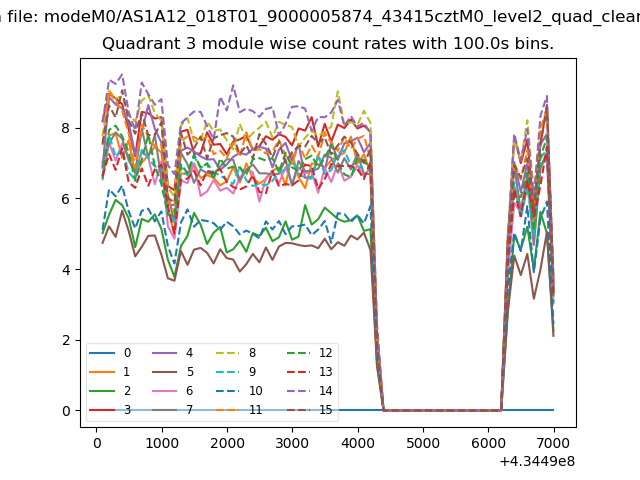 |
 |
| Parameter | Plot |
|---|---|
| CZT HV Monitor | 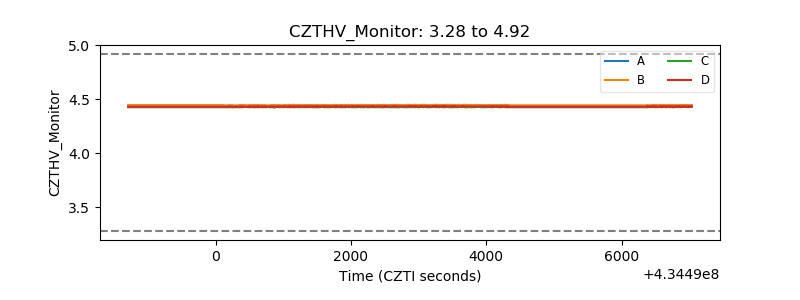 |
| D_VDD | 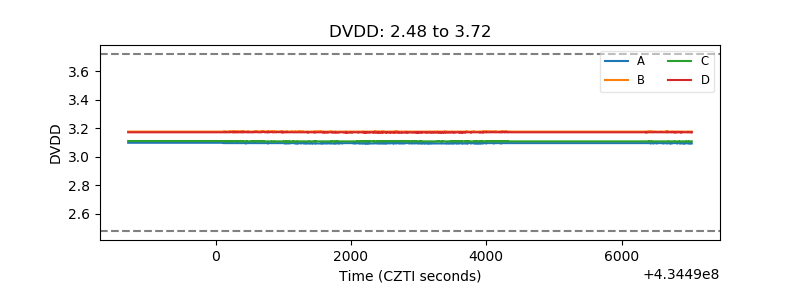 |
| Temperature 1 | 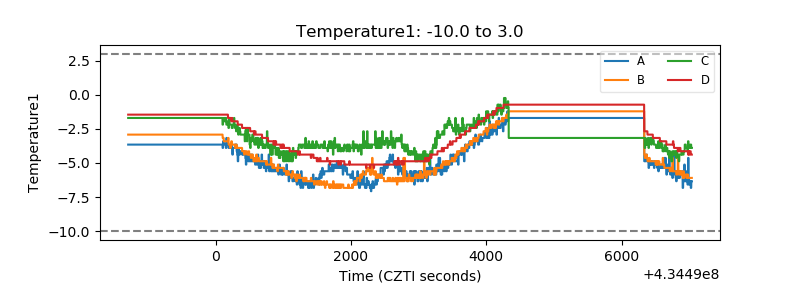 |
| Veto HV Monitor | 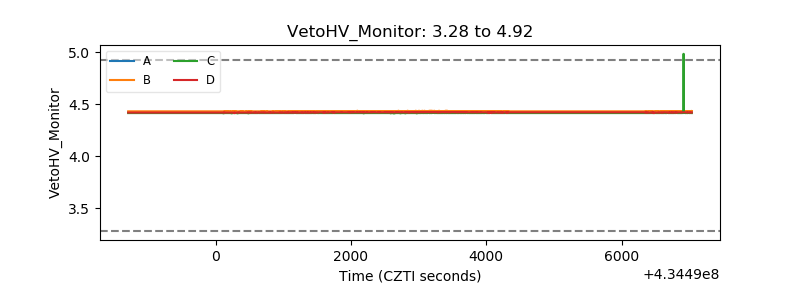 |
| Veto LLD | 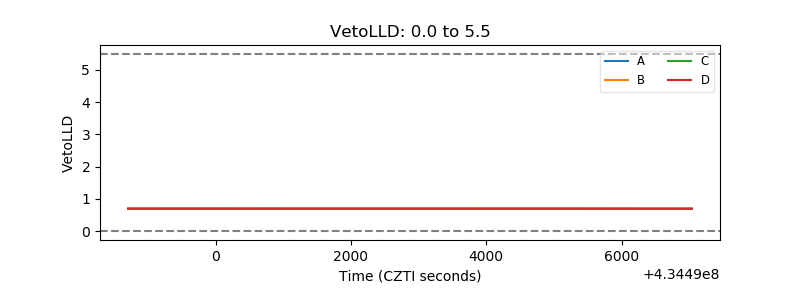 |
| Alpha Counter | 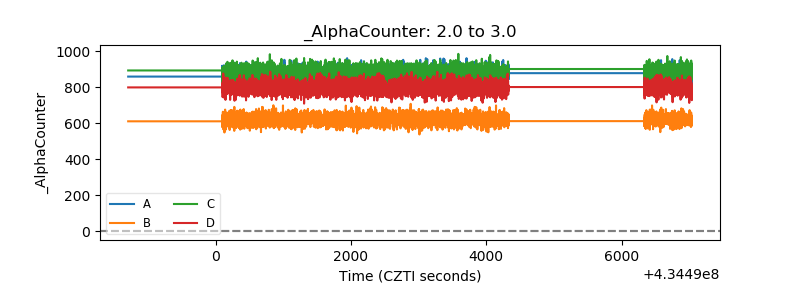 |
| _CPM_Rate | 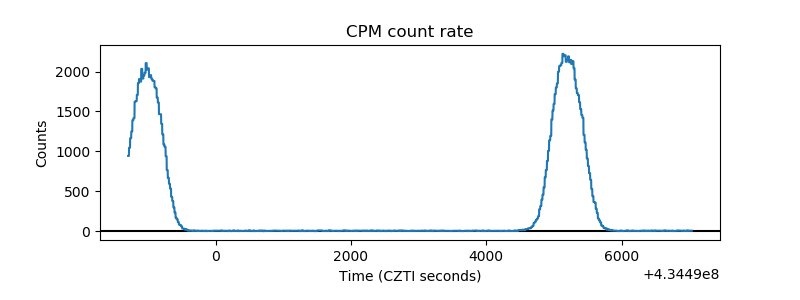 |
| CZT Counter | 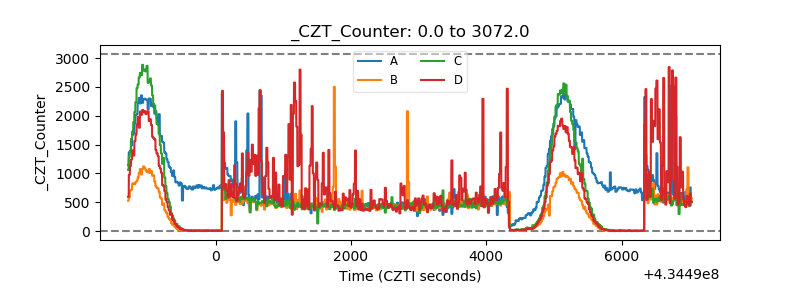 |
| +2.5 Volts monitor | 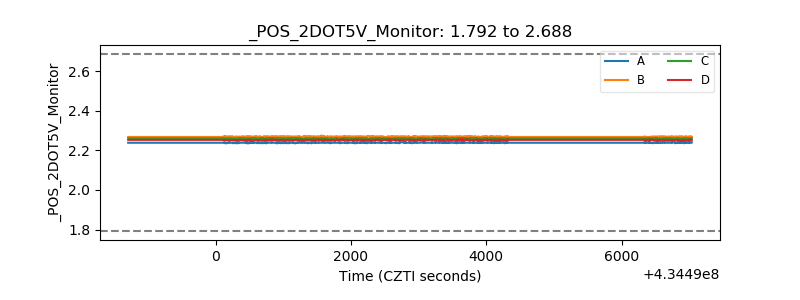 |
| +5 Volts monitor | 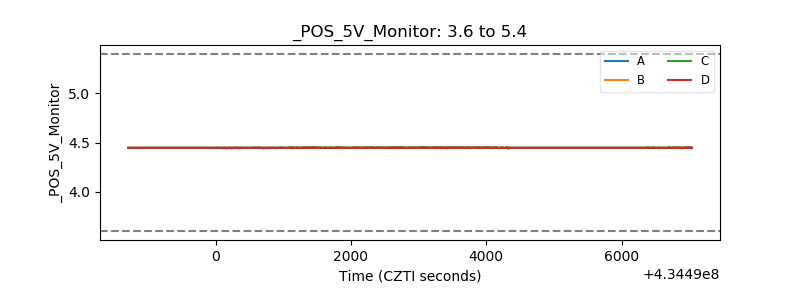 |
| _ROLL_ROT | 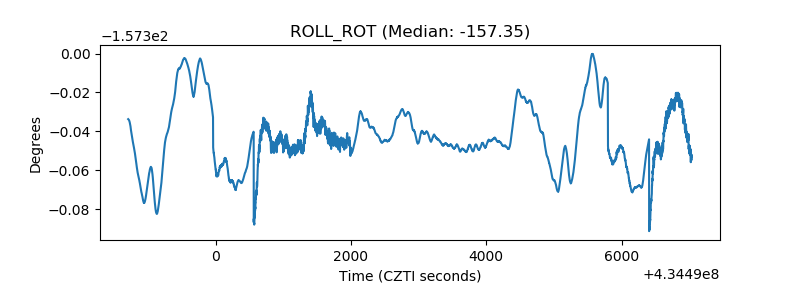 |
| _Roll_DEC | 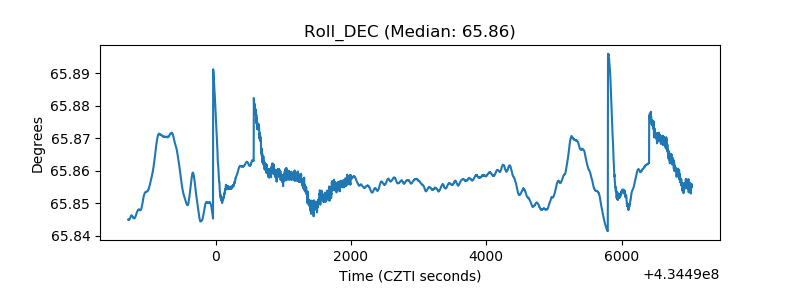 |
| _Roll_RA | 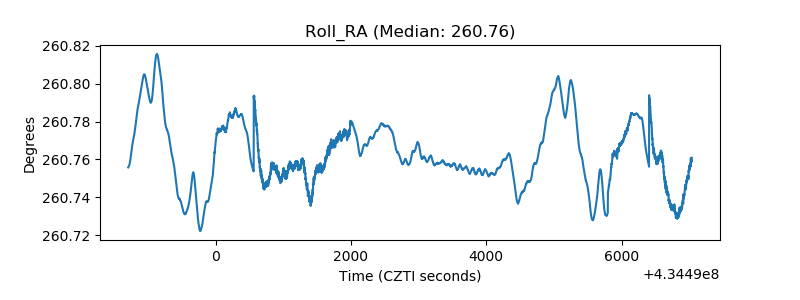 |
| Veto Counter | 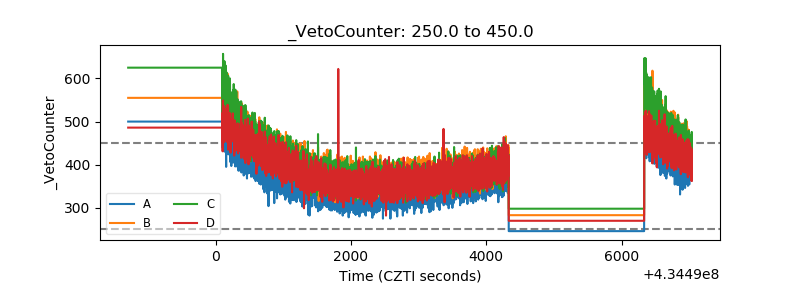 |