| Param | Original file | Final file |
|---|---|---|
| Filename | modeM0/AS1A12_018T01_9000005874_43416cztM0_level2.fits | modeM0/AS1A12_018T01_9000005874_43416cztM0_level2_quad_clean.evt |
| Size (bytes) | 311,117,760 | 86,529,600 |
| Size | 296.7 MB | 82.5 MB |
| Events in quadrant A | 2,836,399 | 578,317 |
| Events in quadrant B | 2,518,324 | 607,702 |
| Events in quadrant C | 2,367,367 | 579,368 |
| Events in quadrant D | 3,408,601 | 507,509 |
| Mode M0 | |||
|---|---|---|---|
| Quadrant | BADHDUFLAG | Total packets | Discarded packets |
| A | 0 | 11451 | 2 |
| B | 0 | 10696 | 2 |
| C | 0 | 10138 | 2 |
| D | 0 | 13658 | 2 |
| Mode M9 | |||
|---|---|---|---|
| Quadrant | BADHDUFLAG | Total packets | Discarded packets |
| A | 0 | 35 | 0 |
| B | 0 | 36 | 0 |
| C | 0 | 36 | 0 |
| D | 0 | 36 | 0 |
| Mode SS | |||
|---|---|---|---|
| Quadrant | BADHDUFLAG | Total packets | Discarded packets |
| A | 0 | 102 | 0 |
| B | 0 | 102 | 0 |
| C | 0 | 102 | 0 |
| D | 0 | 102 | 0 |
| Quadrant | Total seconds | Saturated seconds | Saturation percentage |
|---|---|---|---|
| A | 4949 | 55 | 1.111336% |
| B | 4949 | 38 | 0.767832% |
| C | 4949 | 5 | 0.101031% |
| D | 4949 | 214 | 4.324106% |
Noise dominated data is calculated using 1-second bins in cleaned event files. If a bin has >2000 counts, and if more than 50% of those come from <1% of pixels, then it is considered to be noise-dominated and hence unusable.
| Quadrant | # 1 sec bins | Bins with >0 counts | Bins with >2000 counts | High rate bins dominated by noise | Noise dominated (total time) | Noise dominated (detector-on time) | Marked lightcurve |
|---|---|---|---|---|---|---|---|
| A | 7041 | 4950 | 39 | 39 | 0.55% | 0.79% | 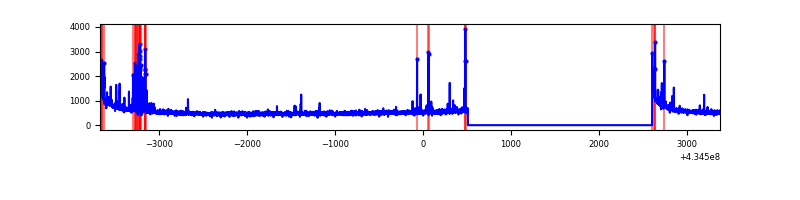 |
| B | 7041 | 4950 | 16 | 16 | 0.23% | 0.32% | 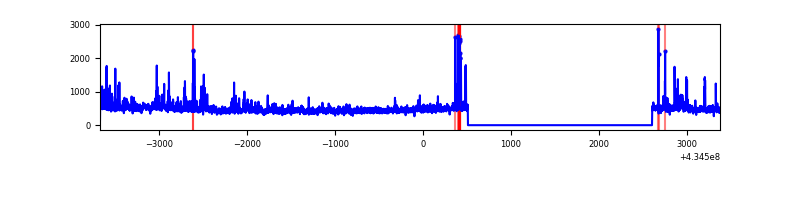 |
| C | 7041 | 4950 | 1 | 1 | 0.01% | 0.02% | 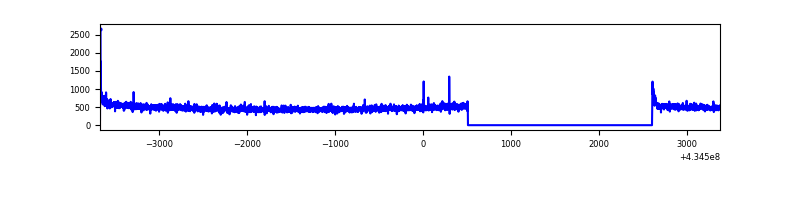 |
| D | 7041 | 4950 | 224 | 224 | 3.18% | 4.53% | 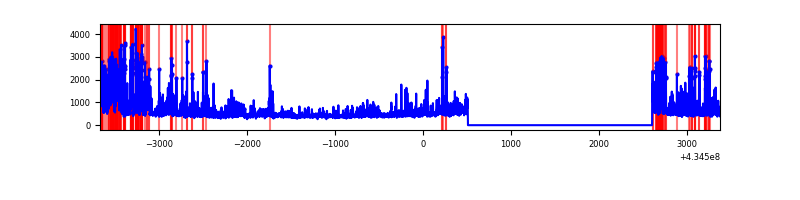 |
Top three noisy pixels from each quadrant. If the there are fewer than three noisy pixels in the level2.evt file, extra rows are filled as -1
| Pixel properties | Quadrant properties | ||||||
|---|---|---|---|---|---|---|---|
| Quadrant | DetID | PixID | Counts | Sigma | Mean | Median | Sigma |
| A | 10 | 83 | 554605 | 5014.35 | 540 | 529 | 110.5 |
| A | 15 | 237 | 164364 | 1482.7 | 540 | 529 | 110.5 |
| A | 13 | 6 | 17287 | 151.66 | 540 | 529 | 110.5 |
| B | 0 | 189 | 186143 | 1796.05 | 547 | 532 | 103.3 |
| B | 0 | 190 | 55425 | 531.17 | 547 | 532 | 103.3 |
| B | 5 | 255 | 43436 | 415.16 | 547 | 532 | 103.3 |
| C | 15 | 214 | 205301 | 1653.09 | 536 | 538 | 123.9 |
| C | 3 | 233 | 65887 | 527.58 | 536 | 538 | 123.9 |
| C | 15 | 159 | 5290 | 38.36 | 536 | 538 | 123.9 |
| D | 1 | 52 | 778798 | 6218.55 | 518 | 504 | 125.2 |
| D | 1 | 47 | 191868 | 1528.99 | 518 | 504 | 125.2 |
| D | 2 | 16 | 190059 | 1514.54 | 518 | 504 | 125.2 |
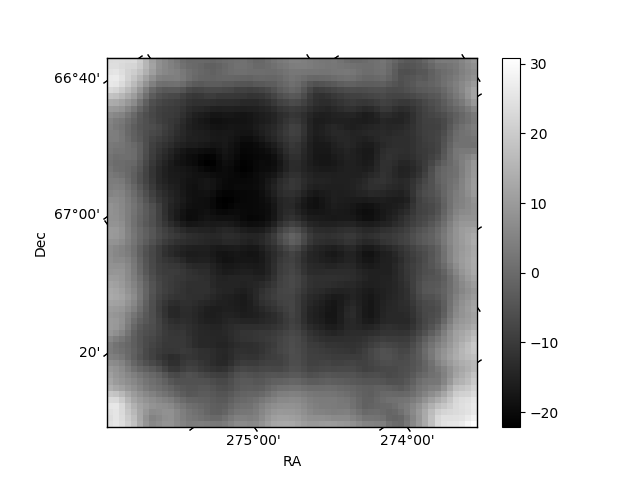
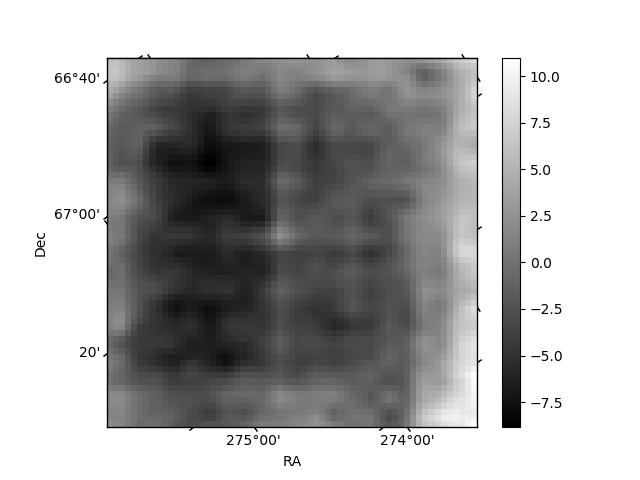
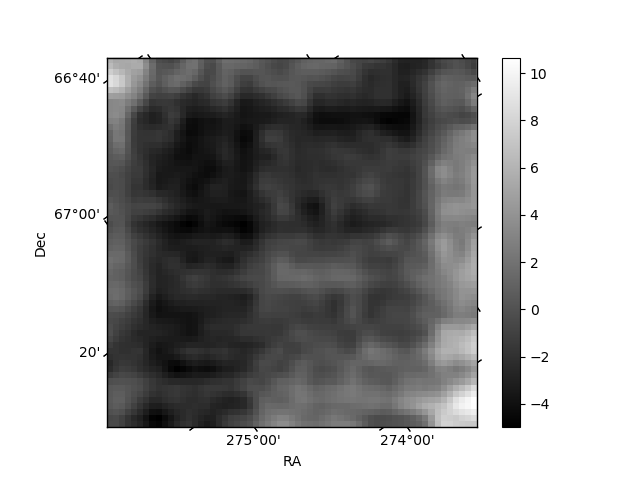
Histogram calculated using DETX and DETY for each event in the final _common_clean file
| Quadrant A | 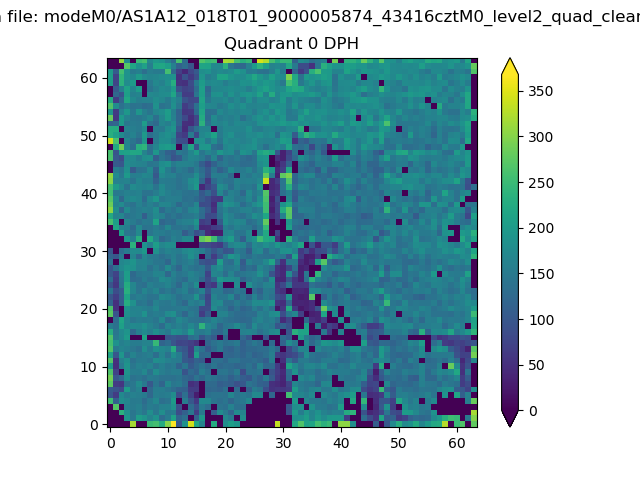 |
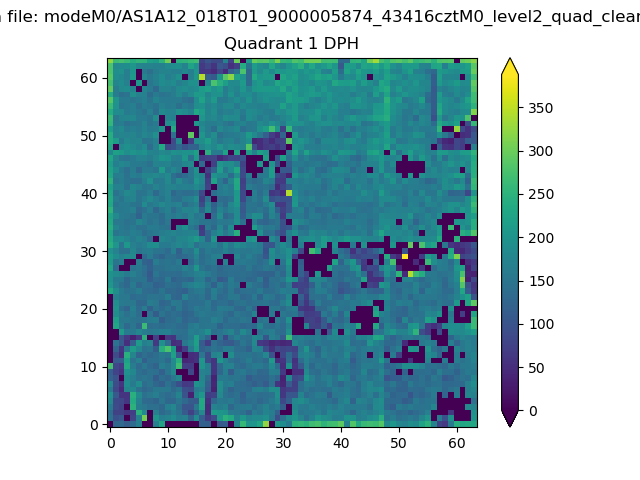 |
Quadrant B |
|---|---|---|---|
| Quadrant D | 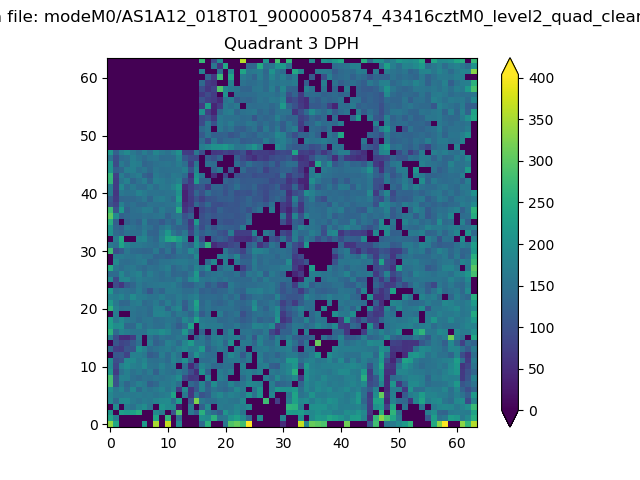 |
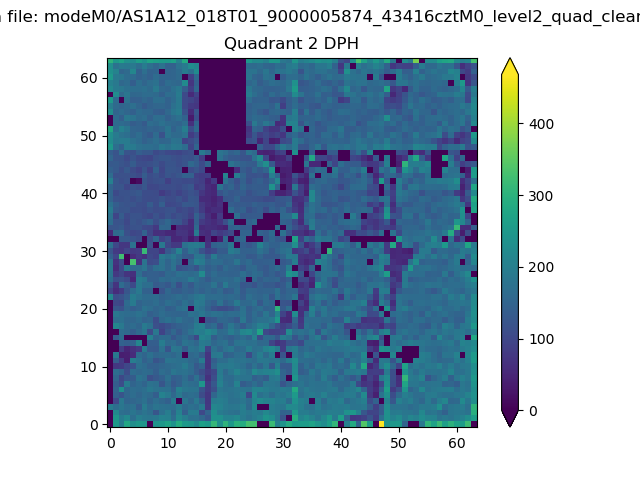 |
Quadrant C |
| Plot type | Count rate plots | Images |
|---|---|---|
| Comparison with Poisson distribution Blue bars denote a histogram of data divided into 1 sec bins. Red curve is a Poisson curve with rate = median count rate of data. |
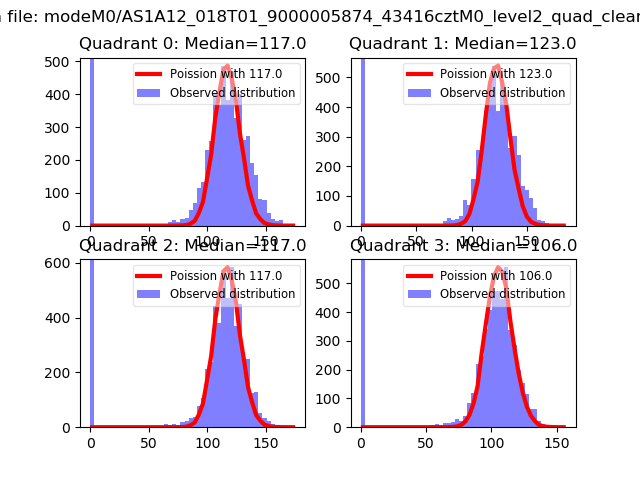 |
 |
| Quadrant-wise count rates Data is divided into 100 sec bins |
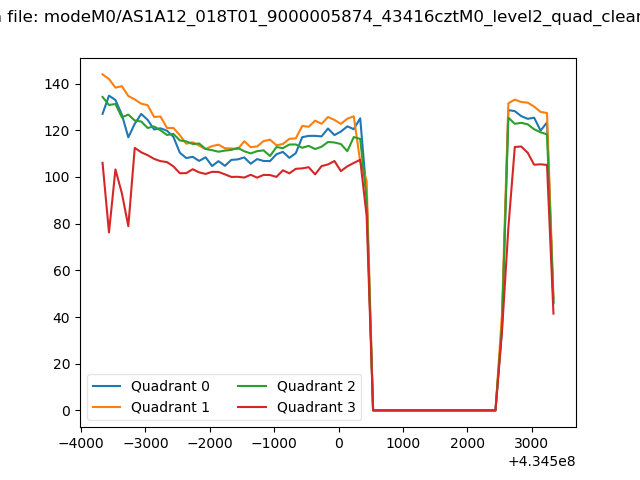 |
|
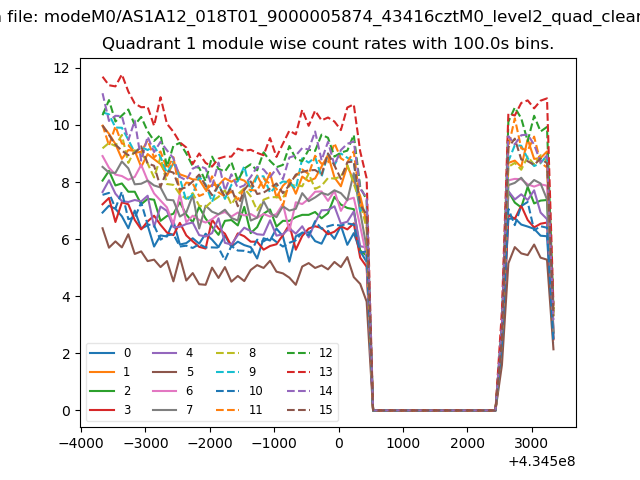
| Module-wise count rates for Quadrant A Data is divided into 100 sec bins |
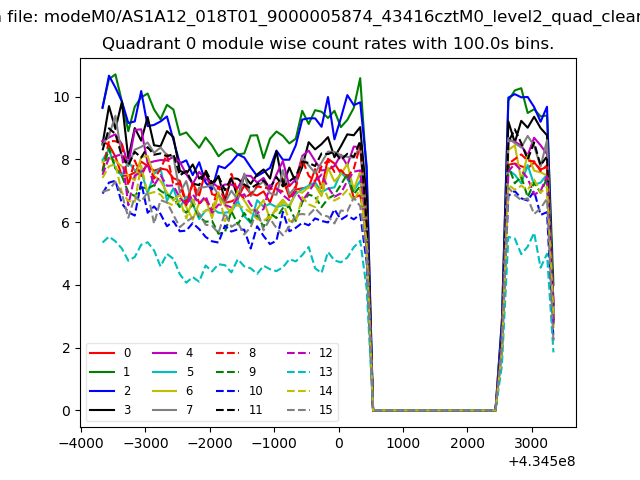 |
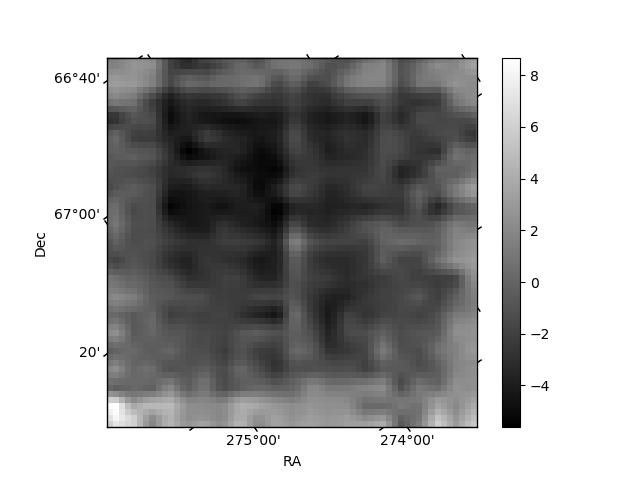 |
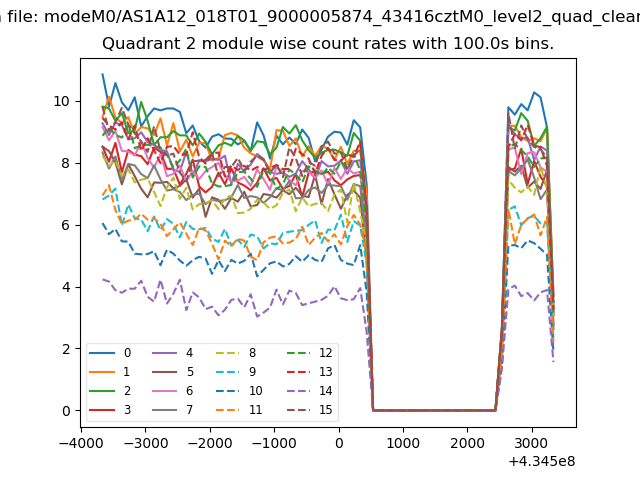
| Module-wise count rates for Quadrant B Data is divided into 100 sec bins |
 |
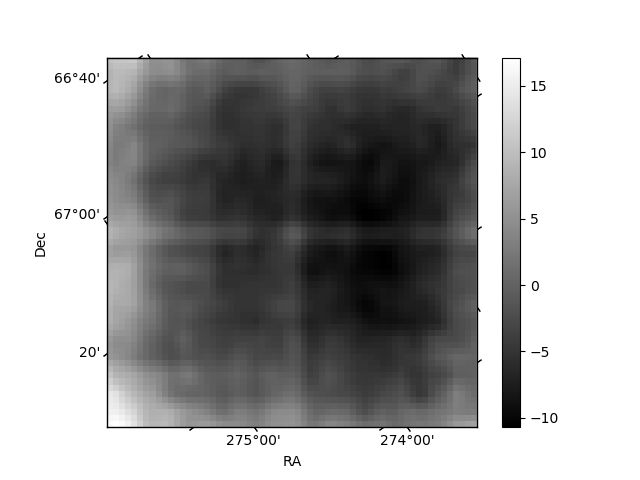 |
| Module-wise count rates for Quadrant C Data is divided into 100 sec bins |
 |
 |
| Module-wise count rates for Quadrant D Data is divided into 100 sec bins |
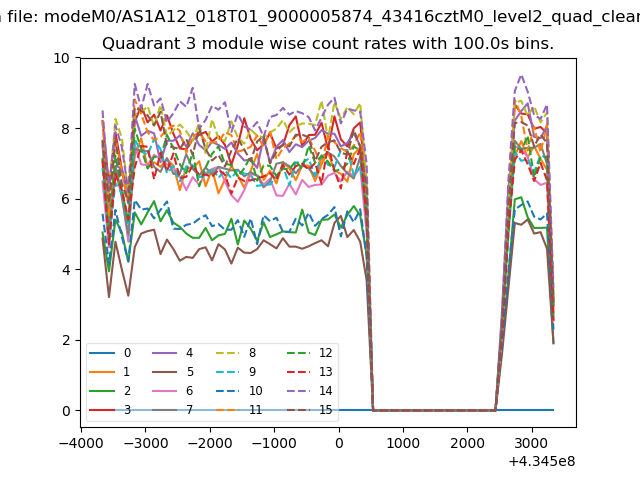 |
 |
| Parameter | Plot |
|---|---|
| CZT HV Monitor | 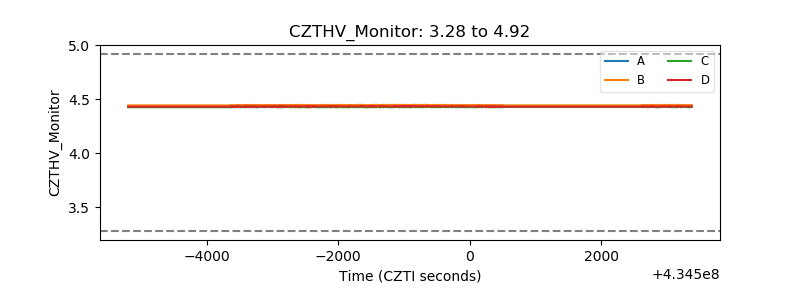 |
| D_VDD | 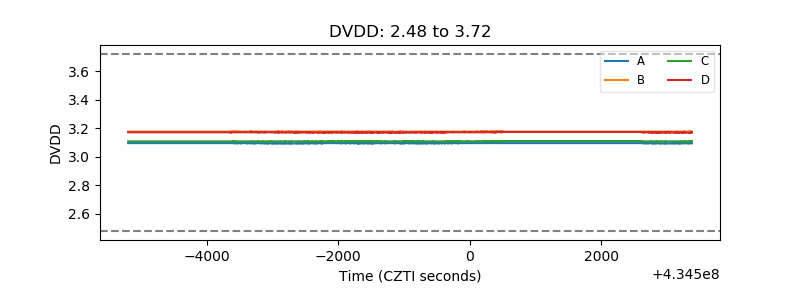 |
| Temperature 1 | 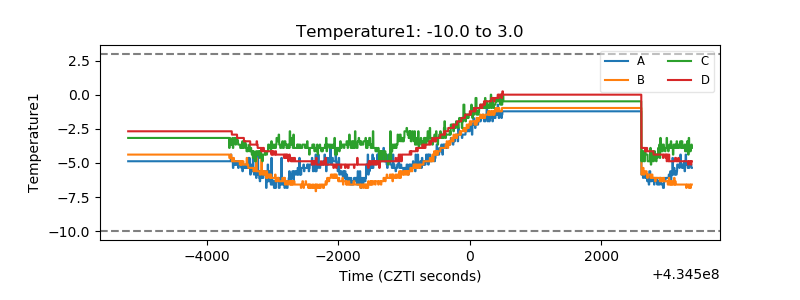 |
| Veto HV Monitor | 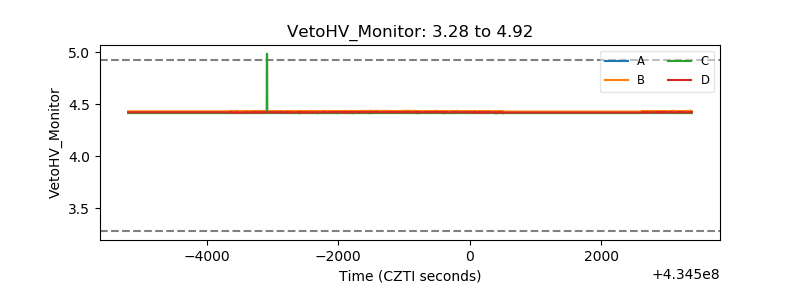 |
| Veto LLD | 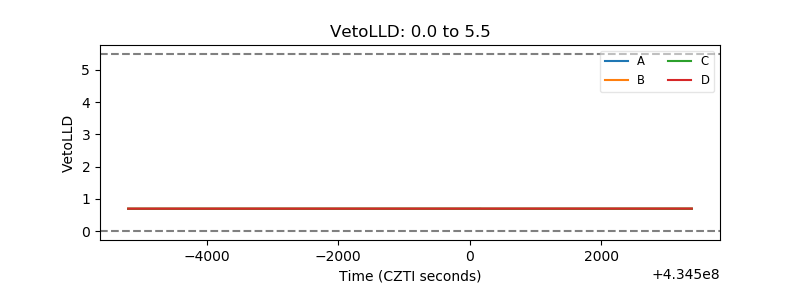 |
| Alpha Counter | 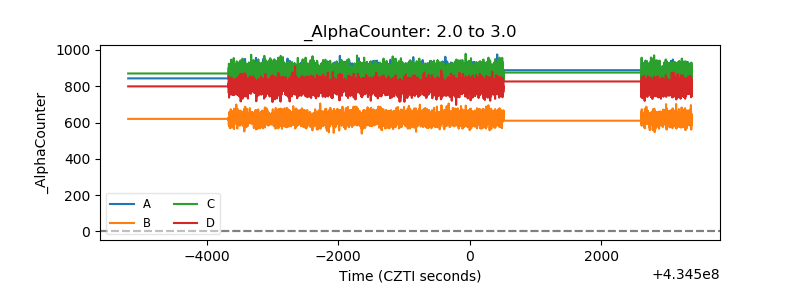 |
| _CPM_Rate | 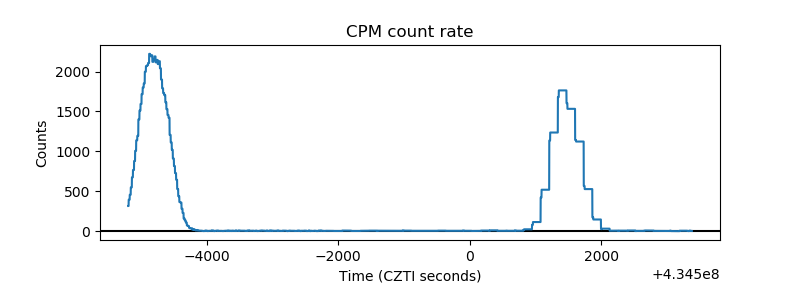 |
| CZT Counter | 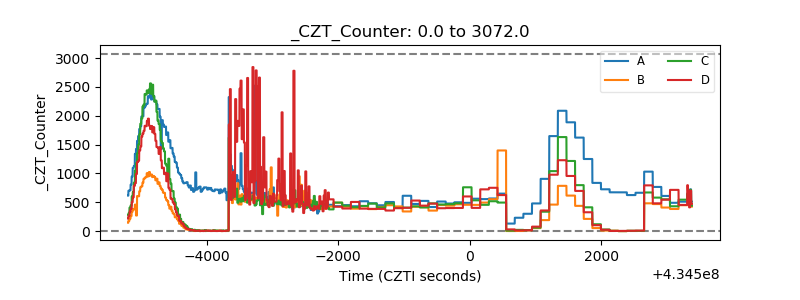 |
| +2.5 Volts monitor | 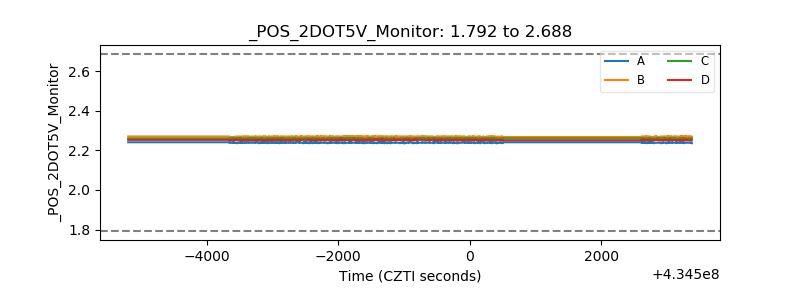 |
| +5 Volts monitor | 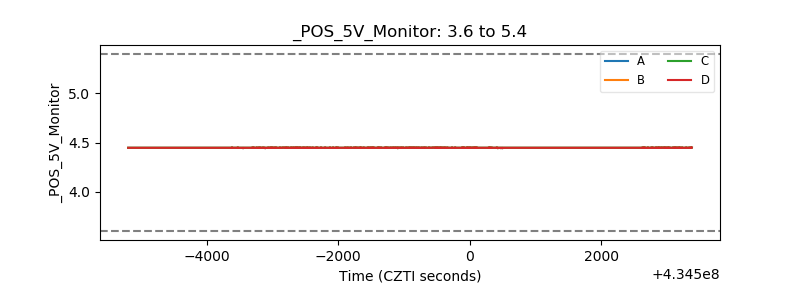 |
| _ROLL_ROT | 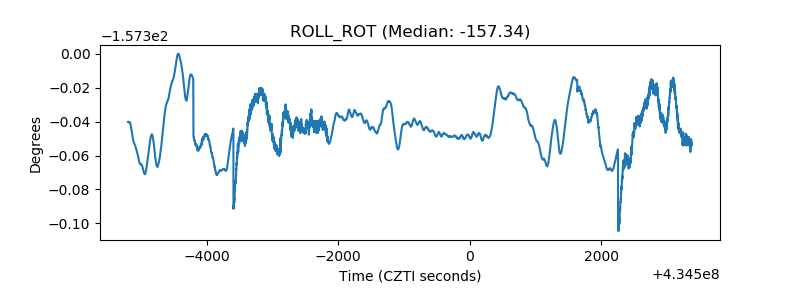 |
| _Roll_DEC | 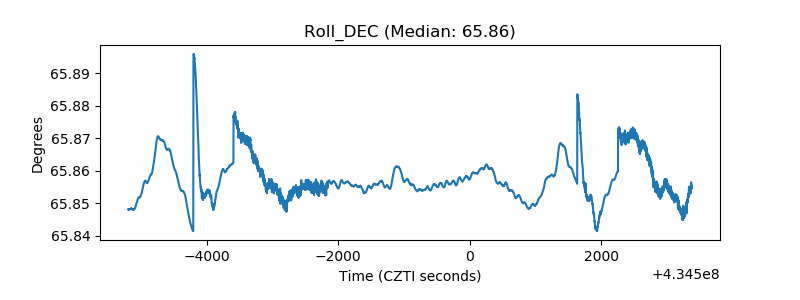 |
| _Roll_RA | 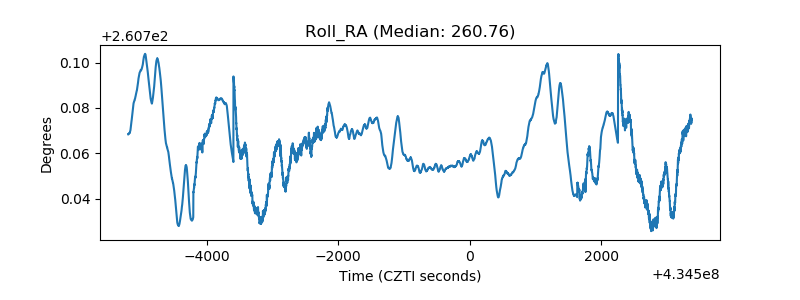 |
| Veto Counter | 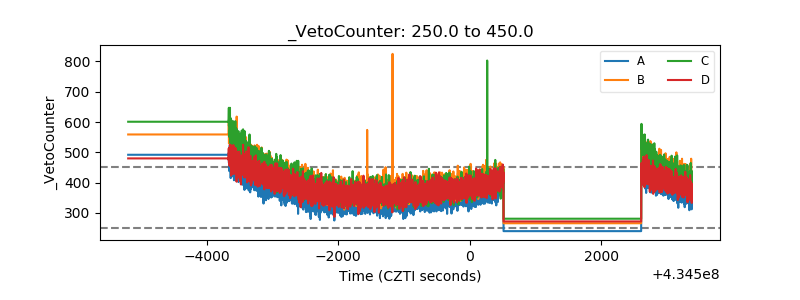 |