| Param | Original file | Final file |
|---|---|---|
| Filename | modeM0/AS1A12_018T01_9000005874_43417cztM0_level2.fits | modeM0/AS1A12_018T01_9000005874_43417cztM0_level2_quad_clean.evt |
| Size (bytes) | 336,836,160 | 86,618,880 |
| Size | 321.2 MB | 82.6 MB |
| Events in quadrant A | 2,903,466 | 590,938 |
| Events in quadrant B | 2,482,796 | 612,776 |
| Events in quadrant C | 2,403,874 | 585,508 |
| Events in quadrant D | 4,275,670 | 471,566 |
| Mode M0 | |||
|---|---|---|---|
| Quadrant | BADHDUFLAG | Total packets | Discarded packets |
| A | 0 | 11764 | 2 |
| B | 0 | 10975 | 3 |
| C | 0 | 10453 | 2 |
| D | 0 | 16384 | 2 |
| Mode M9 | |||
|---|---|---|---|
| Quadrant | BADHDUFLAG | Total packets | Discarded packets |
| A | 0 | 36 | 0 |
| B | 0 | 37 | 0 |
| C | 0 | 37 | 0 |
| D | 0 | 37 | 0 |
| Mode SS | |||
|---|---|---|---|
| Quadrant | BADHDUFLAG | Total packets | Discarded packets |
| A | 0 | 106 | 0 |
| B | 0 | 106 | 0 |
| C | 0 | 106 | 0 |
| D | 0 | 106 | 0 |
| Quadrant | Total seconds | Saturated seconds | Saturation percentage |
|---|---|---|---|
| A | 5167 | 41 | 0.793497% |
| B | 5166 | 25 | 0.483933% |
| C | 5166 | 4 | 0.077429% |
| D | 5166 | 655 | 12.679055% |
Noise dominated data is calculated using 1-second bins in cleaned event files. If a bin has >2000 counts, and if more than 50% of those come from <1% of pixels, then it is considered to be noise-dominated and hence unusable.
| Quadrant | # 1 sec bins | Bins with >0 counts | Bins with >2000 counts | High rate bins dominated by noise | Noise dominated (total time) | Noise dominated (detector-on time) | Marked lightcurve |
|---|---|---|---|---|---|---|---|
| A | 7290 | 5168 | 26 | 26 | 0.36% | 0.50% | 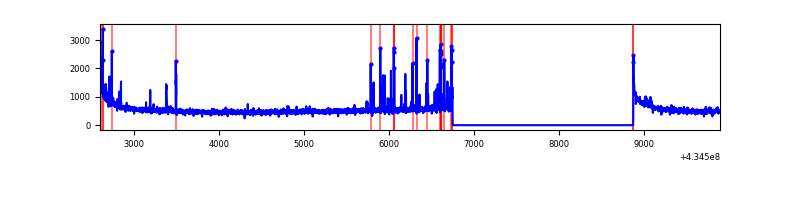 |
| B | 7289 | 5167 | 13 | 13 | 0.18% | 0.25% | 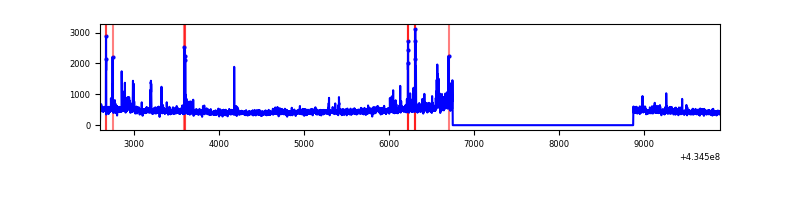 |
| C | 7289 | 5167 | 0 | 0 | 0.00% | 0.00% | 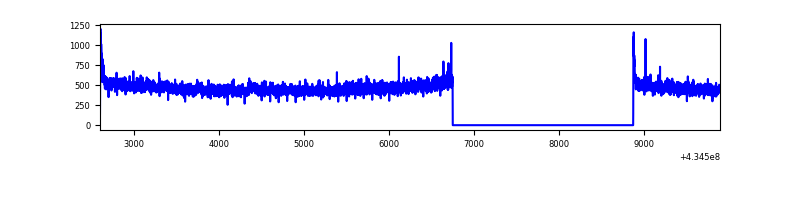 |
| D | 7289 | 5167 | 630 | 630 | 8.64% | 12.19% | 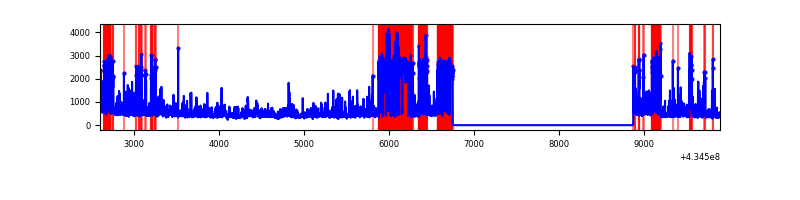 |
Top three noisy pixels from each quadrant. If the there are fewer than three noisy pixels in the level2.evt file, extra rows are filled as -1
| Pixel properties | Quadrant properties | ||||||
|---|---|---|---|---|---|---|---|
| Quadrant | DetID | PixID | Counts | Sigma | Mean | Median | Sigma |
| A | 10 | 83 | 576167 | 5074.27 | 554 | 542 | 113.4 |
| A | 15 | 237 | 162842 | 1430.71 | 554 | 542 | 113.4 |
| A | 13 | 6 | 15576 | 132.53 | 554 | 542 | 113.4 |
| B | 0 | 190 | 81009 | 757.02 | 559 | 544 | 106.3 |
| B | 0 | 189 | 61884 | 577.09 | 559 | 544 | 106.3 |
| B | 5 | 255 | 60218 | 561.42 | 559 | 544 | 106.3 |
| C | 15 | 214 | 214069 | 1685.3 | 546 | 550 | 126.7 |
| C | 3 | 233 | 54428 | 425.26 | 546 | 550 | 126.7 |
| C | 15 | 159 | 3964 | 26.95 | 546 | 550 | 126.7 |
| D | 1 | 52 | 1783462 | 15048.34 | 489 | 474 | 118.5 |
| D | 2 | 16 | 160283 | 1348.78 | 489 | 474 | 118.5 |
| D | 1 | 47 | 129192 | 1086.37 | 489 | 474 | 118.5 |
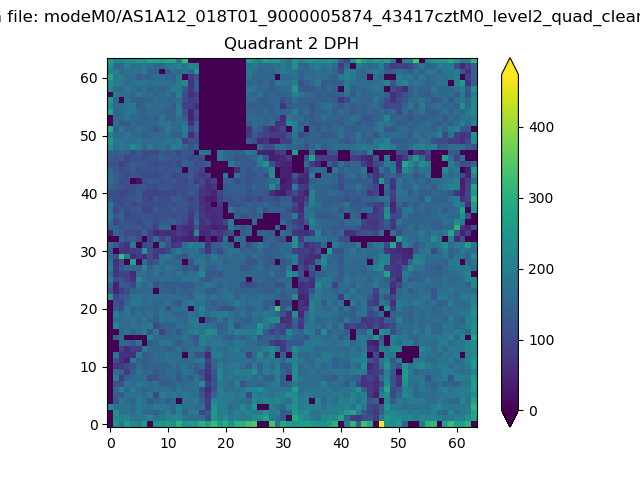
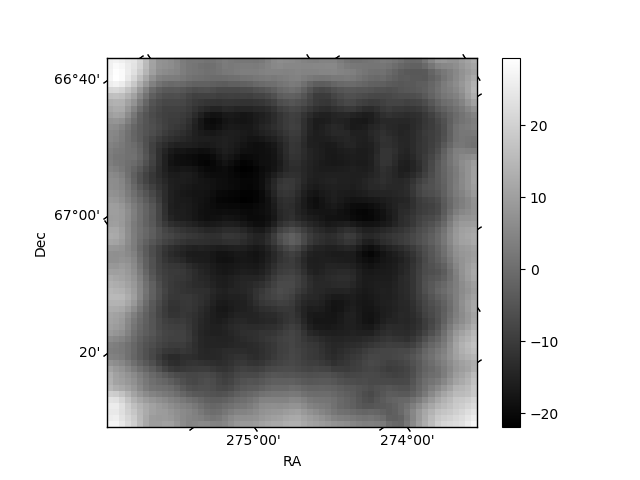
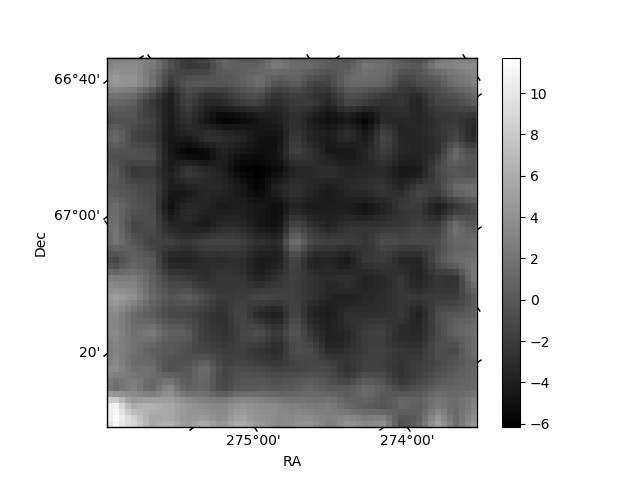
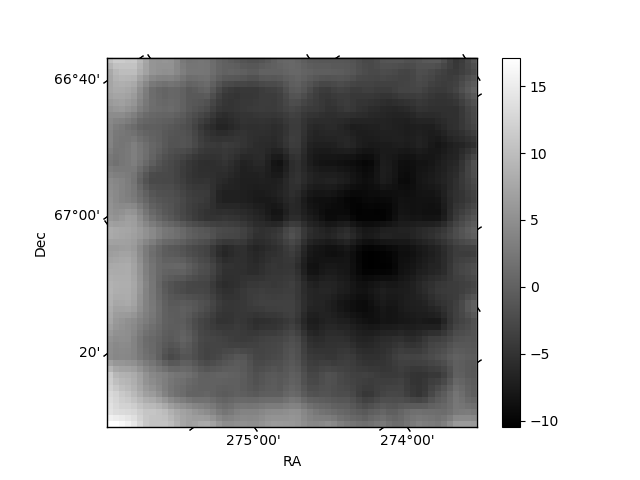
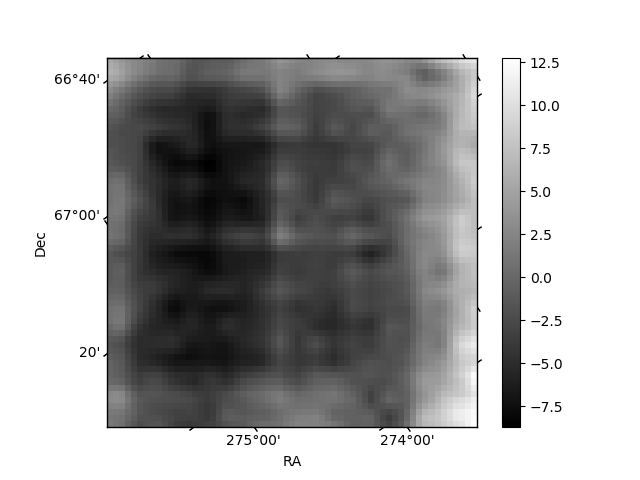
Histogram calculated using DETX and DETY for each event in the final _common_clean file
| Quadrant A | 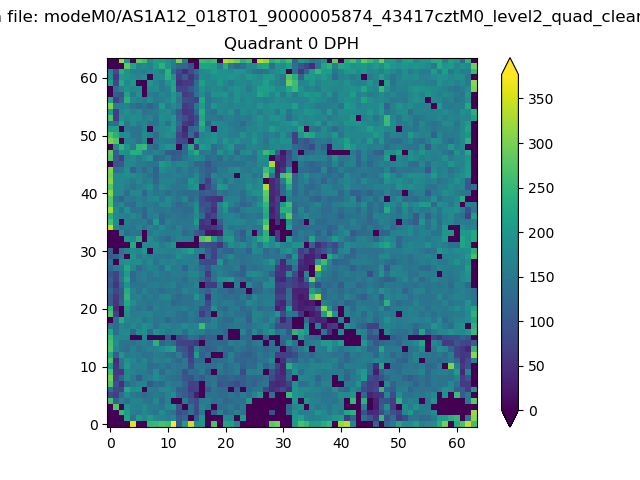 |
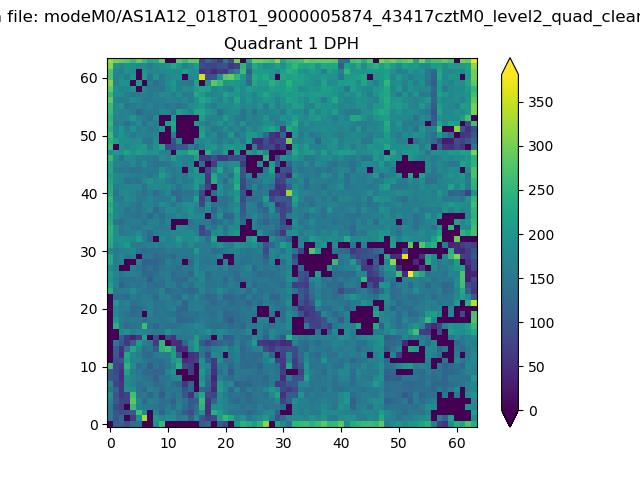 |
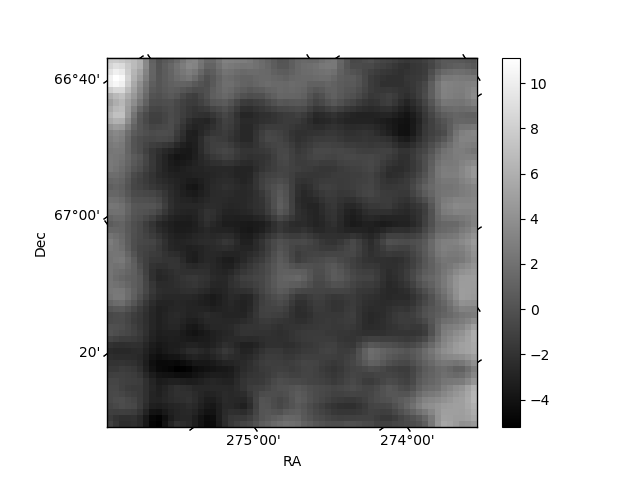
Quadrant B |
|---|---|---|---|
| Quadrant D | 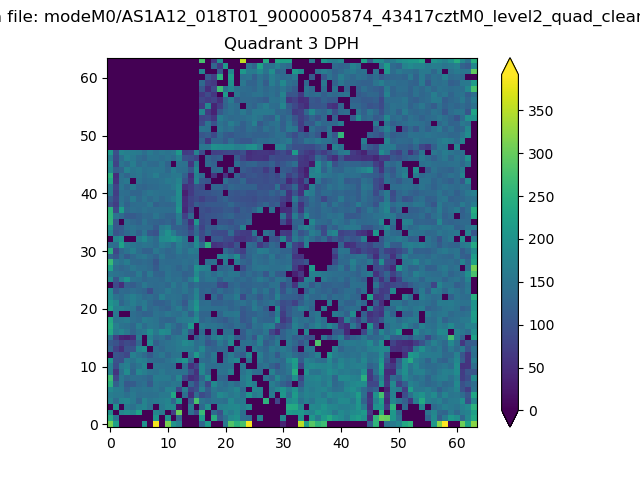 |
 |
Quadrant C |
| Plot type | Count rate plots | Images |
|---|---|---|
| Comparison with Poisson distribution Blue bars denote a histogram of data divided into 1 sec bins. Red curve is a Poisson curve with rate = median count rate of data. |
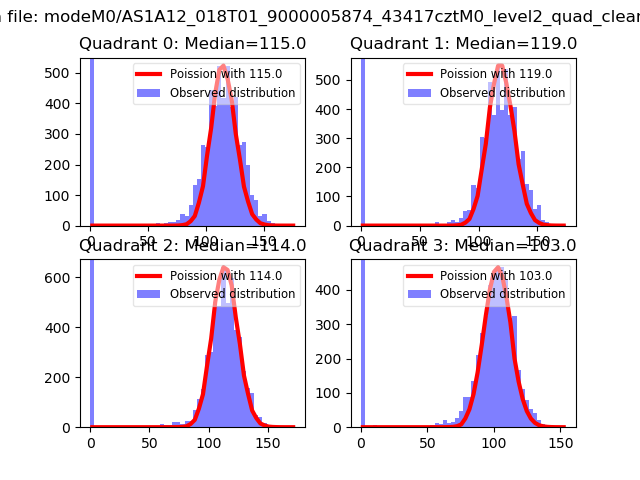 |
 |
| Quadrant-wise count rates Data is divided into 100 sec bins |
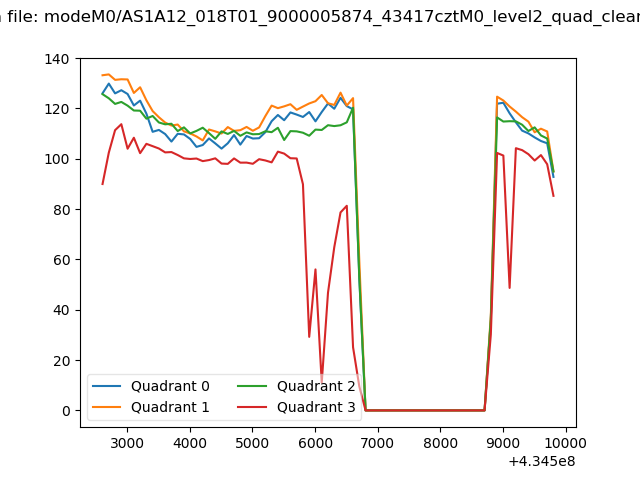 |
|
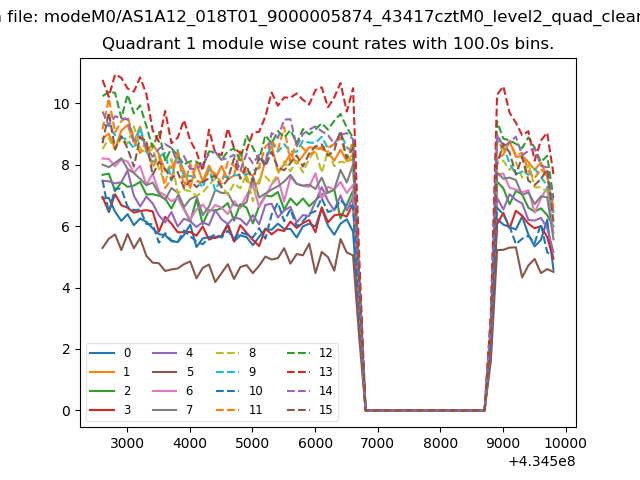
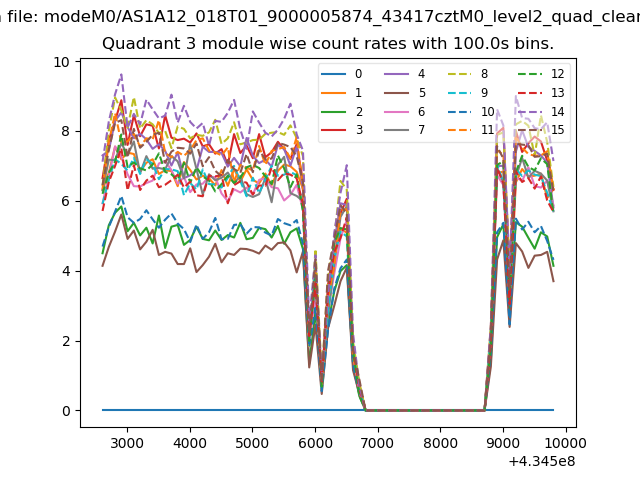
| Module-wise count rates for Quadrant A Data is divided into 100 sec bins |
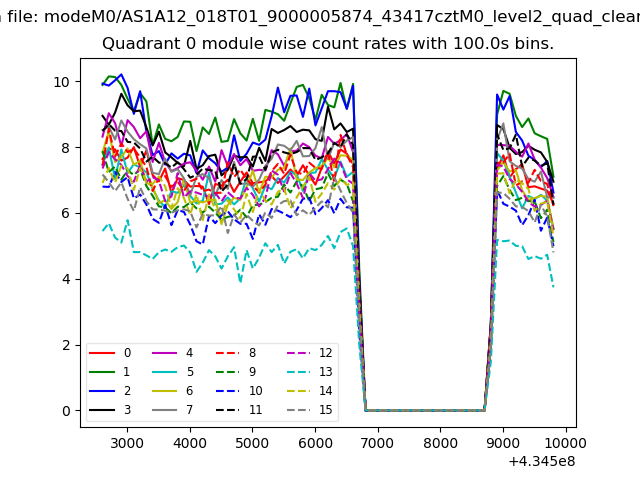 |
 |
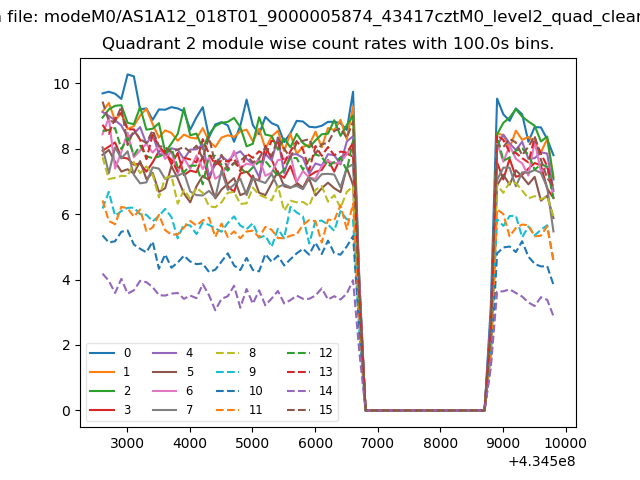
| Module-wise count rates for Quadrant B Data is divided into 100 sec bins |
 |
 |
| Module-wise count rates for Quadrant C Data is divided into 100 sec bins |
 |
 |
| Module-wise count rates for Quadrant D Data is divided into 100 sec bins |
 |
 |
| Parameter | Plot |
|---|---|
| CZT HV Monitor | 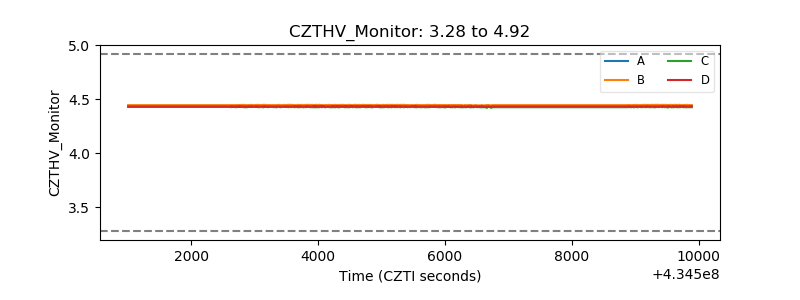 |
| D_VDD | 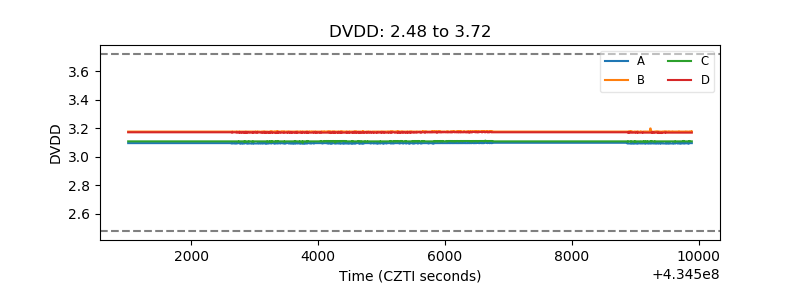 |
| Temperature 1 | 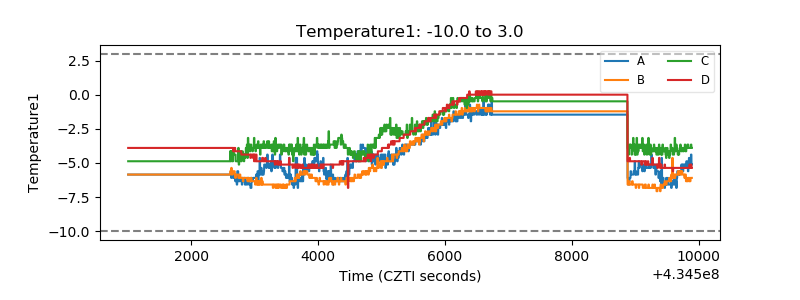 |
| Veto HV Monitor | 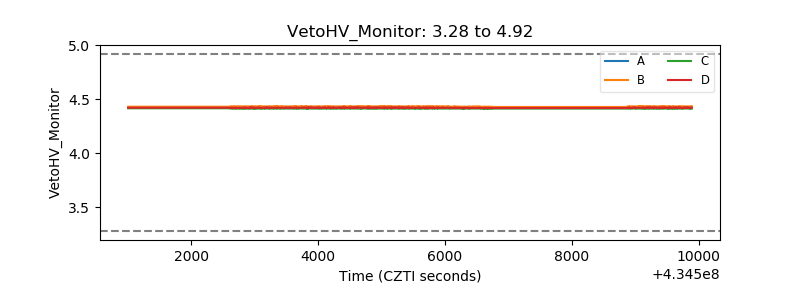 |
| Veto LLD | 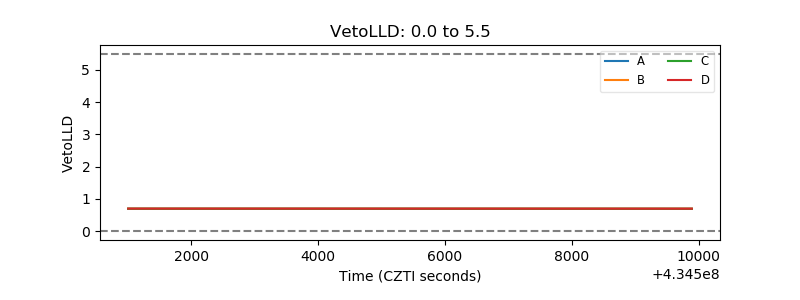 |
| Alpha Counter | 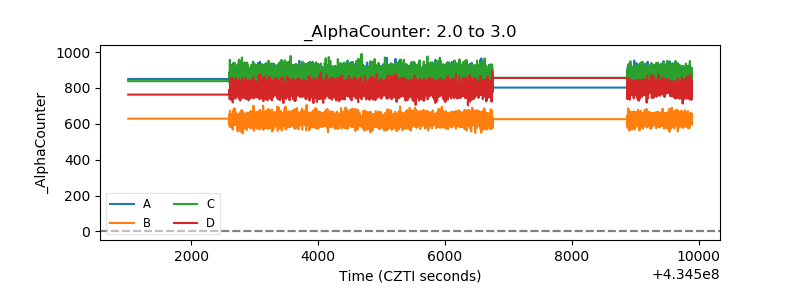 |
| _CPM_Rate | 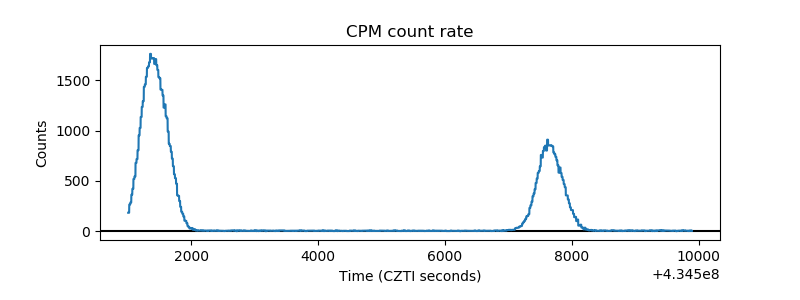 |
| CZT Counter | 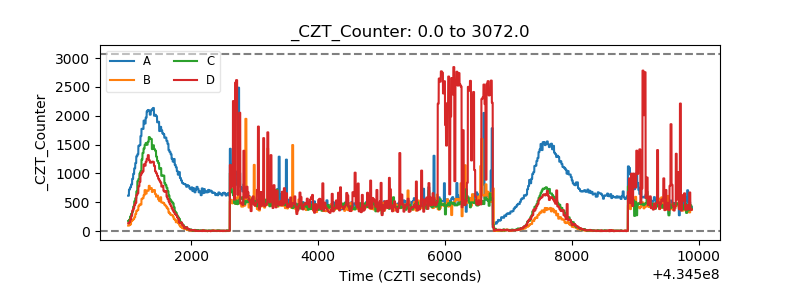 |
| +2.5 Volts monitor | 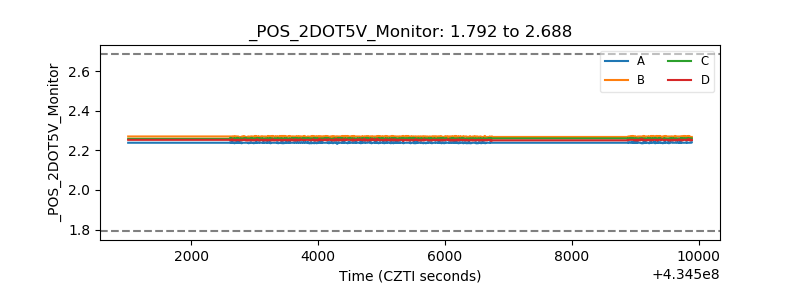 |
| +5 Volts monitor |  |
| _ROLL_ROT | 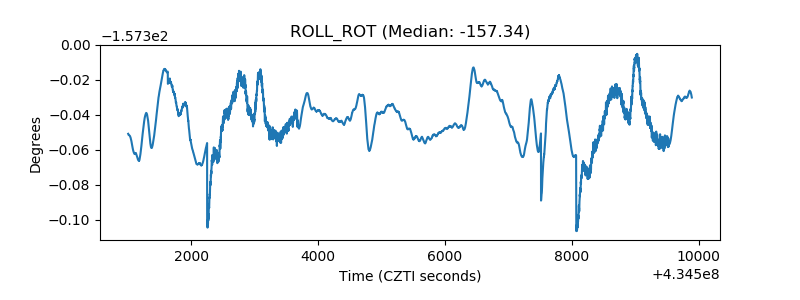 |
| _Roll_DEC | 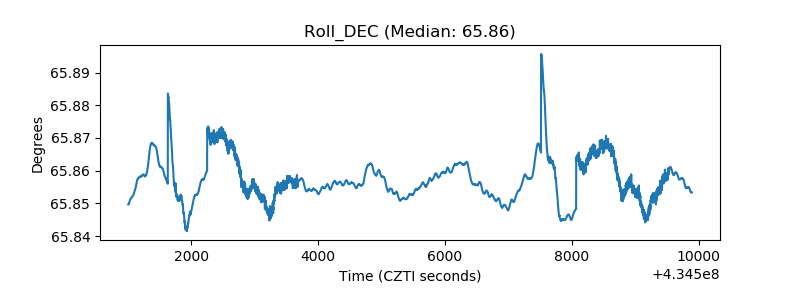 |
| _Roll_RA | 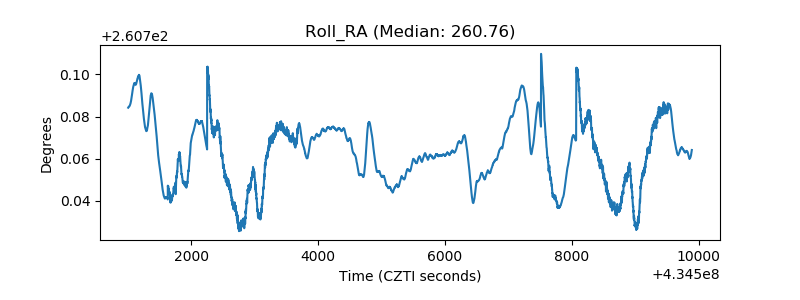 |
| Veto Counter | 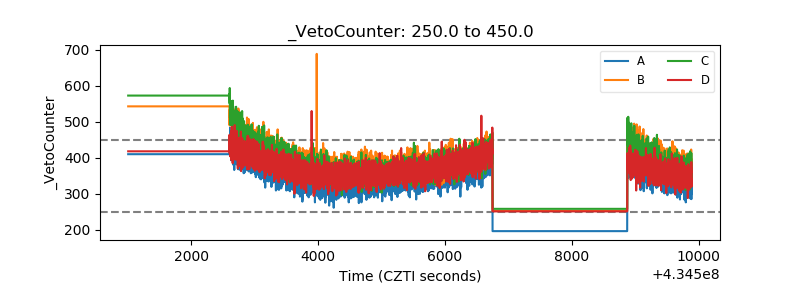 |