| Param | Original file | Final file |
|---|---|---|
| Filename | modeM0/AS1A12_018T01_9000005874_43418cztM0_level2.fits | modeM0/AS1A12_018T01_9000005874_43418cztM0_level2_quad_clean.evt |
| Size (bytes) | 306,587,520 | 85,216,320 |
| Size | 292.4 MB | 81.3 MB |
| Events in quadrant A | 3,000,281 | 562,230 |
| Events in quadrant B | 2,425,534 | 588,722 |
| Events in quadrant C | 2,361,363 | 562,711 |
| Events in quadrant D | 3,157,677 | 503,583 |
| Mode M0 | |||
|---|---|---|---|
| Quadrant | BADHDUFLAG | Total packets | Discarded packets |
| A | 0 | 12103 | 2 |
| B | 0 | 10915 | 2 |
| C | 0 | 10471 | 2 |
| D | 0 | 13364 | 2 |
| Mode M9 | |||
|---|---|---|---|
| Quadrant | BADHDUFLAG | Total packets | Discarded packets |
| A | 0 | 24 | 0 |
| B | 0 | 25 | 0 |
| C | 0 | 25 | 0 |
| D | 0 | 25 | 0 |
| Mode SS | |||
|---|---|---|---|
| Quadrant | BADHDUFLAG | Total packets | Discarded packets |
| A | 0 | 106 | 0 |
| B | 0 | 106 | 0 |
| C | 0 | 106 | 0 |
| D | 0 | 106 | 0 |
| Quadrant | Total seconds | Saturated seconds | Saturation percentage |
|---|---|---|---|
| A | 5181 | 107 | 2.065238% |
| B | 5181 | 24 | 0.463231% |
| C | 5181 | 5 | 0.096506% |
| D | 5181 | 188 | 3.628643% |
Noise dominated data is calculated using 1-second bins in cleaned event files. If a bin has >2000 counts, and if more than 50% of those come from <1% of pixels, then it is considered to be noise-dominated and hence unusable.
| Quadrant | # 1 sec bins | Bins with >0 counts | Bins with >2000 counts | High rate bins dominated by noise | Noise dominated (total time) | Noise dominated (detector-on time) | Marked lightcurve |
|---|---|---|---|---|---|---|---|
| A | 7273 | 5181 | 70 | 70 | 0.96% | 1.35% | 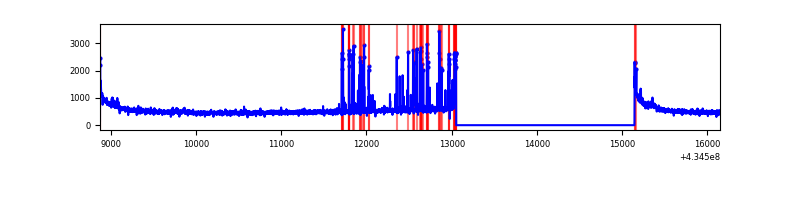 |
| B | 7272 | 5181 | 20 | 20 | 0.28% | 0.39% | 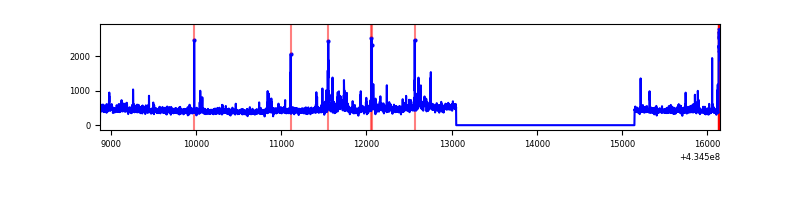 |
| C | 7273 | 5182 | 0 | 0 | 0.00% | 0.00% | 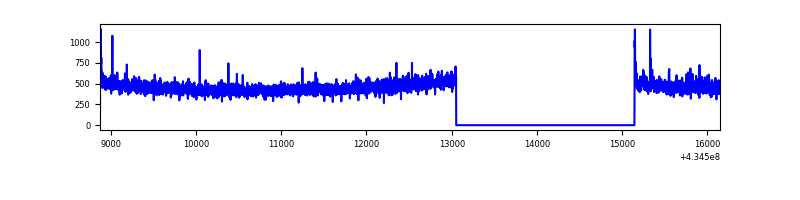 |
| D | 7273 | 5182 | 179 | 179 | 2.46% | 3.45% | 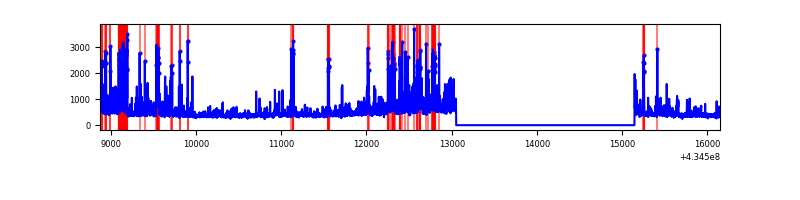 |
Top three noisy pixels from each quadrant. If the there are fewer than three noisy pixels in the level2.evt file, extra rows are filled as -1
| Pixel properties | Quadrant properties | ||||||
|---|---|---|---|---|---|---|---|
| Quadrant | DetID | PixID | Counts | Sigma | Mean | Median | Sigma |
| A | 10 | 83 | 575970 | 5178.31 | 544 | 532 | 111.1 |
| A | 15 | 237 | 307477 | 2762.17 | 544 | 532 | 111.1 |
| A | 13 | 6 | 11028 | 94.45 | 544 | 532 | 111.1 |
| B | 0 | 245 | 105944 | 1009.12 | 548 | 535 | 104.5 |
| B | 0 | 189 | 97316 | 926.52 | 548 | 535 | 104.5 |
| B | 0 | 186 | 21853 | 204.09 | 548 | 535 | 104.5 |
| C | 15 | 214 | 215382 | 1716.97 | 536 | 539 | 125.1 |
| C | 3 | 233 | 40998 | 323.34 | 536 | 539 | 125.1 |
| C | 14 | 254 | 8524 | 63.81 | 536 | 539 | 125.1 |
| D | 1 | 52 | 455373 | 3550.15 | 524 | 508 | 128.1 |
| D | 2 | 16 | 236950 | 1845.39 | 524 | 508 | 128.1 |
| D | 1 | 47 | 120736 | 938.36 | 524 | 508 | 128.1 |
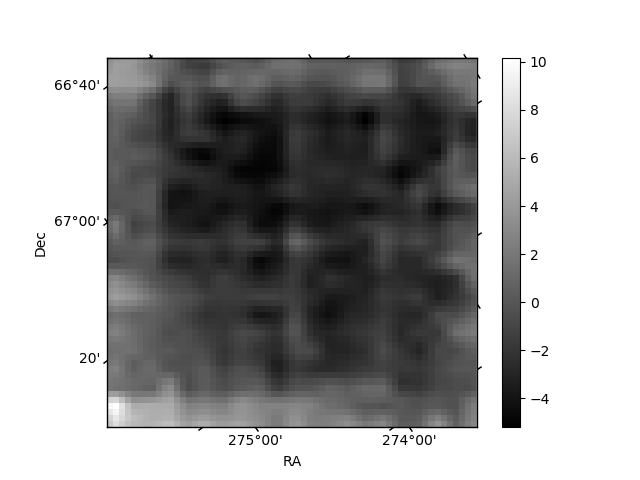
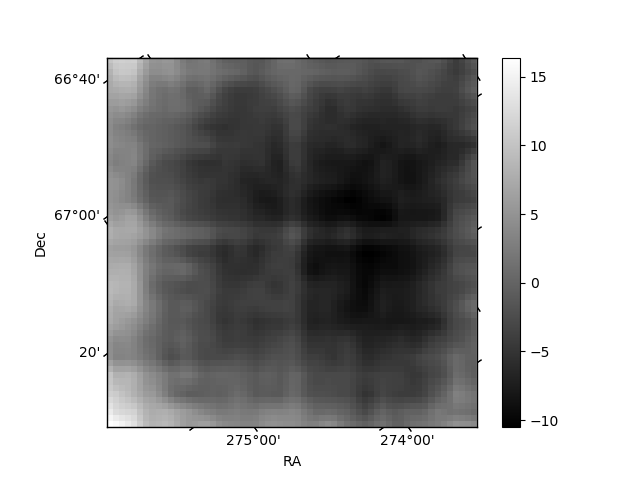
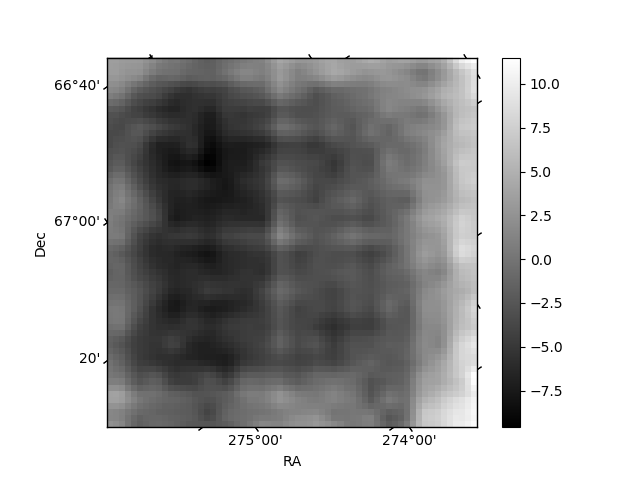
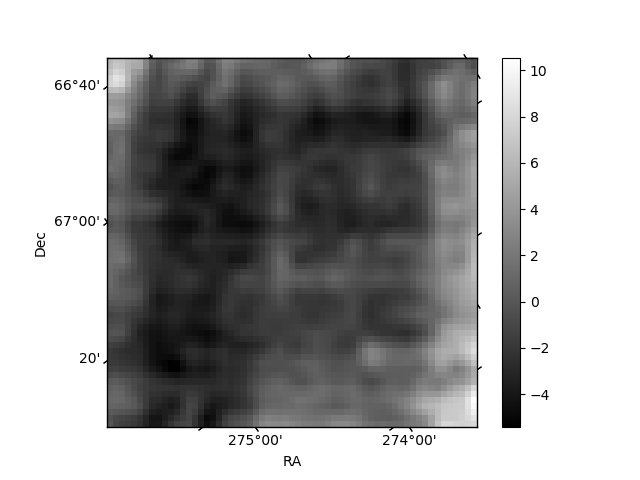
Histogram calculated using DETX and DETY for each event in the final _common_clean file
| Quadrant A | 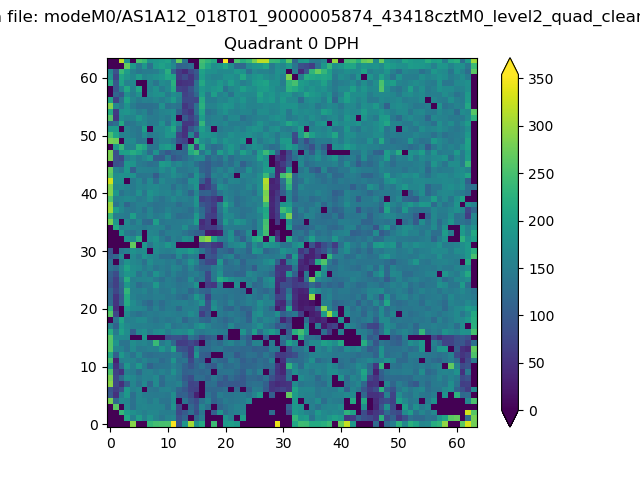 |
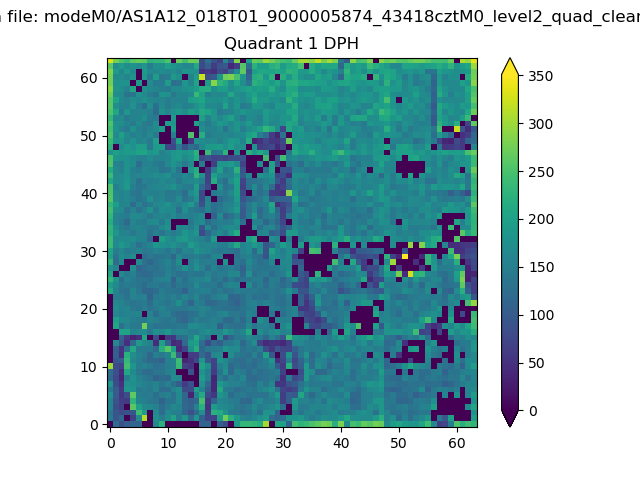 |
Quadrant B |
|---|---|---|---|
| Quadrant D | 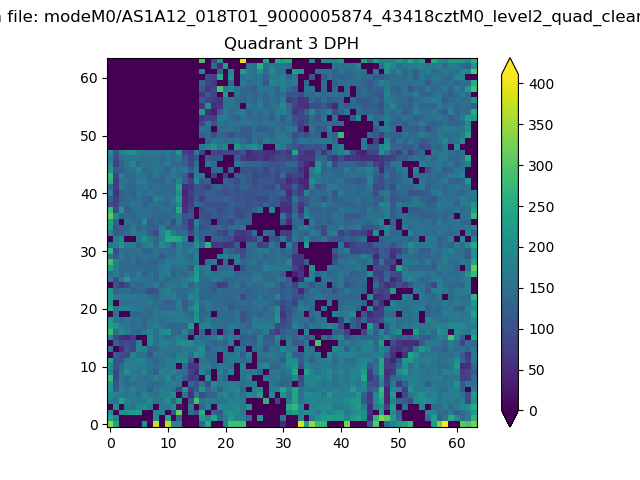 |
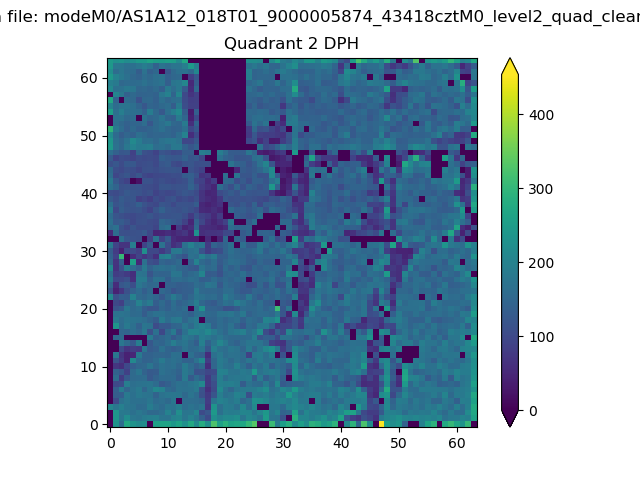 |
Quadrant C |
| Plot type | Count rate plots | Images |
|---|---|---|
| Comparison with Poisson distribution Blue bars denote a histogram of data divided into 1 sec bins. Red curve is a Poisson curve with rate = median count rate of data. |
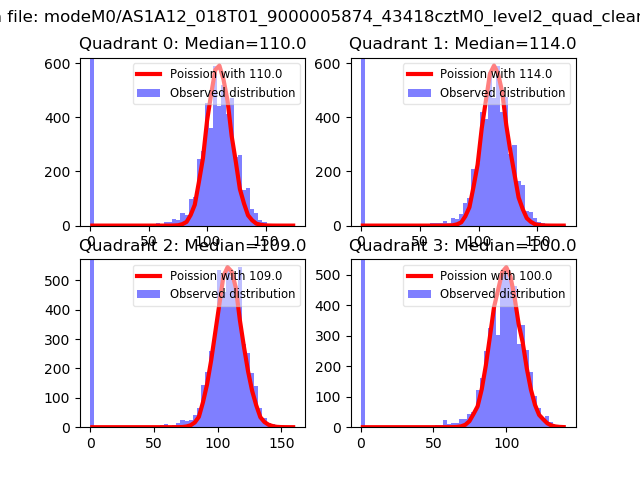 |
 |
| Quadrant-wise count rates Data is divided into 100 sec bins |
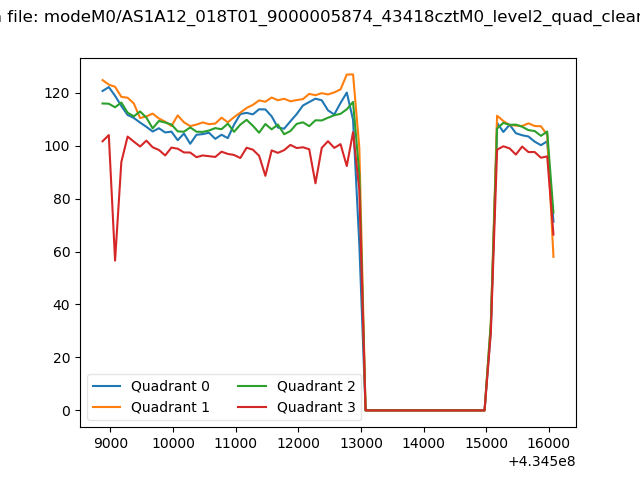 |
|
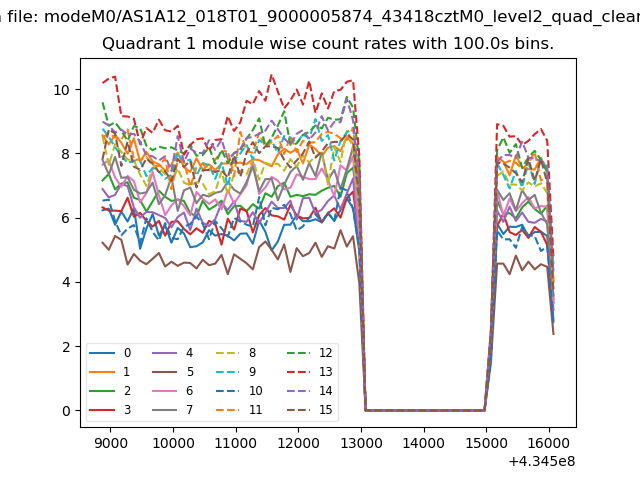
| Module-wise count rates for Quadrant A Data is divided into 100 sec bins |
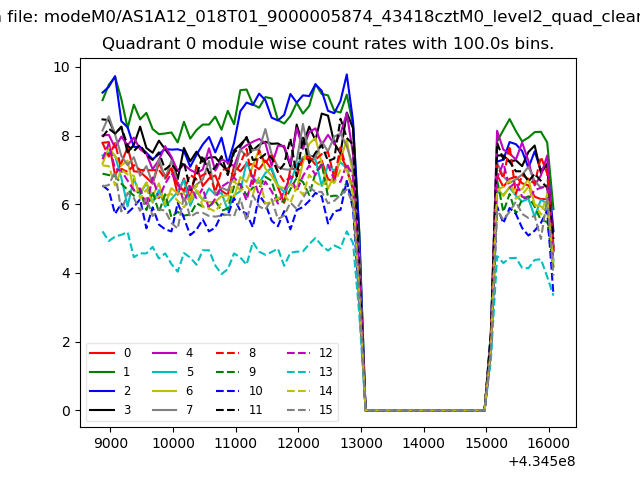 |
 |
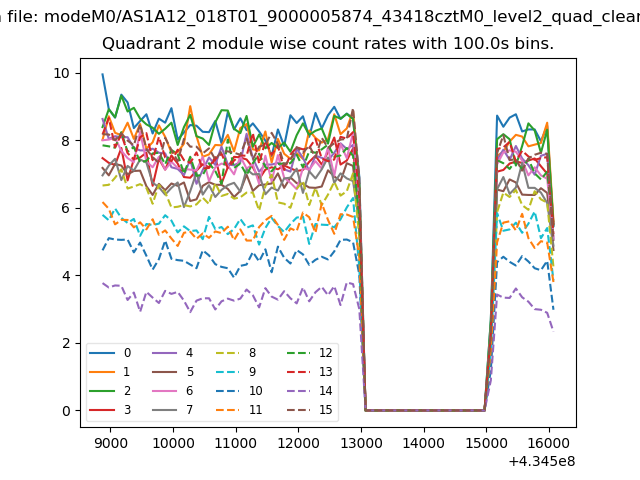
| Module-wise count rates for Quadrant B Data is divided into 100 sec bins |
 |
 |
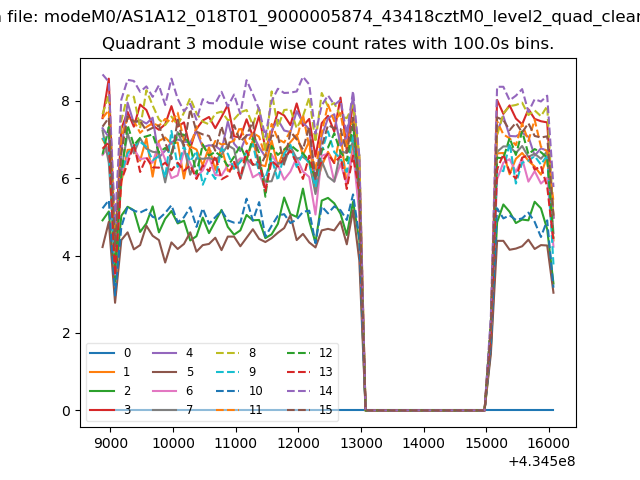
| Module-wise count rates for Quadrant C Data is divided into 100 sec bins |
 |
 |
| Module-wise count rates for Quadrant D Data is divided into 100 sec bins |
 |
 |
| Parameter | Plot |
|---|---|
| CZT HV Monitor | 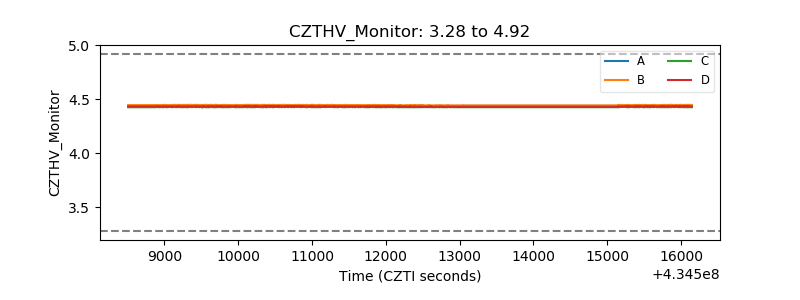 |
| D_VDD | 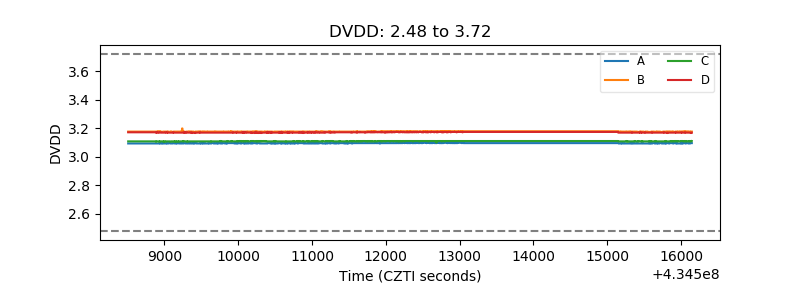 |
| Temperature 1 | 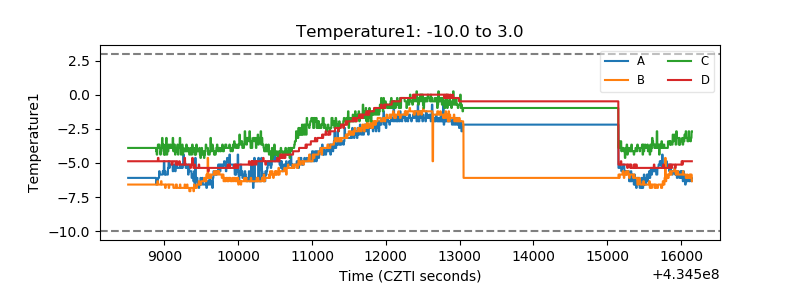 |
| Veto HV Monitor |  |
| Veto LLD | 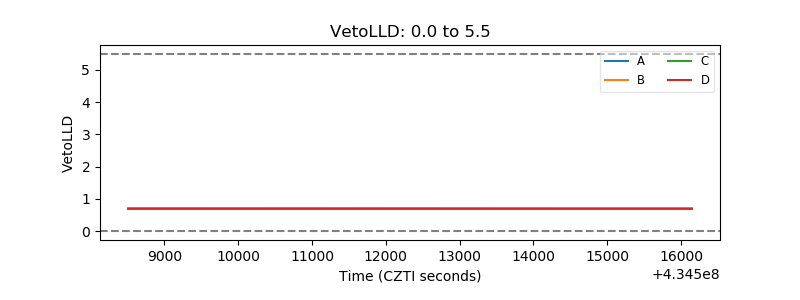 |
| Alpha Counter | 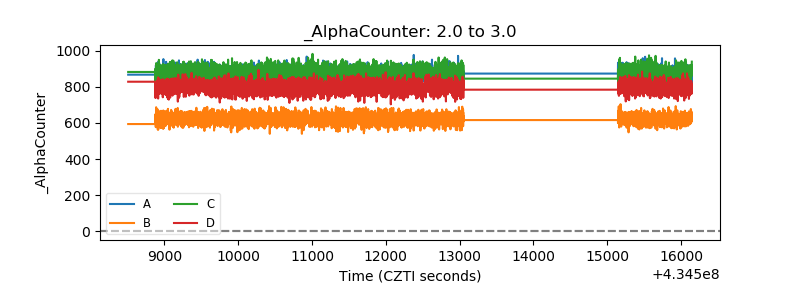 |
| _CPM_Rate | 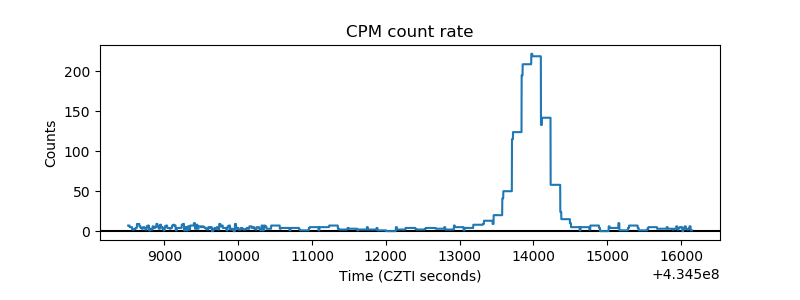 |
| CZT Counter | 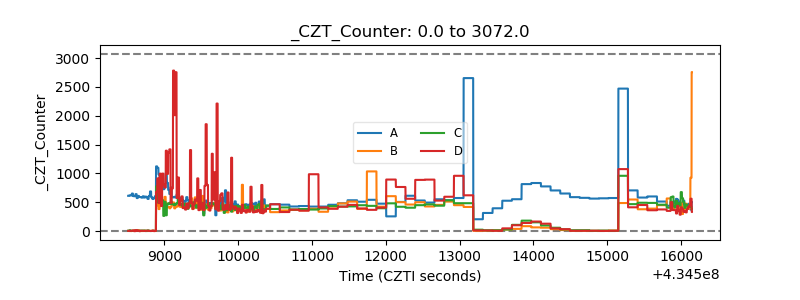 |
| +2.5 Volts monitor | 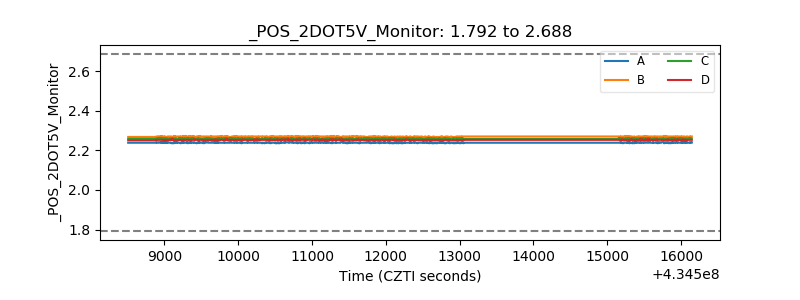 |
| +5 Volts monitor | 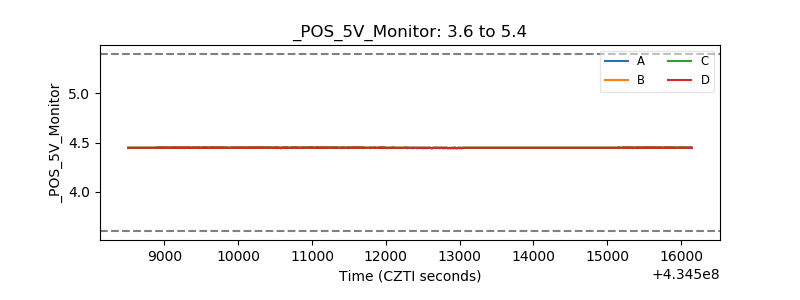 |
| _ROLL_ROT | 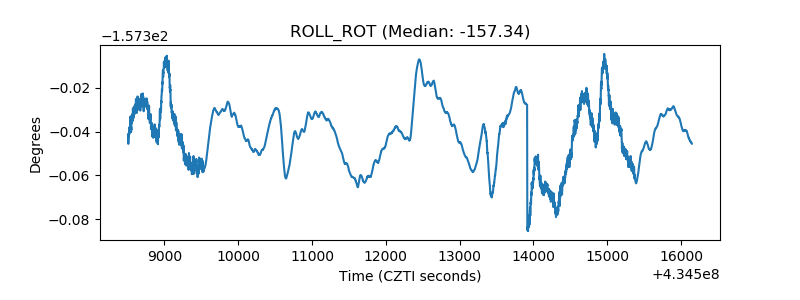 |
| _Roll_DEC | 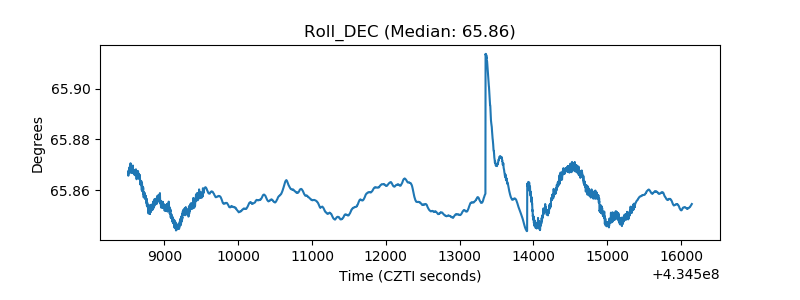 |
| _Roll_RA | 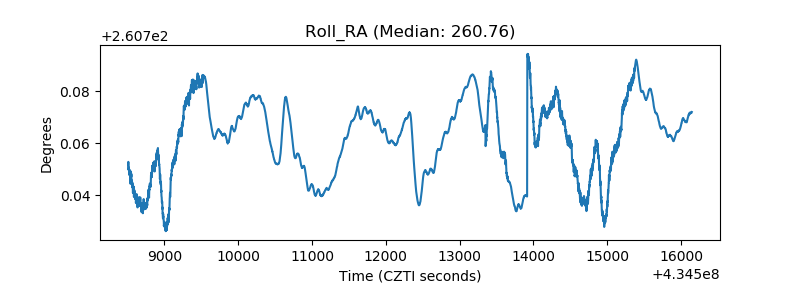 |
| Veto Counter | 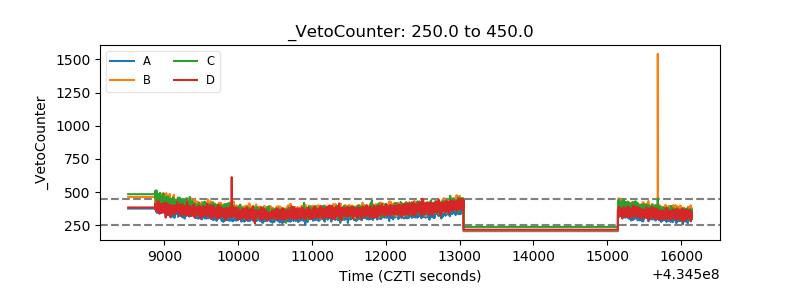 |