| Param | Original file | Final file |
|---|---|---|
| Filename | modeM0/AS1A12_018T01_9000005874_43420cztM0_level2.fits | modeM0/AS1A12_018T01_9000005874_43420cztM0_level2_quad_clean.evt |
| Size (bytes) | 394,914,240 | 88,689,600 |
| Size | 376.6 MB | 84.6 MB |
| Events in quadrant A | 3,165,768 | 601,030 |
| Events in quadrant B | 3,123,520 | 617,314 |
| Events in quadrant C | 2,624,853 | 587,561 |
| Events in quadrant D | 5,266,846 | 486,244 |
| Mode M0 | |||
|---|---|---|---|
| Quadrant | BADHDUFLAG | Total packets | Discarded packets |
| A | 0 | 12744 | 2 |
| B | 0 | 13306 | 2 |
| C | 0 | 11485 | 2 |
| D | 0 | 19710 | 2 |
| Mode M9 | |||
|---|---|---|---|
| Quadrant | BADHDUFLAG | Total packets | Discarded packets |
| A | 0 | 16 | 0 |
| B | 0 | 17 | 0 |
| C | 0 | 17 | 0 |
| D | 0 | 17 | 0 |
| Mode SS | |||
|---|---|---|---|
| Quadrant | BADHDUFLAG | Total packets | Discarded packets |
| A | 0 | 114 | 0 |
| B | 0 | 114 | 0 |
| C | 0 | 114 | 0 |
| D | 0 | 114 | 0 |
| Quadrant | Total seconds | Saturated seconds | Saturation percentage |
|---|---|---|---|
| A | 5623 | 49 | 0.871421% |
| B | 5623 | 81 | 1.440512% |
| C | 5623 | 9 | 0.160057% |
| D | 5623 | 742 | 13.195803% |
Noise dominated data is calculated using 1-second bins in cleaned event files. If a bin has >2000 counts, and if more than 50% of those come from <1% of pixels, then it is considered to be noise-dominated and hence unusable.
| Quadrant | # 1 sec bins | Bins with >0 counts | Bins with >2000 counts | High rate bins dominated by noise | Noise dominated (total time) | Noise dominated (detector-on time) | Marked lightcurve |
|---|---|---|---|---|---|---|---|
| A | 7145 | 5624 | 31 | 31 | 0.43% | 0.55% | 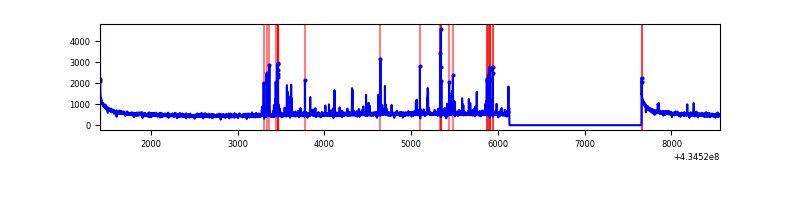 |
| B | 7145 | 5624 | 62 | 62 | 0.87% | 1.10% | 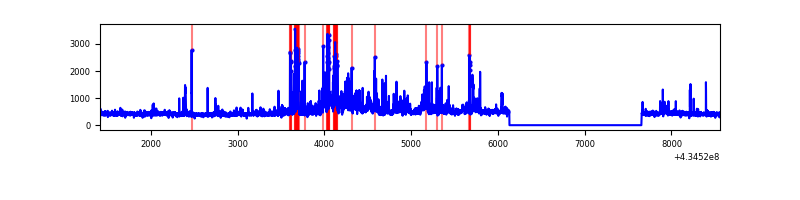 |
| C | 7145 | 5624 | 9 | 9 | 0.13% | 0.16% | 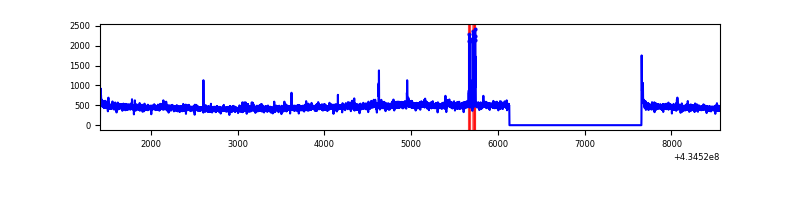 |
| D | 7145 | 5624 | 720 | 720 | 10.08% | 12.80% | 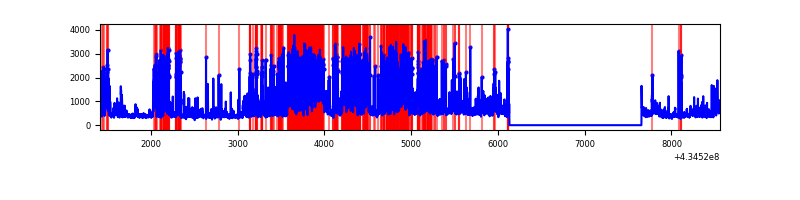 |
Top three noisy pixels from each quadrant. If the there are fewer than three noisy pixels in the level2.evt file, extra rows are filled as -1
| Pixel properties | Quadrant properties | ||||||
|---|---|---|---|---|---|---|---|
| Quadrant | DetID | PixID | Counts | Sigma | Mean | Median | Sigma |
| A | 10 | 83 | 637296 | 5240.78 | 594 | 582 | 121.5 |
| A | 15 | 237 | 206956 | 1698.66 | 594 | 582 | 121.5 |
| A | 7 | 3 | 10029 | 77.76 | 594 | 582 | 121.5 |
| B | 0 | 189 | 448127 | 3915.5 | 591 | 575 | 114.3 |
| B | 5 | 255 | 122771 | 1069.06 | 591 | 575 | 114.3 |
| B | 0 | 186 | 78840 | 684.72 | 591 | 575 | 114.3 |
| C | 15 | 214 | 234453 | 1729.75 | 578 | 579 | 135.2 |
| C | 3 | 233 | 94462 | 694.37 | 578 | 579 | 135.2 |
| C | 0 | 239 | 33954 | 246.84 | 578 | 579 | 135.2 |
| D | 1 | 52 | 1722973 | 12850.53 | 548 | 530 | 134.0 |
| D | 1 | 47 | 819407 | 6109.35 | 548 | 530 | 134.0 |
| D | 2 | 249 | 260982 | 1943.14 | 548 | 530 | 134.0 |
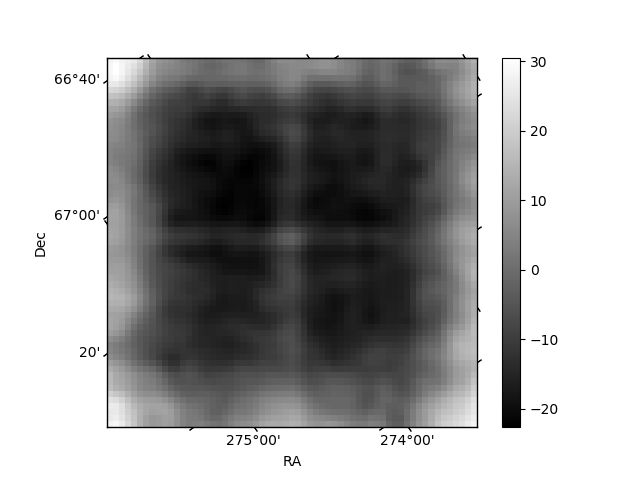
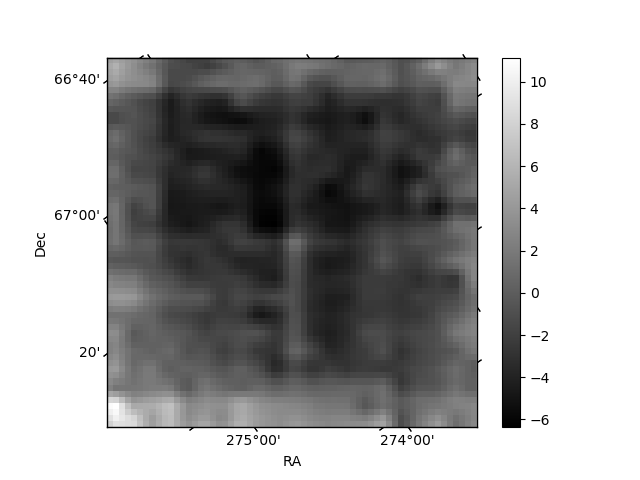
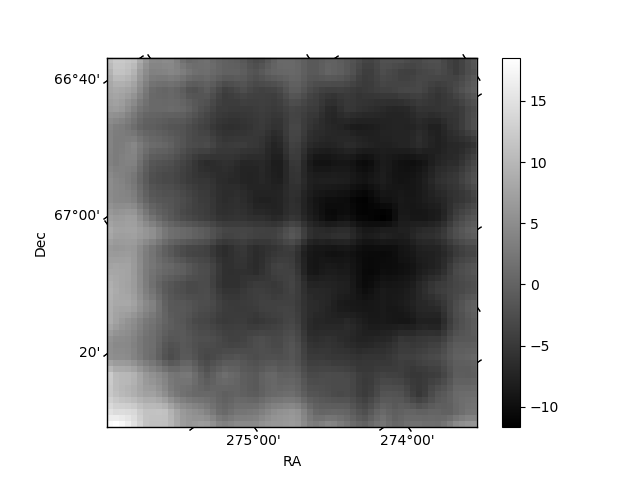
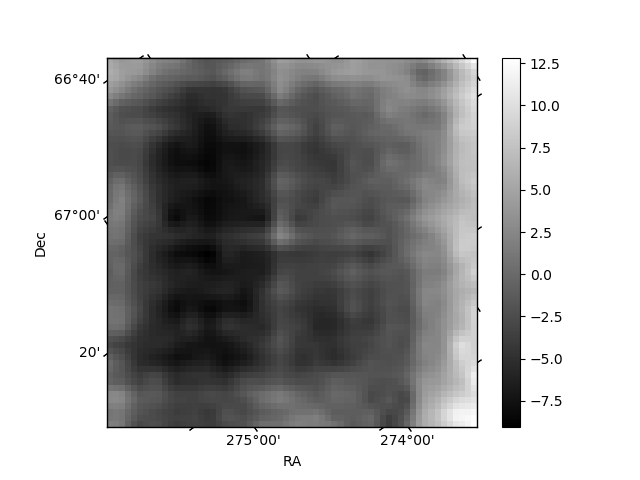
Histogram calculated using DETX and DETY for each event in the final _common_clean file
| Quadrant A | 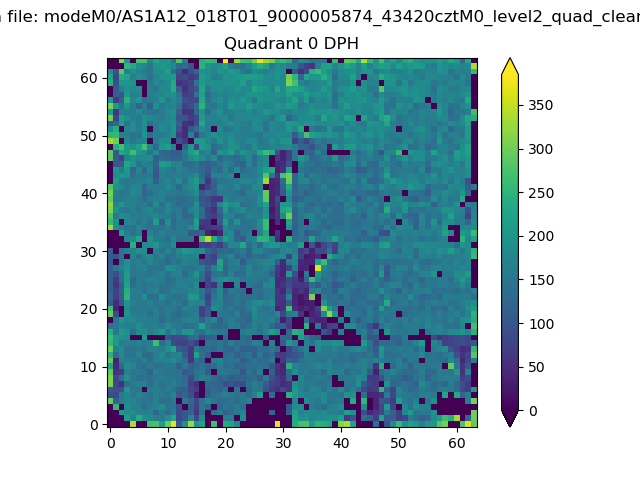 |
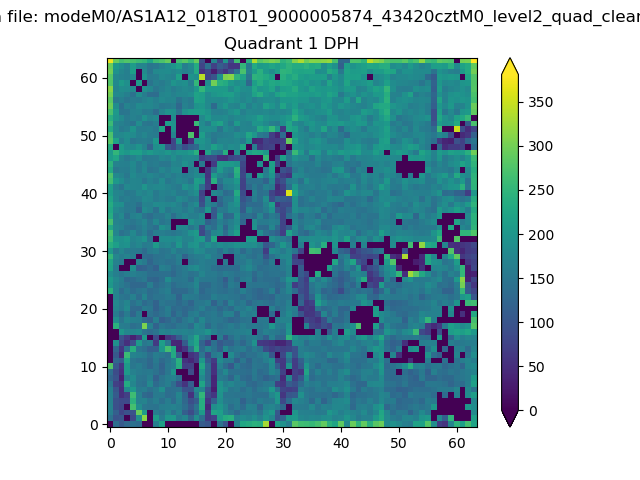 |
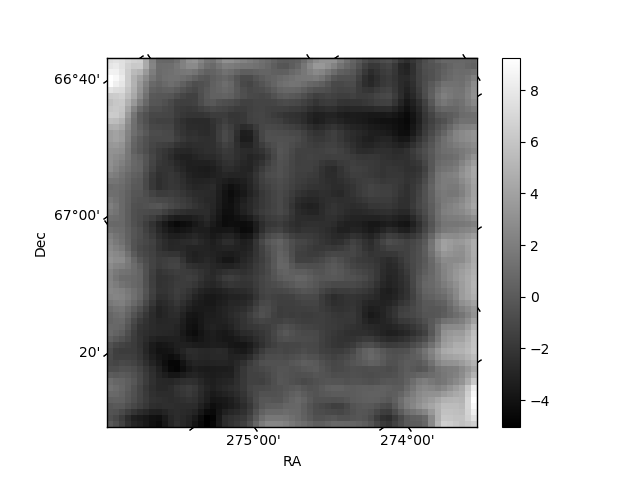
Quadrant B |
|---|---|---|---|
| Quadrant D | 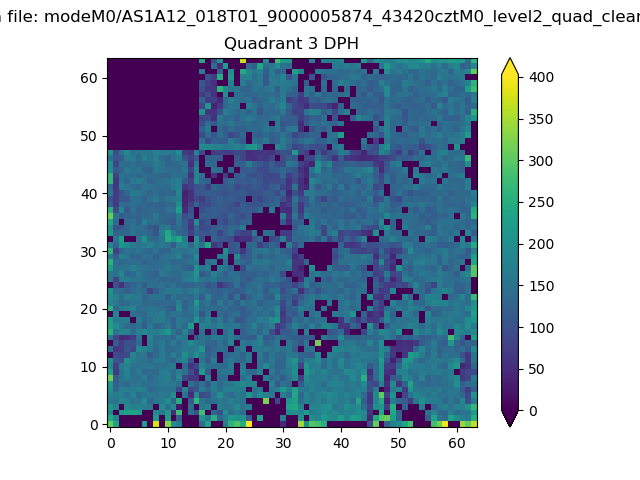 |
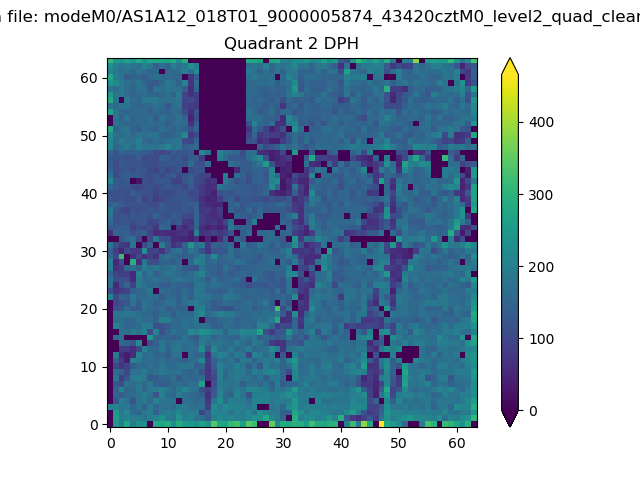 |
Quadrant C |
| Plot type | Count rate plots | Images |
|---|---|---|
| Comparison with Poisson distribution Blue bars denote a histogram of data divided into 1 sec bins. Red curve is a Poisson curve with rate = median count rate of data. |
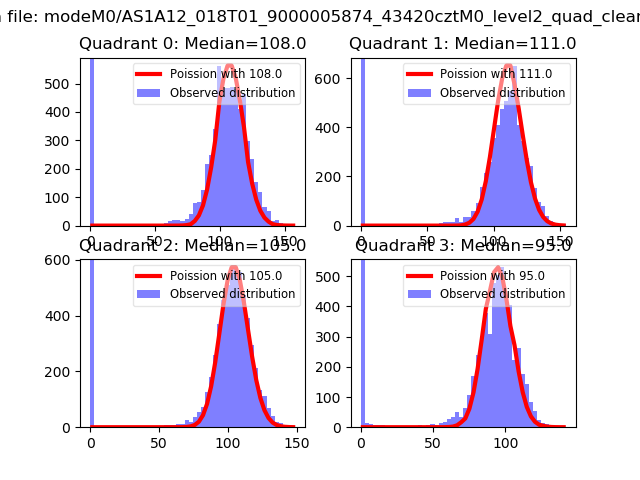 |
 |
| Quadrant-wise count rates Data is divided into 100 sec bins |
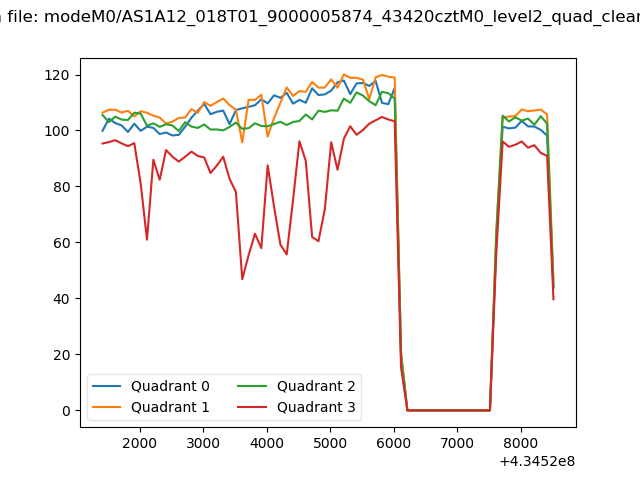 |
|
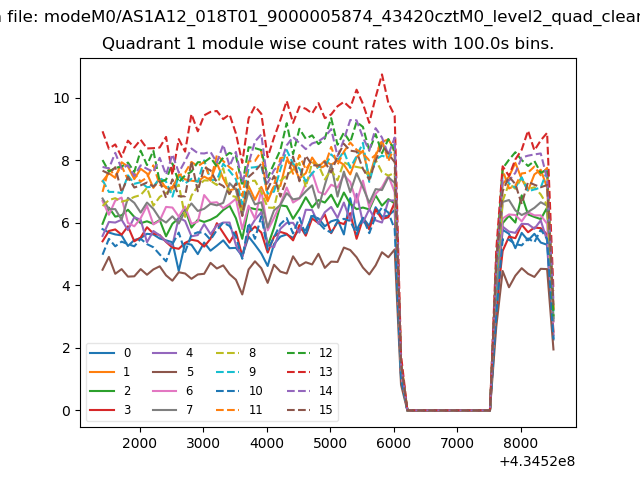
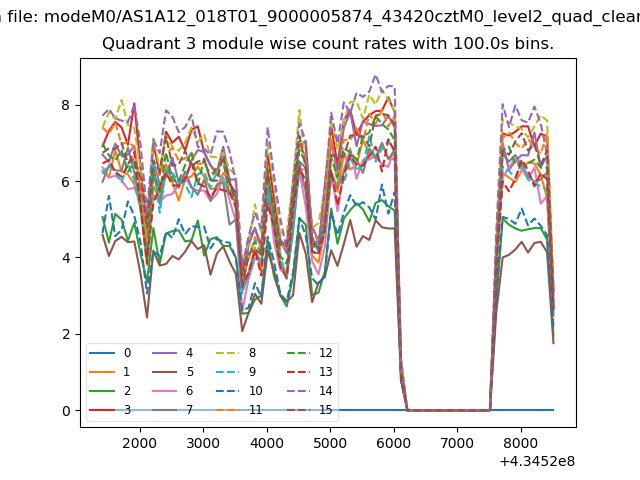
| Module-wise count rates for Quadrant A Data is divided into 100 sec bins |
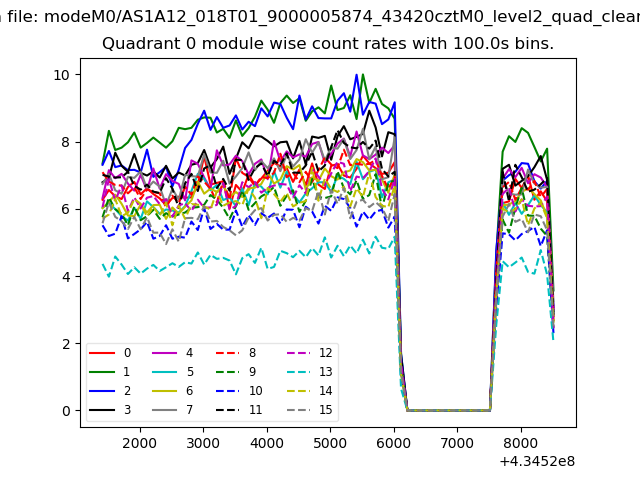 |
 |
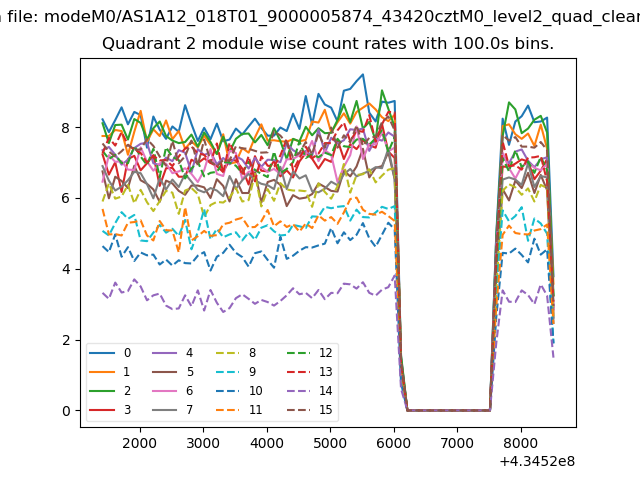
| Module-wise count rates for Quadrant B Data is divided into 100 sec bins |
 |
 |
| Module-wise count rates for Quadrant C Data is divided into 100 sec bins |
 |
 |
| Module-wise count rates for Quadrant D Data is divided into 100 sec bins |
 |
 |
| Parameter | Plot |
|---|---|
| CZT HV Monitor | 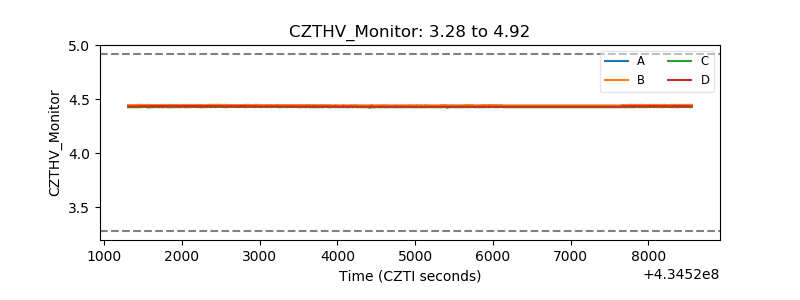 |
| D_VDD | 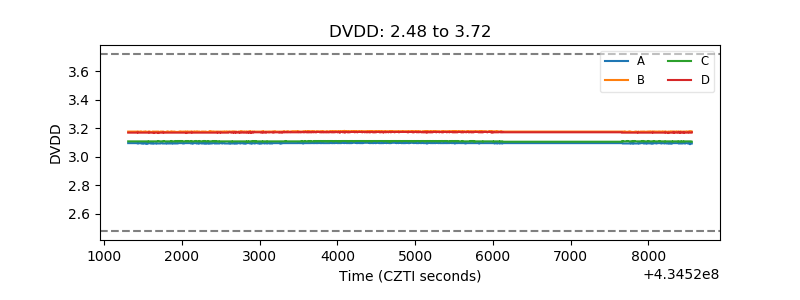 |
| Temperature 1 | 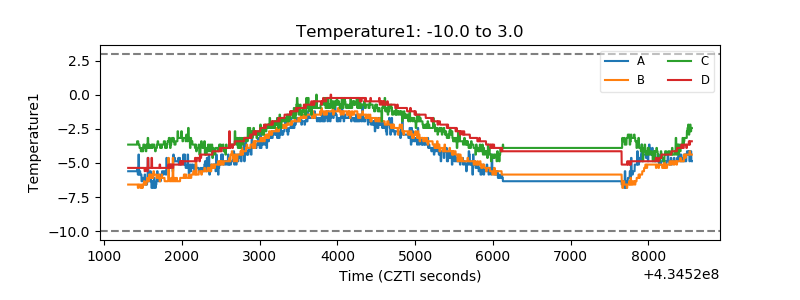 |
| Veto HV Monitor | 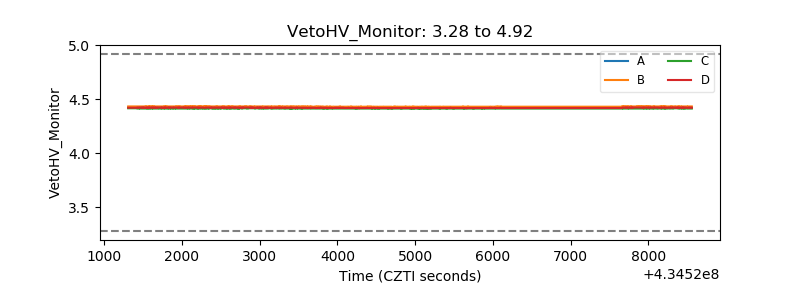 |
| Veto LLD | 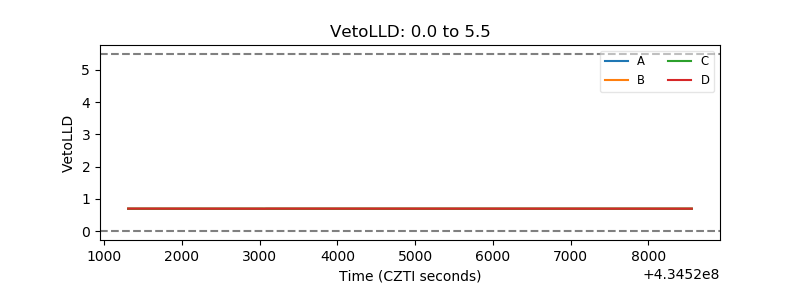 |
| Alpha Counter | 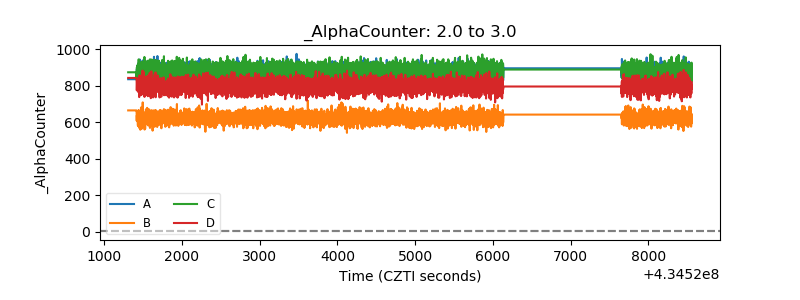 |
| _CPM_Rate | 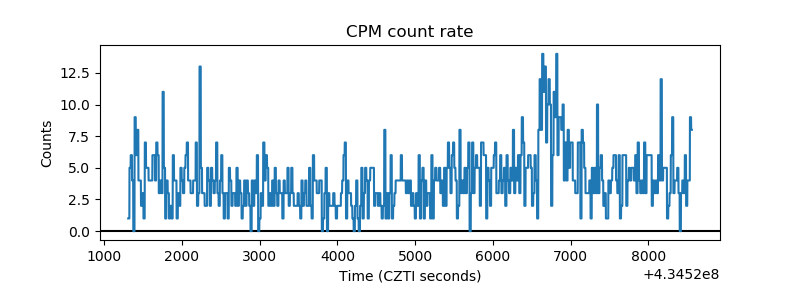 |
| CZT Counter | 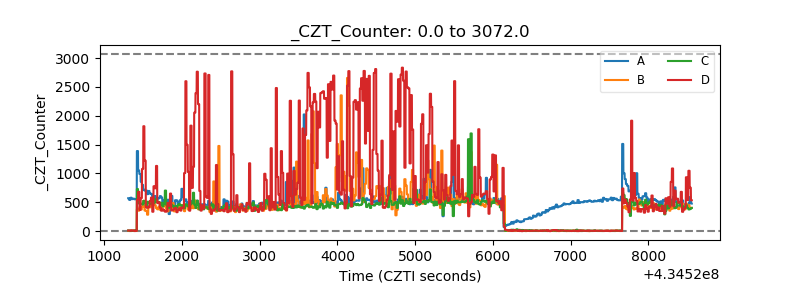 |
| +2.5 Volts monitor | 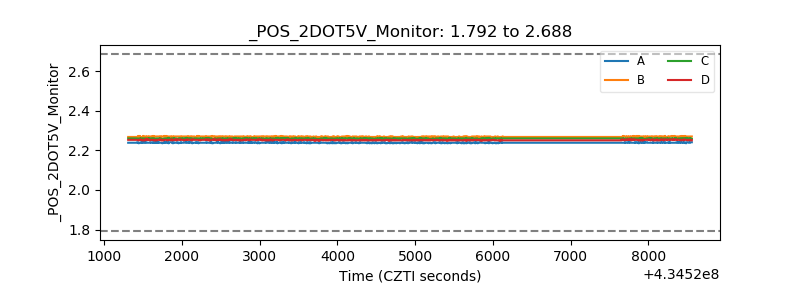 |
| +5 Volts monitor | 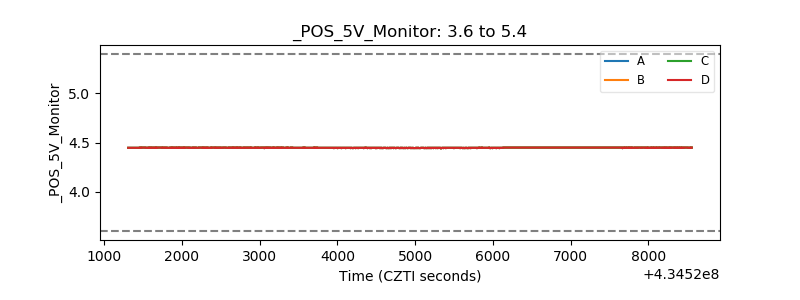 |
| _ROLL_ROT | 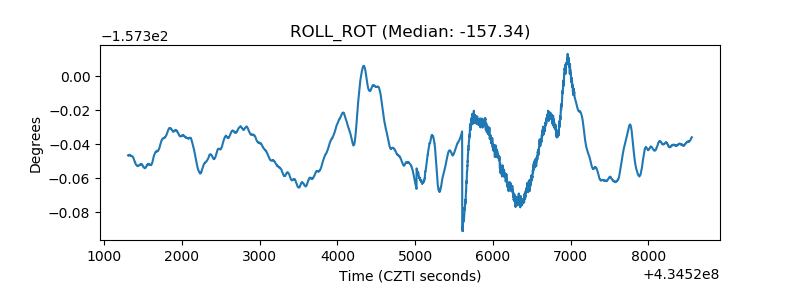 |
| _Roll_DEC | 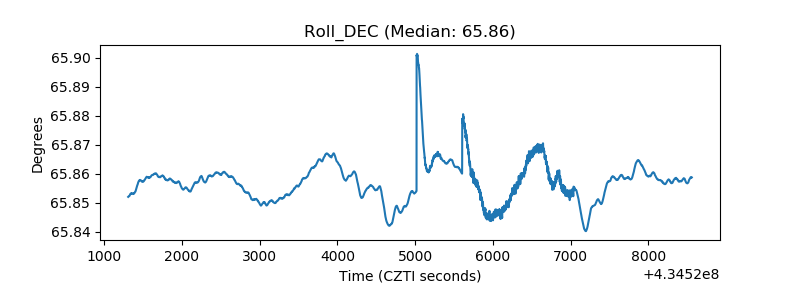 |
| _Roll_RA | 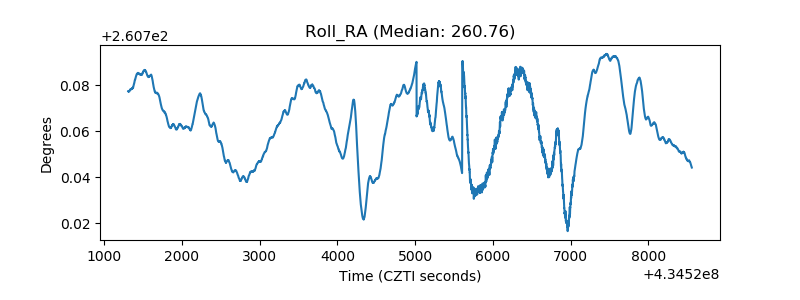 |
| Veto Counter | 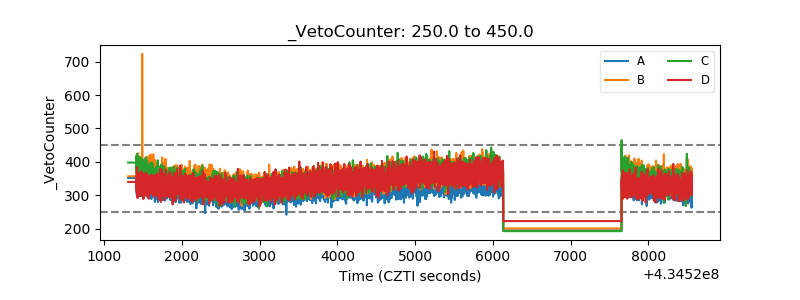 |