| Param | Original file | Final file |
|---|---|---|
| Filename | modeM0/AS1A12_018T01_9000005874_43422cztM0_level2.fits | modeM0/AS1A12_018T01_9000005874_43422cztM0_level2_quad_clean.evt |
| Size (bytes) | 366,750,720 | 94,985,280 |
| Size | 349.8 MB | 90.6 MB |
| Events in quadrant A | 3,505,379 | 634,535 |
| Events in quadrant B | 2,813,133 | 656,468 |
| Events in quadrant C | 2,758,489 | 611,995 |
| Events in quadrant D | 4,039,322 | 560,195 |
| Mode M0 | |||
|---|---|---|---|
| Quadrant | BADHDUFLAG | Total packets | Discarded packets |
| A | 0 | 13794 | 2 |
| B | 0 | 12427 | 2 |
| C | 0 | 11982 | 2 |
| D | 0 | 16197 | 2 |
| Mode M9 | |||
|---|---|---|---|
| Quadrant | BADHDUFLAG | Total packets | Discarded packets |
| A | 0 | 13 | 0 |
| B | 0 | 13 | 0 |
| C | 0 | 13 | 0 |
| D | 0 | 13 | 0 |
| Mode SS | |||
|---|---|---|---|
| Quadrant | BADHDUFLAG | Total packets | Discarded packets |
| A | 0 | 120 | 0 |
| B | 0 | 120 | 0 |
| C | 0 | 120 | 0 |
| D | 0 | 120 | 0 |
| Quadrant | Total seconds | Saturated seconds | Saturation percentage |
|---|---|---|---|
| A | 5906 | 129 | 2.184219% |
| B | 5907 | 19 | 0.321652% |
| C | 5907 | 4 | 0.067716% |
| D | 5907 | 109 | 1.845268% |
Noise dominated data is calculated using 1-second bins in cleaned event files. If a bin has >2000 counts, and if more than 50% of those come from <1% of pixels, then it is considered to be noise-dominated and hence unusable.
| Quadrant | # 1 sec bins | Bins with >0 counts | Bins with >2000 counts | High rate bins dominated by noise | Noise dominated (total time) | Noise dominated (detector-on time) | Marked lightcurve |
|---|---|---|---|---|---|---|---|
| A | 7218 | 5907 | 97 | 97 | 1.34% | 1.64% | 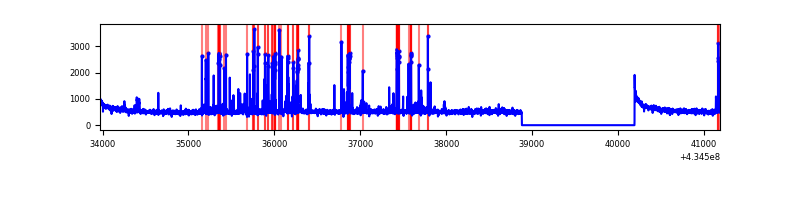 |
| B | 7219 | 5908 | 15 | 15 | 0.21% | 0.25% | 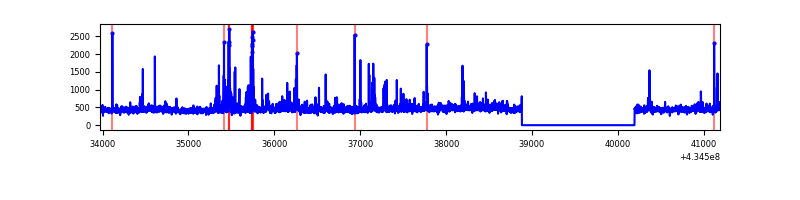 |
| C | 7219 | 5908 | 0 | 0 | 0.00% | 0.00% | 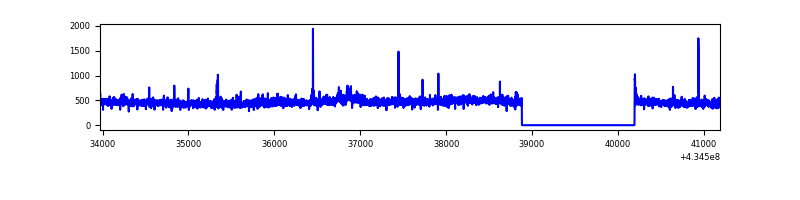 |
| D | 7219 | 5908 | 118 | 118 | 1.63% | 2.00% | 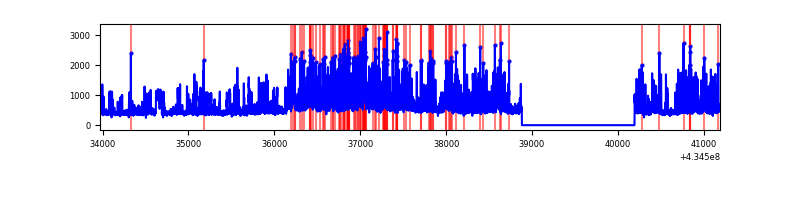 |
Top three noisy pixels from each quadrant. If the there are fewer than three noisy pixels in the level2.evt file, extra rows are filled as -1
| Pixel properties | Quadrant properties | ||||||
|---|---|---|---|---|---|---|---|
| Quadrant | DetID | PixID | Counts | Sigma | Mean | Median | Sigma |
| A | 10 | 83 | 621689 | 4805.78 | 629 | 617 | 129.2 |
| A | 15 | 237 | 412873 | 3189.99 | 629 | 617 | 129.2 |
| A | 2 | 79 | 28917 | 218.98 | 629 | 617 | 129.2 |
| B | 5 | 255 | 113490 | 928.31 | 632 | 615 | 121.6 |
| B | 0 | 189 | 87473 | 714.34 | 632 | 615 | 121.6 |
| B | 0 | 186 | 38851 | 314.46 | 632 | 615 | 121.6 |
| C | 15 | 214 | 243628 | 1683.01 | 614 | 615 | 144.4 |
| C | 3 | 233 | 93342 | 642.19 | 614 | 615 | 144.4 |
| C | 2 | 16 | 14270 | 94.57 | 614 | 615 | 144.4 |
| D | 2 | 16 | 952453 | 6330.15 | 611 | 590 | 150.4 |
| D | 1 | 52 | 312804 | 2076.31 | 611 | 590 | 150.4 |
| D | 13 | 249 | 92199 | 609.23 | 611 | 590 | 150.4 |
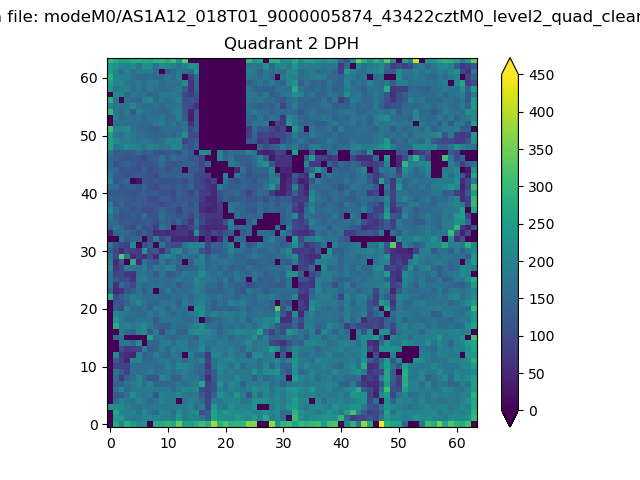
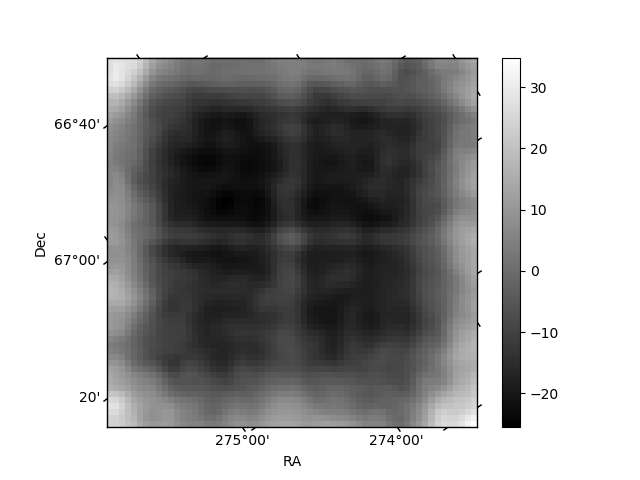
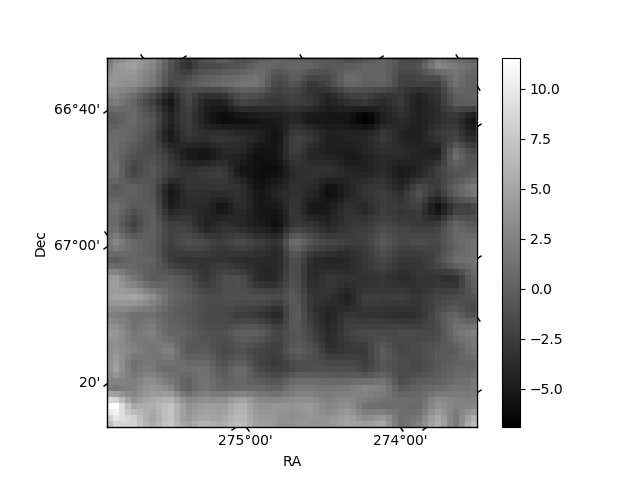
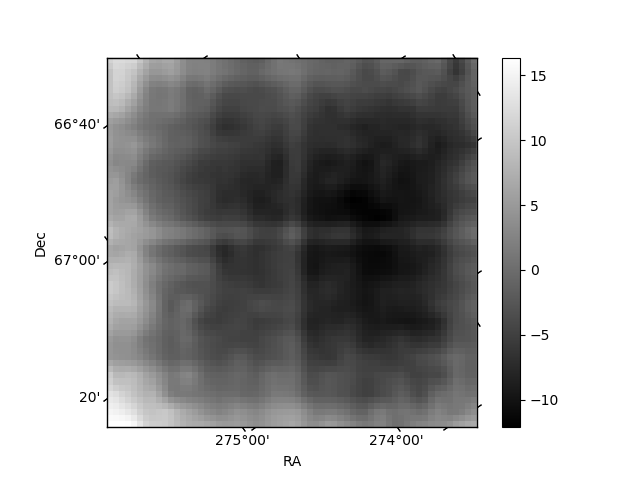
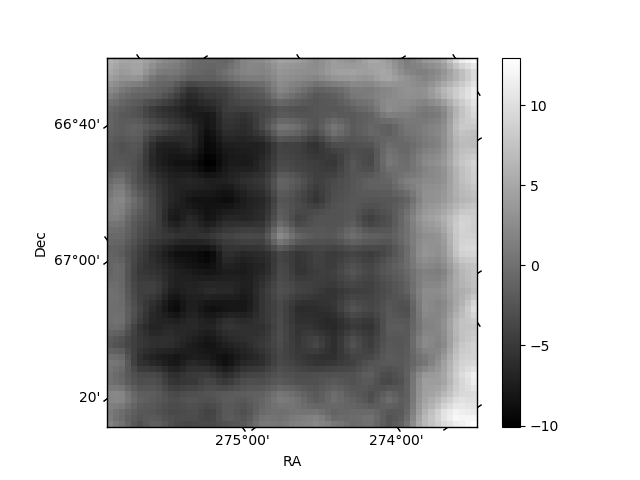
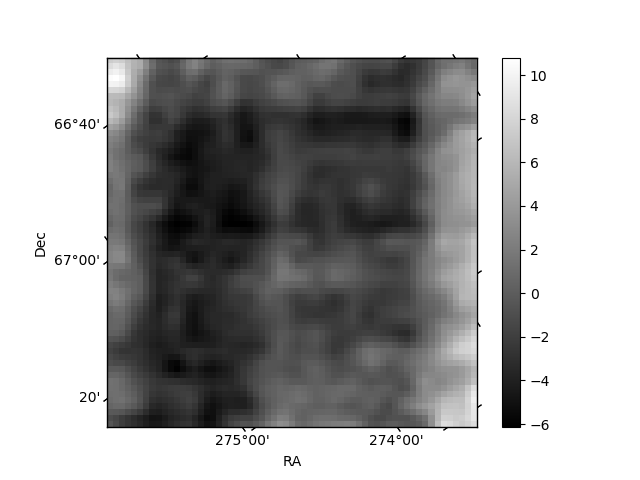
Histogram calculated using DETX and DETY for each event in the final _common_clean file
| Quadrant A | 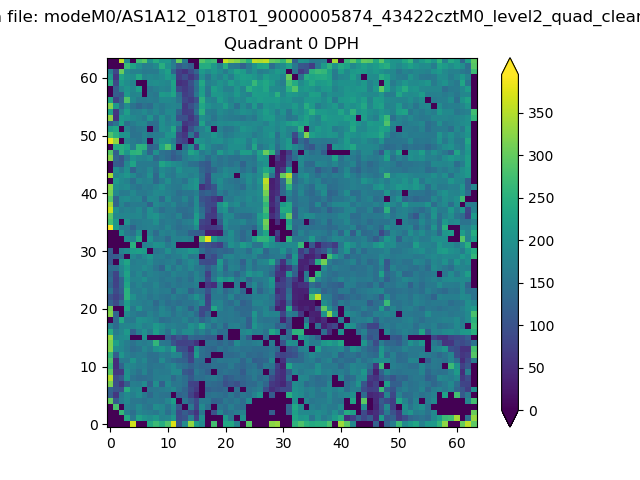 |
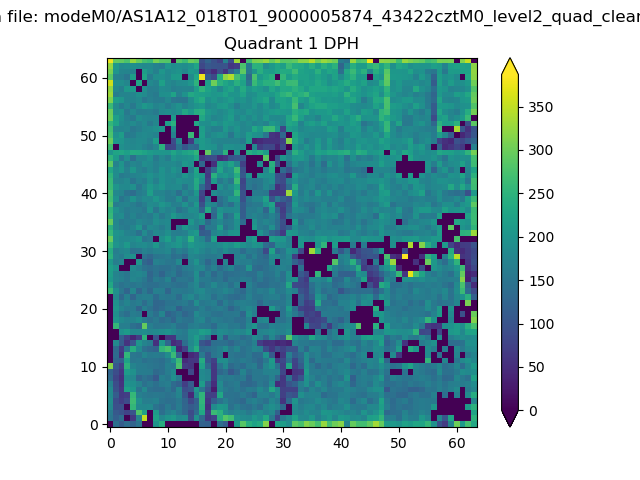 |
Quadrant B |
|---|---|---|---|
| Quadrant D | 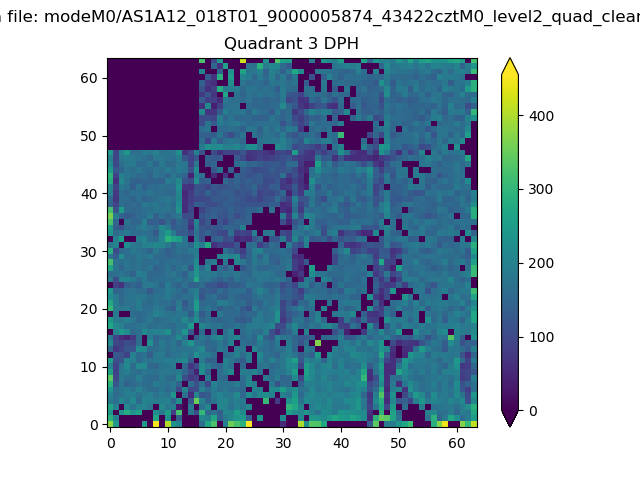 |
 |
Quadrant C |
| Plot type | Count rate plots | Images |
|---|---|---|
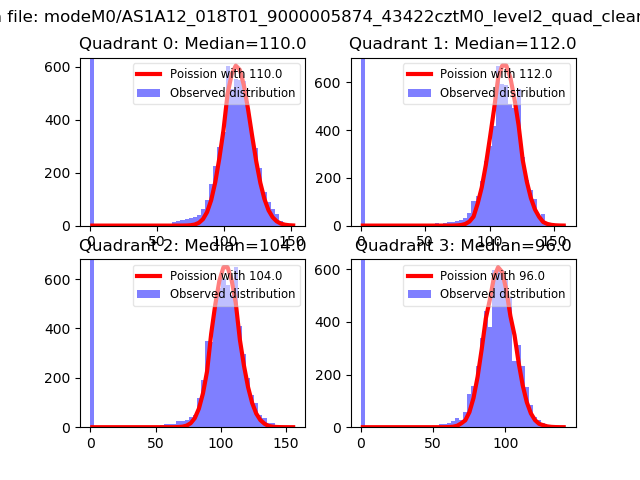
| Comparison with Poisson distribution Blue bars denote a histogram of data divided into 1 sec bins. Red curve is a Poisson curve with rate = median count rate of data. |
 |
 |
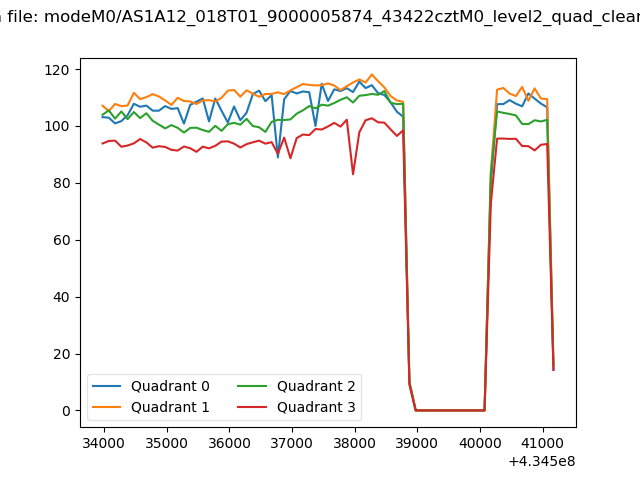
| Quadrant-wise count rates Data is divided into 100 sec bins |
 |
|
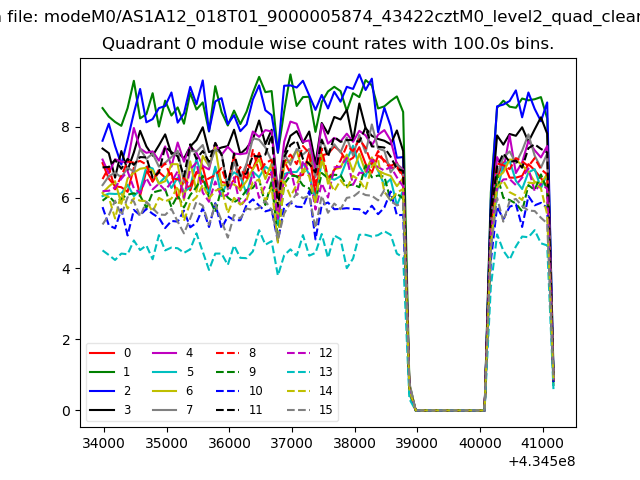
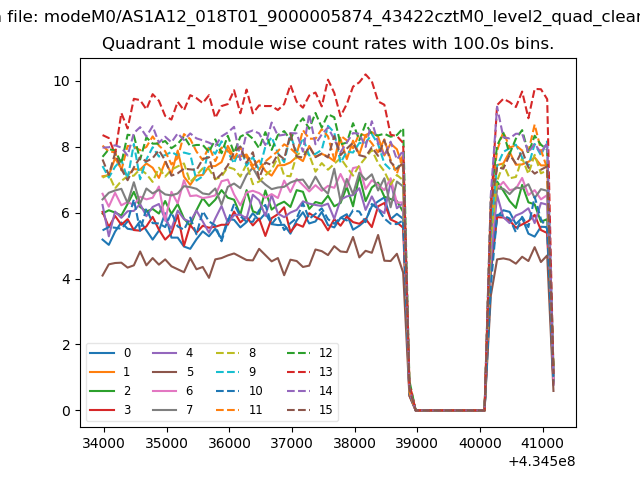
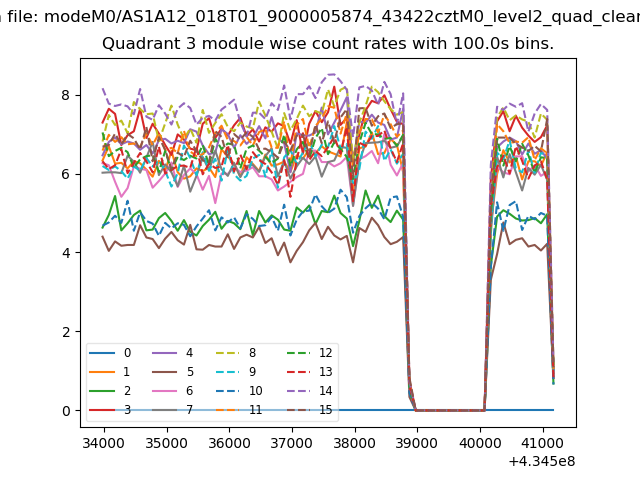
| Module-wise count rates for Quadrant A Data is divided into 100 sec bins |
 |
 |
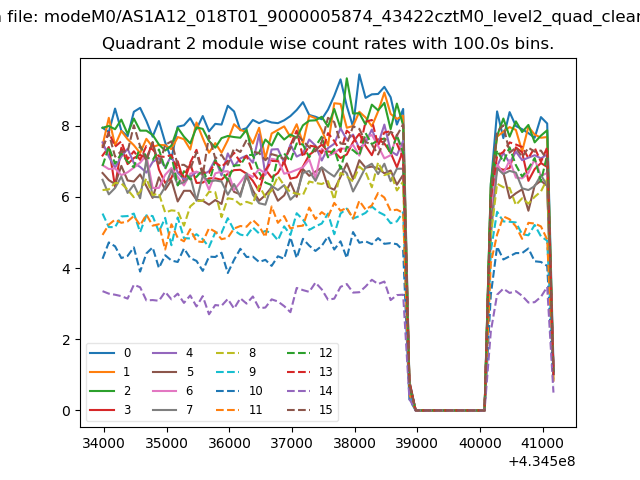
| Module-wise count rates for Quadrant B Data is divided into 100 sec bins |
 |
 |
| Module-wise count rates for Quadrant C Data is divided into 100 sec bins |
 |
 |
| Module-wise count rates for Quadrant D Data is divided into 100 sec bins |
 |
 |
| Parameter | Plot |
|---|---|
| CZT HV Monitor | 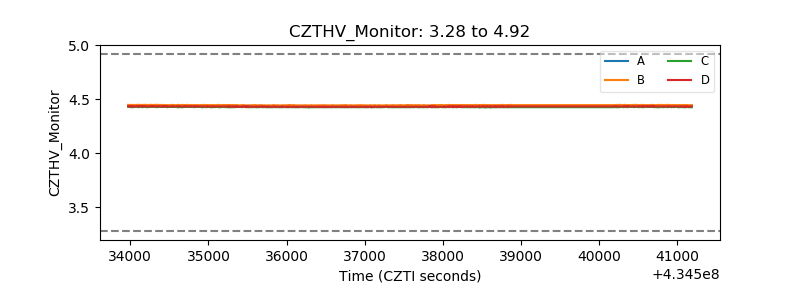 |
| D_VDD | 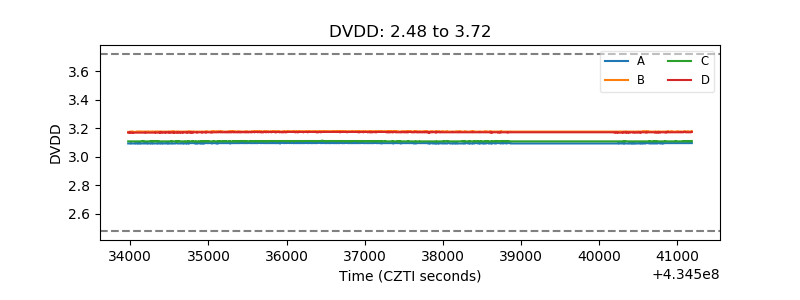 |
| Temperature 1 | 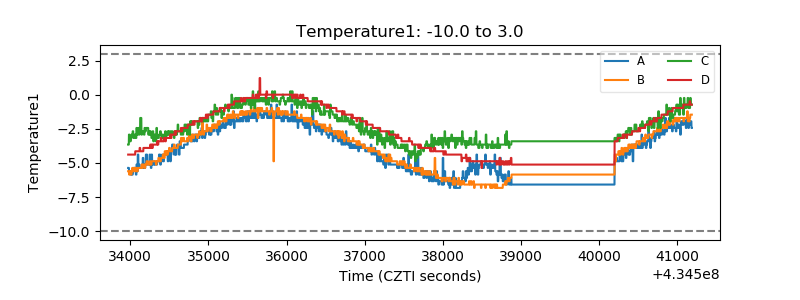 |
| Veto HV Monitor | 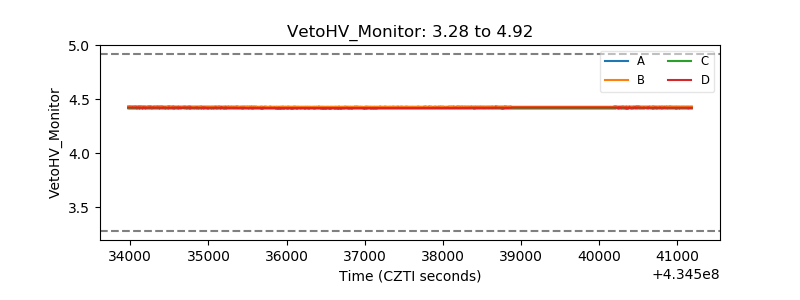 |
| Veto LLD | 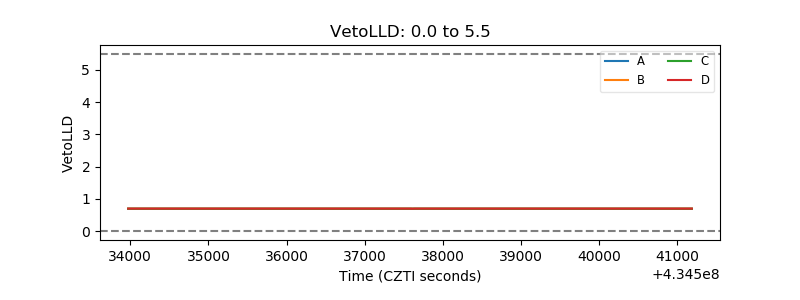 |
| Alpha Counter | 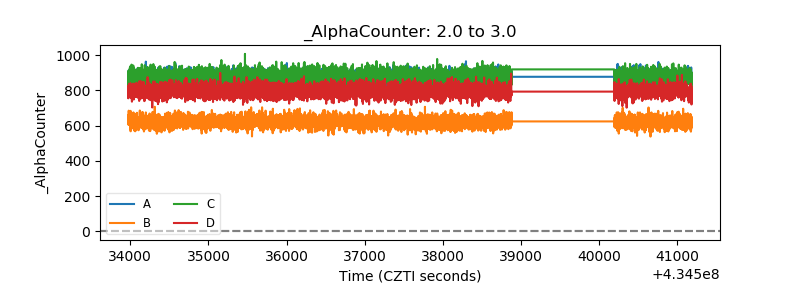 |
| _CPM_Rate | 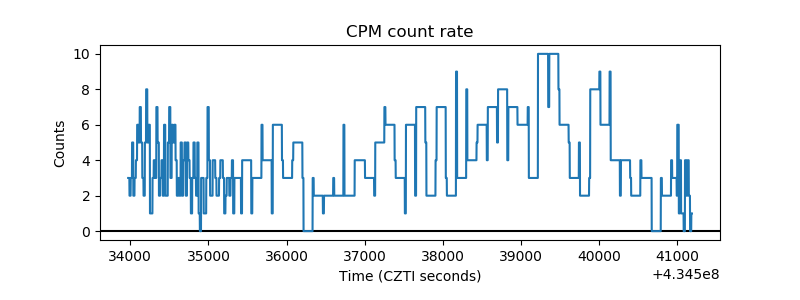 |
| CZT Counter | 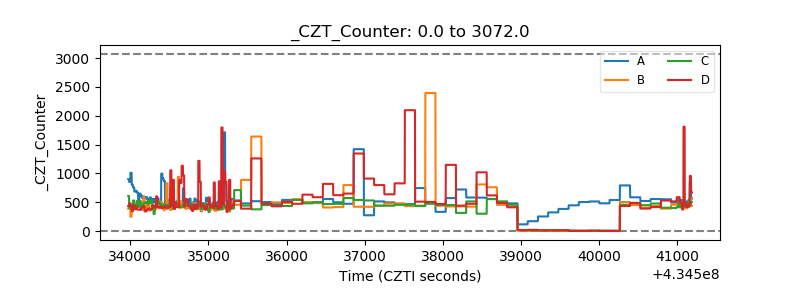 |
| +2.5 Volts monitor |  |
| +5 Volts monitor | 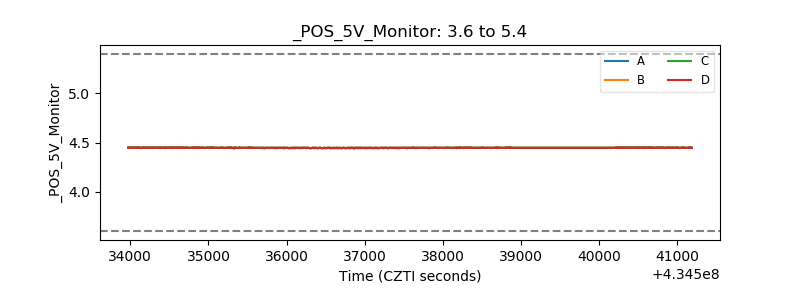 |
| _ROLL_ROT | 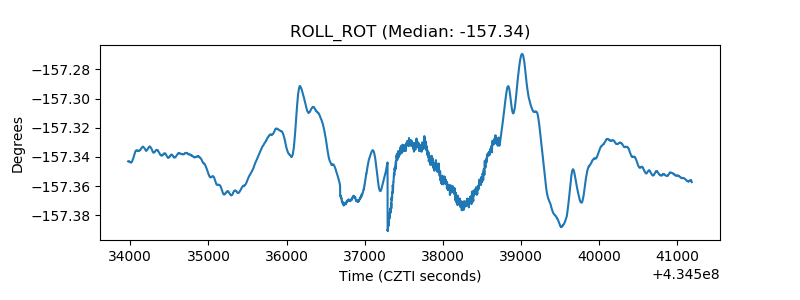 |
| _Roll_DEC | 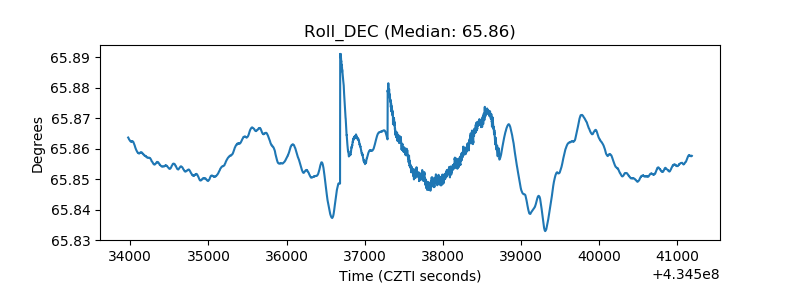 |
| _Roll_RA | 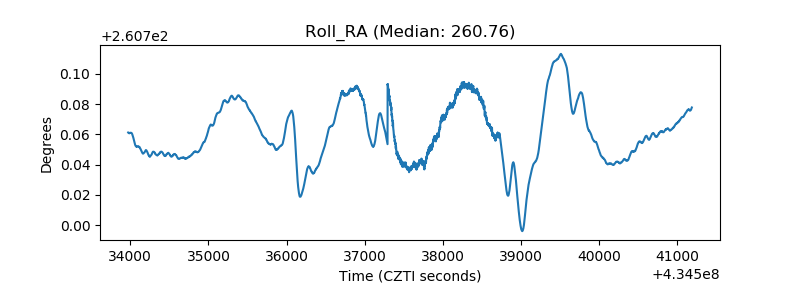 |
| Veto Counter | 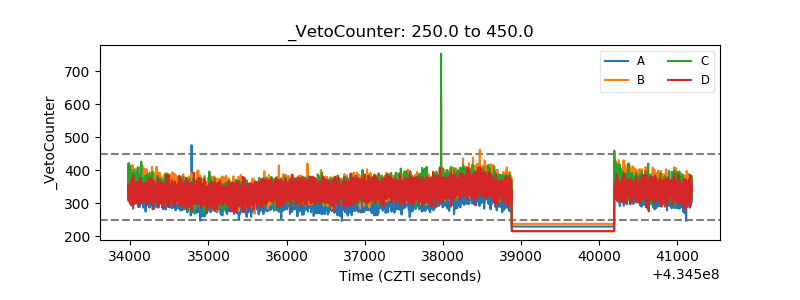 |