| Param | Original file | Final file |
|---|---|---|
| Filename | modeM0/AS1A12_018T01_9000005874_43425cztM0_level2.fits | modeM0/AS1A12_018T01_9000005874_43425cztM0_level2_quad_clean.evt |
| Size (bytes) | 666,152,640 | 165,024,000 |
| Size | 635.3 MB | 157.4 MB |
| Events in quadrant A | 5,840,189 | 1,113,988 |
| Events in quadrant B | 5,169,641 | 1,140,752 |
| Events in quadrant C | 5,139,226 | 1,069,401 |
| Events in quadrant D | 7,702,126 | 950,380 |
| Mode M0 | |||
|---|---|---|---|
| Quadrant | BADHDUFLAG | Total packets | Discarded packets |
| A | 0 | 23529 | 9 |
| B | 0 | 22463 | 4 |
| C | 0 | 22037 | 4 |
| D | 0 | 29947 | 2 |
| Mode M9 | |||
|---|---|---|---|
| Quadrant | BADHDUFLAG | Total packets | Discarded packets |
| A | 0 | 29 | 0 |
| B | 0 | 29 | 0 |
| C | 0 | 29 | 0 |
| D | 0 | 29 | 0 |
| Mode SS | |||
|---|---|---|---|
| Quadrant | BADHDUFLAG | Total packets | Discarded packets |
| A | 0 | 214 | 0 |
| B | 0 | 214 | 0 |
| C | 0 | 214 | 0 |
| D | 0 | 214 | 0 |
| Quadrant | Total seconds | Saturated seconds | Saturation percentage |
|---|---|---|---|
| A | 10413 | 123 | 1.181216% |
| B | 10417 | 50 | 0.479985% |
| C | 10416 | 32 | 0.307220% |
| D | 10417 | 472 | 4.531055% |
Noise dominated data is calculated using 1-second bins in cleaned event files. If a bin has >2000 counts, and if more than 50% of those come from <1% of pixels, then it is considered to be noise-dominated and hence unusable.
| Quadrant | # 1 sec bins | Bins with >0 counts | Bins with >2000 counts | High rate bins dominated by noise | Noise dominated (total time) | Noise dominated (detector-on time) | Marked lightcurve |
|---|---|---|---|---|---|---|---|
| A | 13402 | 10418 | 90 | 90 | 0.67% | 0.86% | 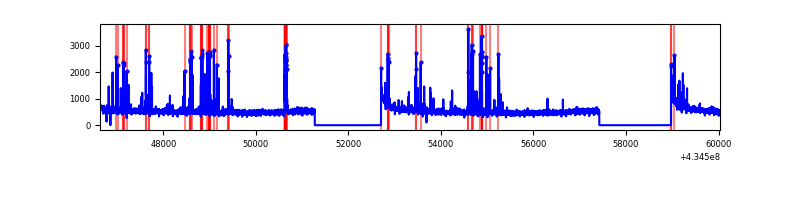 |
| B | 13403 | 10420 | 39 | 39 | 0.29% | 0.37% | 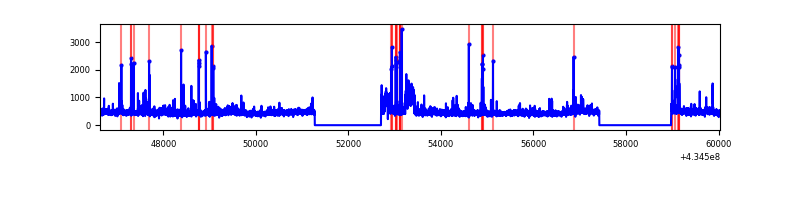 |
| C | 13402 | 10419 | 28 | 28 | 0.21% | 0.27% | 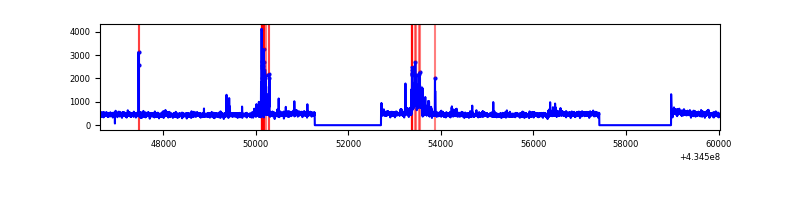 |
| D | 13402 | 10419 | 516 | 516 | 3.85% | 4.95% | 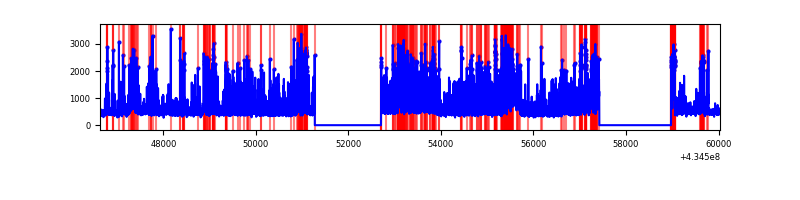 |
Top three noisy pixels from each quadrant. If the there are fewer than three noisy pixels in the level2.evt file, extra rows are filled as -1
| Pixel properties | Quadrant properties | ||||||
|---|---|---|---|---|---|---|---|
| Quadrant | DetID | PixID | Counts | Sigma | Mean | Median | Sigma |
| A | 10 | 83 | 1084598 | 4768.58 | 1111 | 1089 | 227.2 |
| A | 15 | 237 | 409570 | 1797.75 | 1111 | 1089 | 227.2 |
| A | 13 | 6 | 25480 | 107.35 | 1111 | 1089 | 227.2 |
| B | 0 | 189 | 244968 | 1162.66 | 1110 | 1080 | 209.8 |
| B | 0 | 199 | 186545 | 884.15 | 1110 | 1080 | 209.8 |
| B | 5 | 255 | 111343 | 525.65 | 1110 | 1080 | 209.8 |
| C | 15 | 214 | 423140 | 1673.03 | 1086 | 1091 | 252.3 |
| C | 2 | 16 | 303152 | 1197.39 | 1086 | 1091 | 252.3 |
| C | 3 | 233 | 139359 | 548.1 | 1086 | 1091 | 252.3 |
| D | 2 | 16 | 1121020 | 4311.98 | 1067 | 1035 | 259.7 |
| D | 1 | 52 | 800481 | 3077.89 | 1067 | 1035 | 259.7 |
| D | 13 | 249 | 651870 | 2505.74 | 1067 | 1035 | 259.7 |
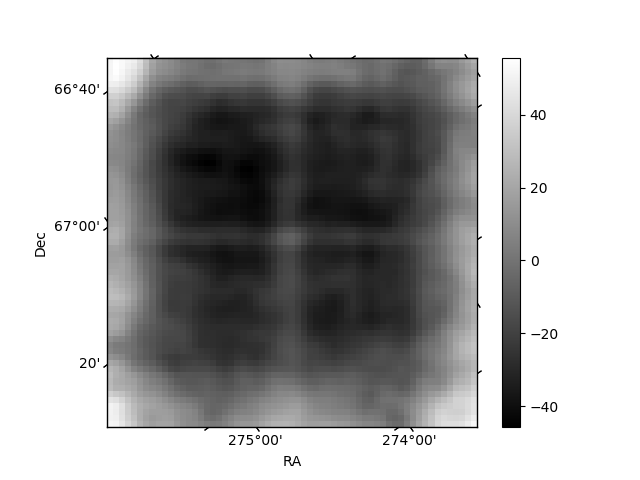
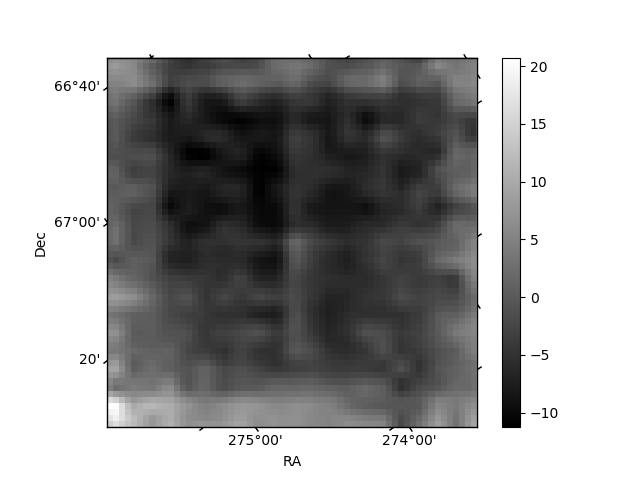
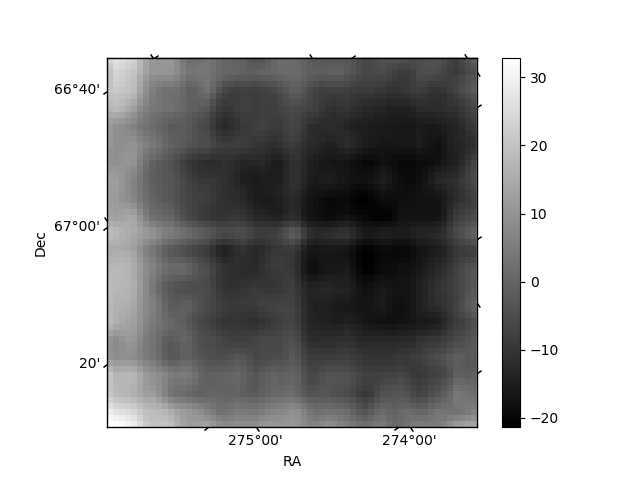
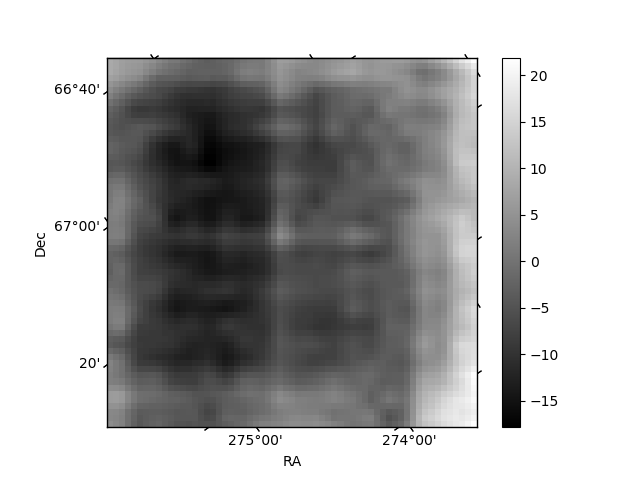
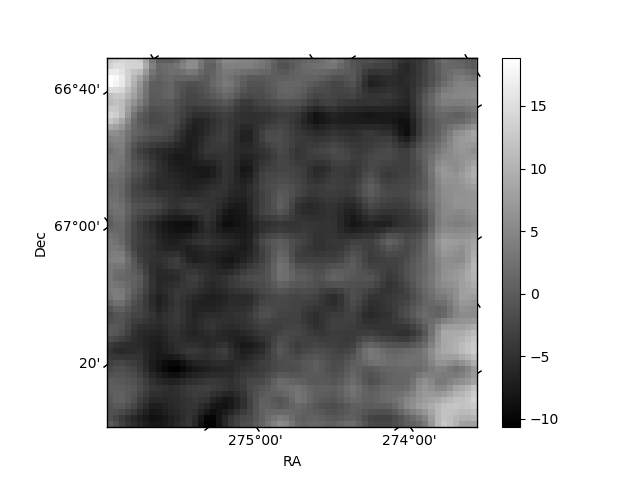
Histogram calculated using DETX and DETY for each event in the final _common_clean file
| Quadrant A | 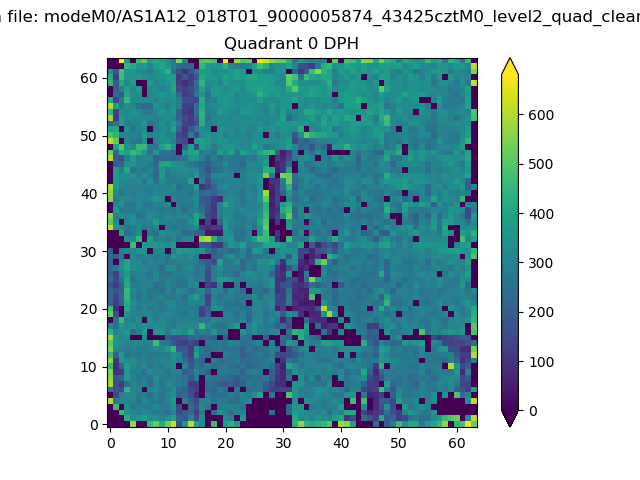 |
 |
Quadrant B |
|---|---|---|---|
| Quadrant D | 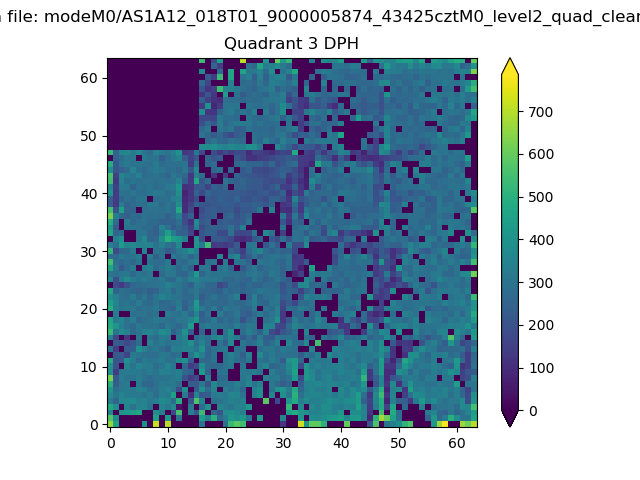 |
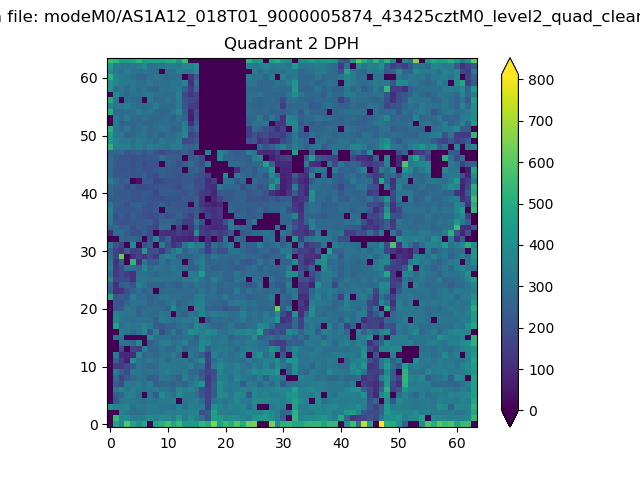 |
Quadrant C |
| Plot type | Count rate plots | Images |
|---|---|---|
| Comparison with Poisson distribution Blue bars denote a histogram of data divided into 1 sec bins. Red curve is a Poisson curve with rate = median count rate of data. |
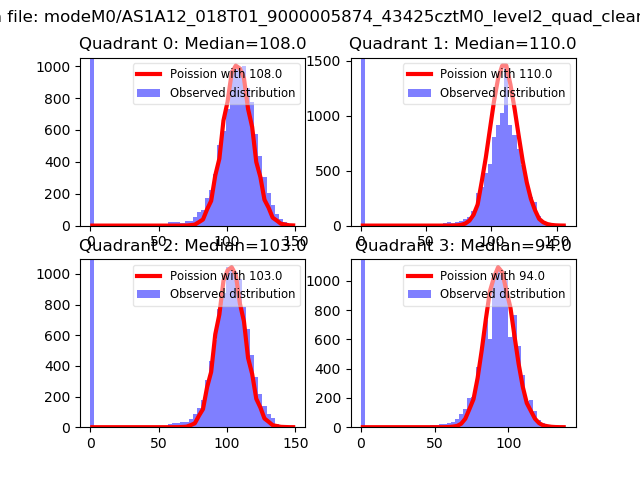 |
 |
| Quadrant-wise count rates Data is divided into 100 sec bins |
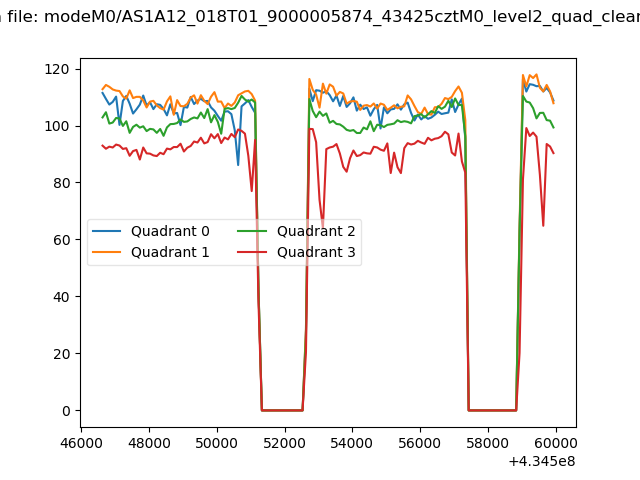 |
|
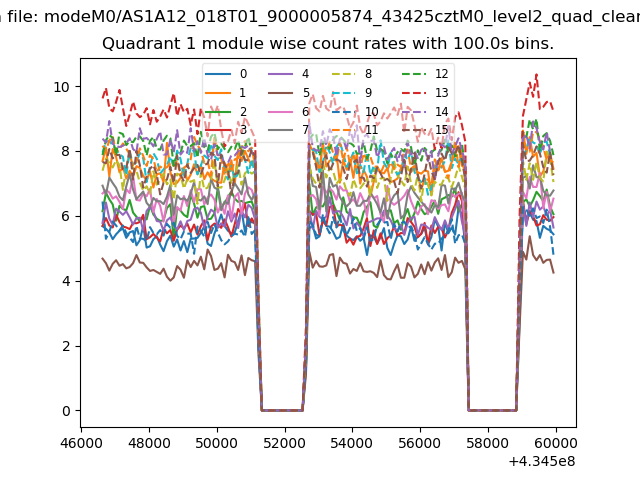
| Module-wise count rates for Quadrant A Data is divided into 100 sec bins |
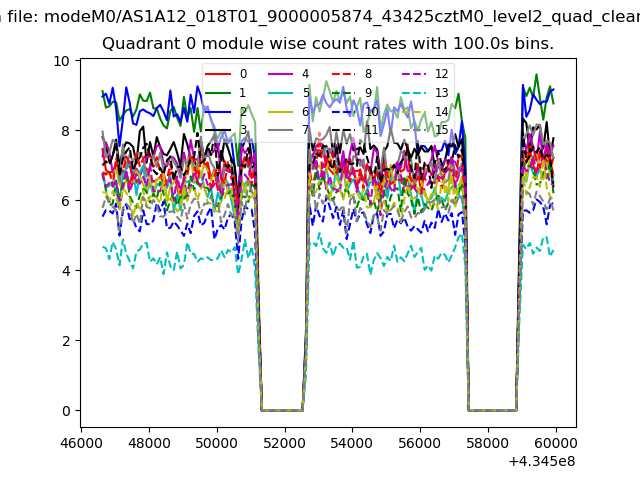 |
 |
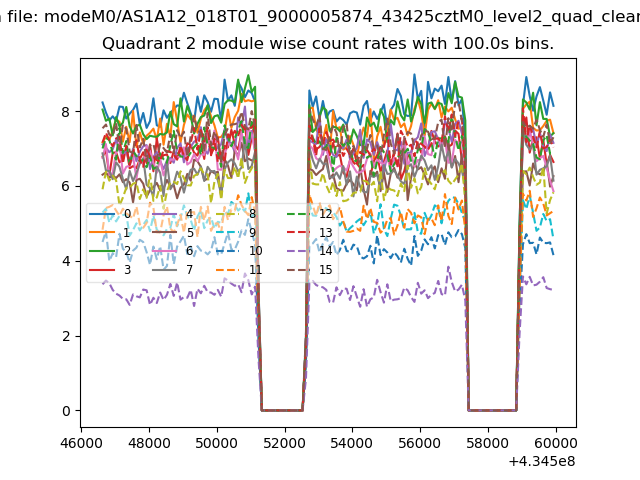
| Module-wise count rates for Quadrant B Data is divided into 100 sec bins |
 |
 |
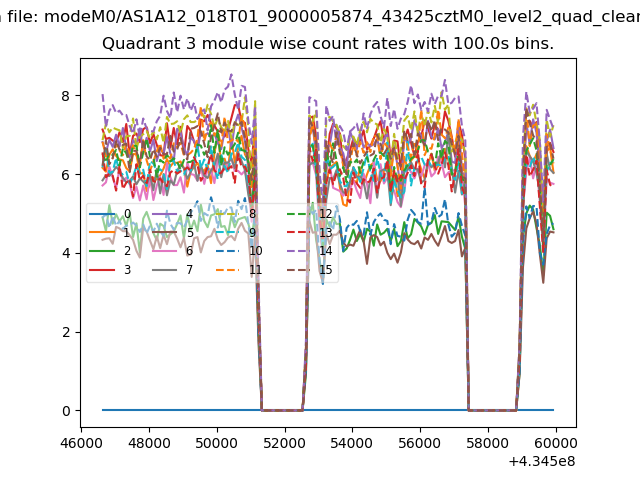
| Module-wise count rates for Quadrant C Data is divided into 100 sec bins |
 |
 |
| Module-wise count rates for Quadrant D Data is divided into 100 sec bins |
 |
 |
| Parameter | Plot |
|---|---|
| CZT HV Monitor | 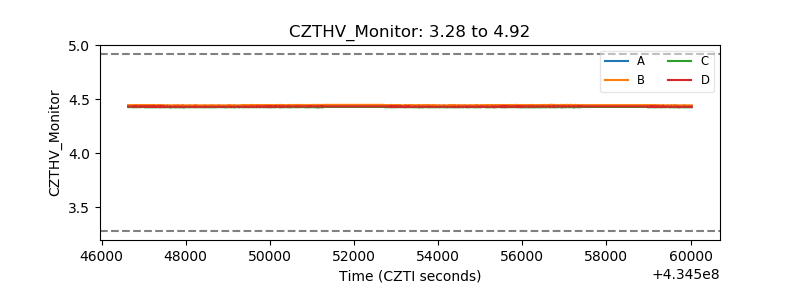 |
| D_VDD | 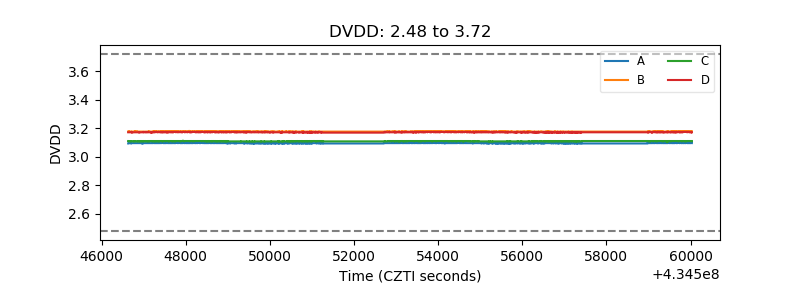 |
| Temperature 1 | 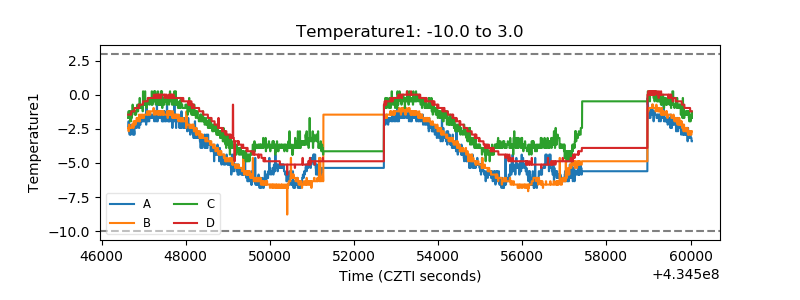 |
| Veto HV Monitor | 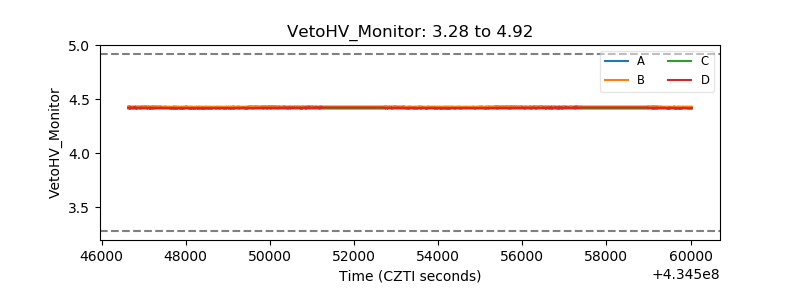 |
| Veto LLD | 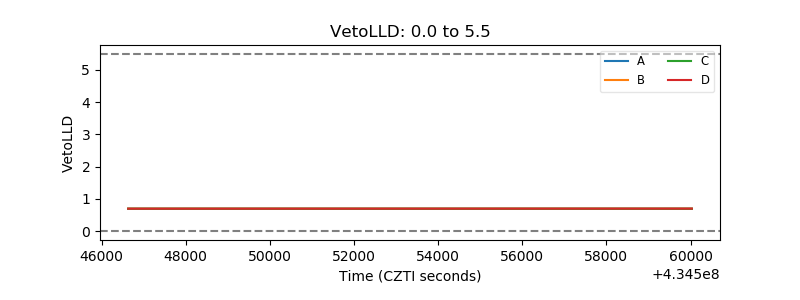 |
| Alpha Counter | 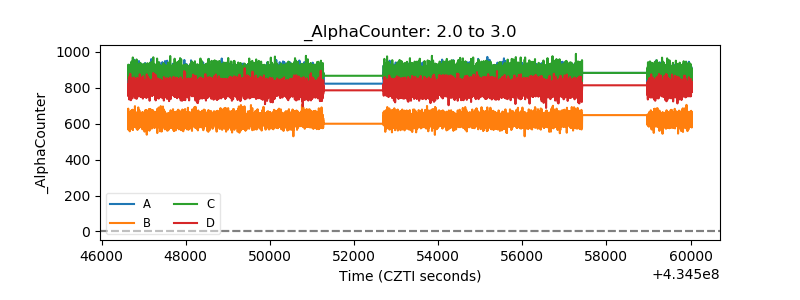 |
| _CPM_Rate | 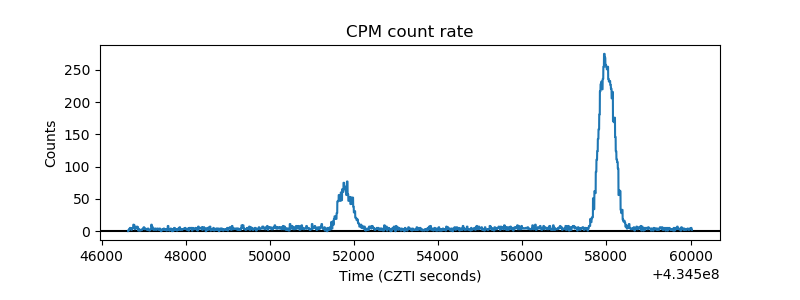 |
| CZT Counter | 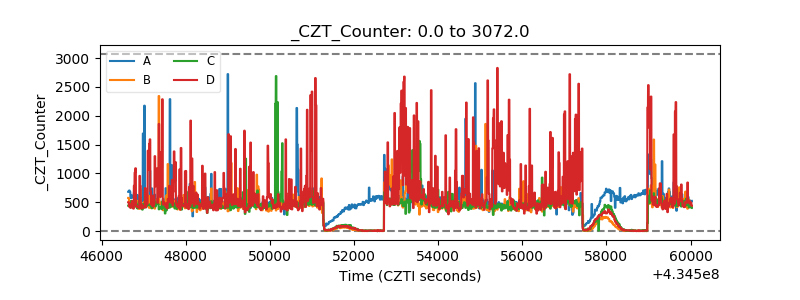 |
| +2.5 Volts monitor | 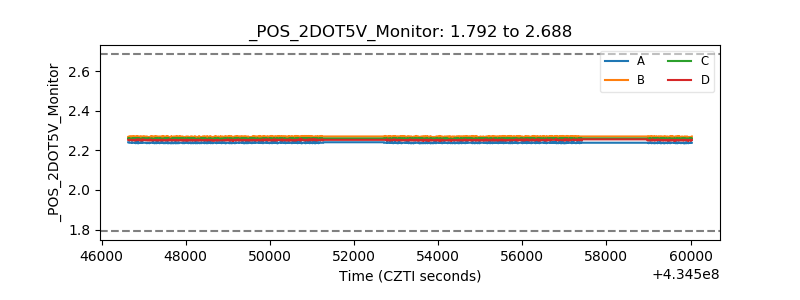 |
| +5 Volts monitor | 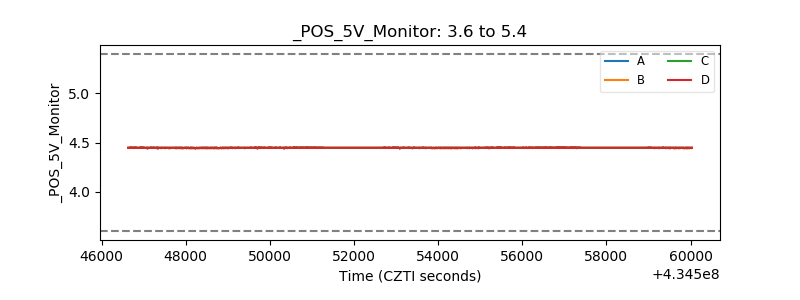 |
| _ROLL_ROT | 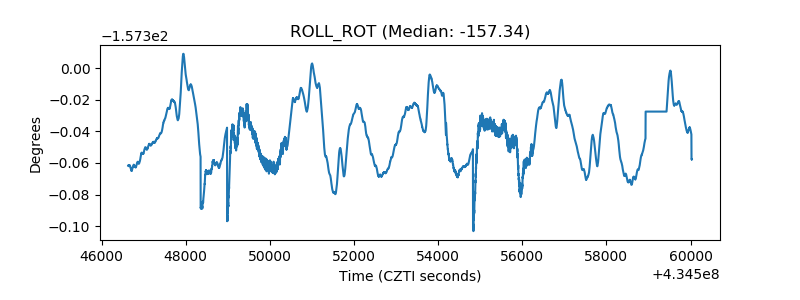 |
| _Roll_DEC | 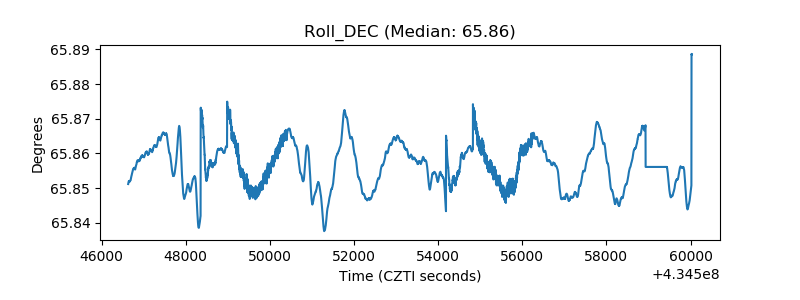 |
| _Roll_RA | 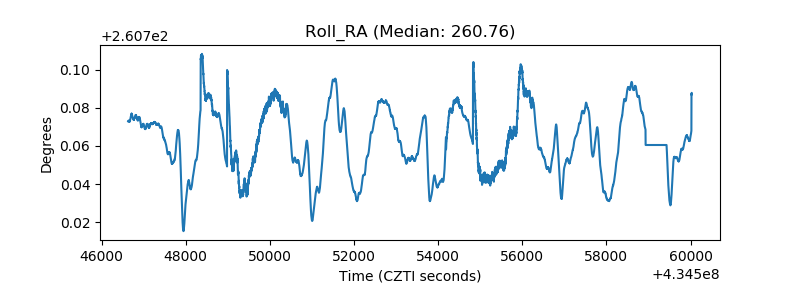 |
| Veto Counter | 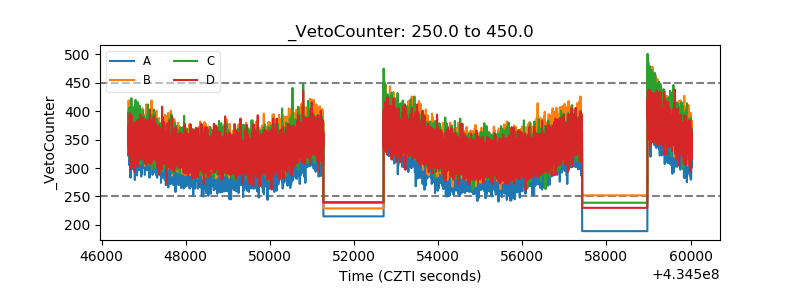 |