| Param | Original file | Final file |
|---|---|---|
| Filename | modeM0/AS1A12_018T01_9000005874_43428cztM0_level2.fits | modeM0/AS1A12_018T01_9000005874_43428cztM0_level2_quad_clean.evt |
| Size (bytes) | 1,355,276,160 | 338,382,720 |
| Size | 1.3 GB | 322.7 MB |
| Events in quadrant A | 12,290,608 | 2,274,050 |
| Events in quadrant B | 10,876,291 | 2,332,407 |
| Events in quadrant C | 10,119,074 | 2,208,885 |
| Events in quadrant D | 15,258,514 | 1,984,321 |
| Mode M0 | |||
|---|---|---|---|
| Quadrant | BADHDUFLAG | Total packets | Discarded packets |
| A | 0 | 49084 | 11 |
| B | 0 | 46639 | 8 |
| C | 0 | 43647 | 15 |
| D | 0 | 59737 | 11 |
| Mode M9 | |||
|---|---|---|---|
| Quadrant | BADHDUFLAG | Total packets | Discarded packets |
| A | 0 | 82 | 0 |
| B | 0 | 82 | 0 |
| C | 0 | 82 | 0 |
| D | 0 | 82 | 0 |
| Mode SS | |||
|---|---|---|---|
| Quadrant | BADHDUFLAG | Total packets | Discarded packets |
| A | 0 | 430 | 0 |
| B | 0 | 429 | 1 |
| C | 0 | 430 | 0 |
| D | 0 | 430 | 0 |
| Quadrant | Total seconds | Saturated seconds | Saturation percentage |
|---|---|---|---|
| A | 20988 | 349 | 1.662855% |
| B | 20992 | 219 | 1.043255% |
| C | 20986 | 46 | 0.219194% |
| D | 20988 | 859 | 4.092815% |
Noise dominated data is calculated using 1-second bins in cleaned event files. If a bin has >2000 counts, and if more than 50% of those come from <1% of pixels, then it is considered to be noise-dominated and hence unusable.
| Quadrant | # 1 sec bins | Bins with >0 counts | Bins with >2000 counts | High rate bins dominated by noise | Noise dominated (total time) | Noise dominated (detector-on time) | Marked lightcurve |
|---|---|---|---|---|---|---|---|
| A | 33544 | 20998 | 245 | 245 | 0.73% | 1.17% | 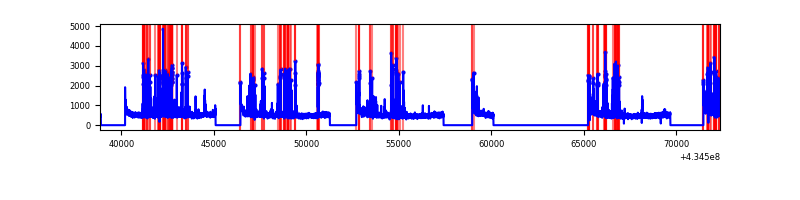 |
| B | 33545 | 20998 | 173 | 173 | 0.52% | 0.82% | 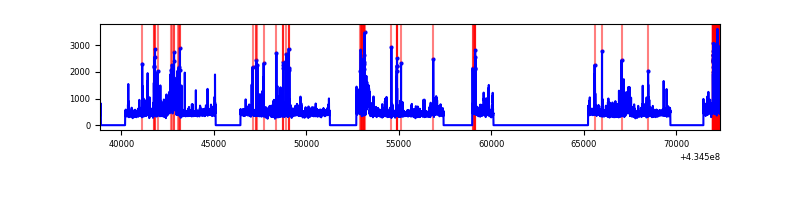 |
| C | 33545 | 20996 | 33 | 33 | 0.10% | 0.16% | 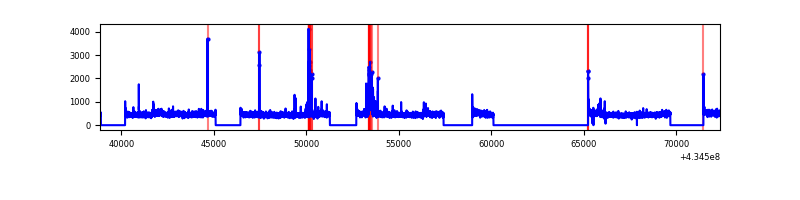 |
| D | 33545 | 20997 | 911 | 911 | 2.72% | 4.34% | 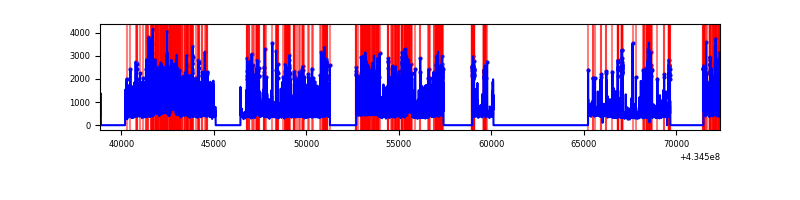 |
Top three noisy pixels from each quadrant. If the there are fewer than three noisy pixels in the level2.evt file, extra rows are filled as -1
| Pixel properties | Quadrant properties | ||||||
|---|---|---|---|---|---|---|---|
| Quadrant | DetID | PixID | Counts | Sigma | Mean | Median | Sigma |
| A | 10 | 83 | 2287130 | 5049.62 | 2238 | 2193 | 452.5 |
| A | 15 | 237 | 1100426 | 2427.05 | 2238 | 2193 | 452.5 |
| A | 13 | 248 | 103388 | 223.64 | 2238 | 2193 | 452.5 |
| B | 0 | 189 | 543634 | 1288.47 | 2241 | 2180 | 420.2 |
| B | 0 | 245 | 453006 | 1072.81 | 2241 | 2180 | 420.2 |
| B | 5 | 255 | 288890 | 682.27 | 2241 | 2180 | 420.2 |
| C | 15 | 214 | 857162 | 1674.9 | 2203 | 2212 | 510.4 |
| C | 2 | 16 | 324652 | 631.68 | 2203 | 2212 | 510.4 |
| C | 3 | 233 | 291691 | 567.11 | 2203 | 2212 | 510.4 |
| D | 2 | 16 | 2337923 | 4442.82 | 2167 | 2101 | 525.8 |
| D | 1 | 52 | 1926448 | 3660.18 | 2167 | 2101 | 525.8 |
| D | 13 | 249 | 854398 | 1621.1 | 2167 | 2101 | 525.8 |
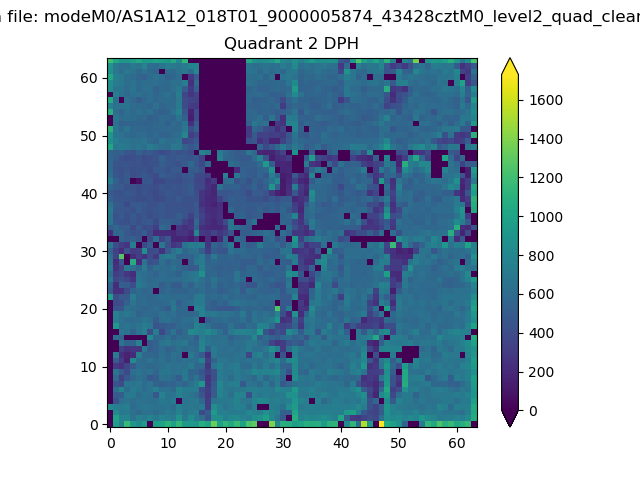
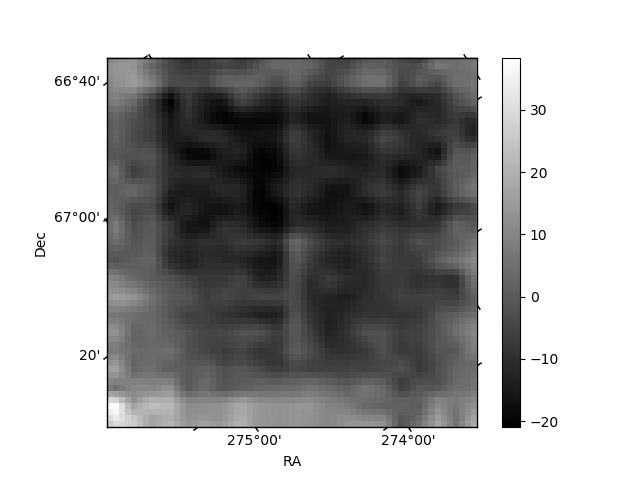
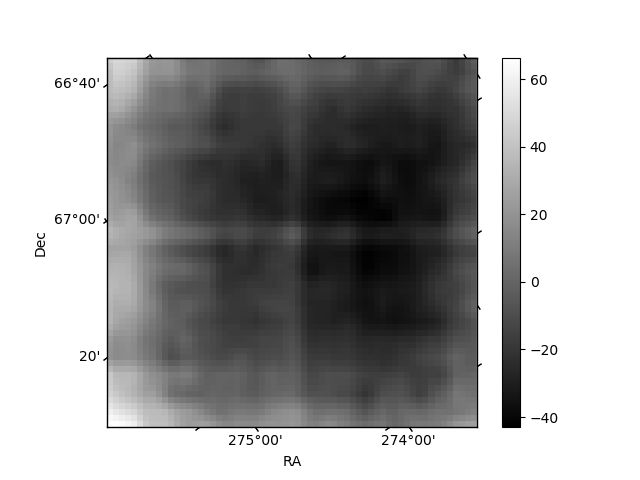
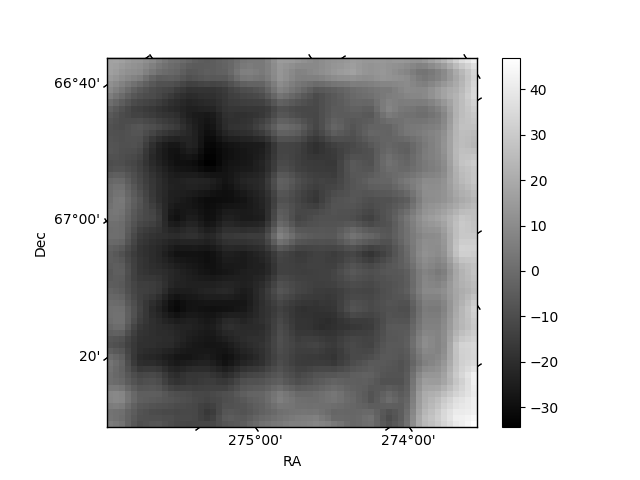
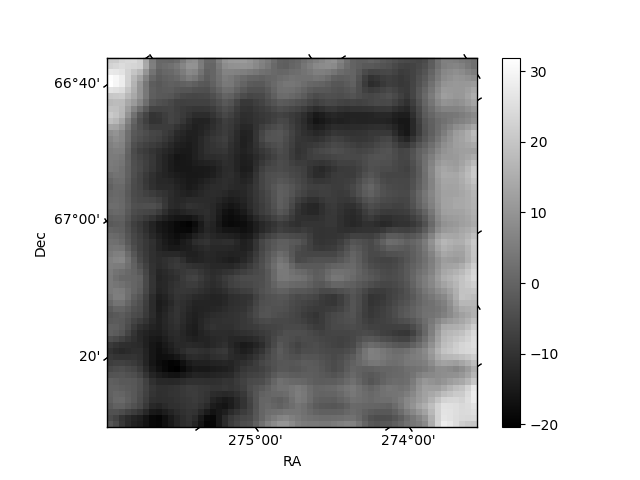
Histogram calculated using DETX and DETY for each event in the final _common_clean file
| Quadrant A | 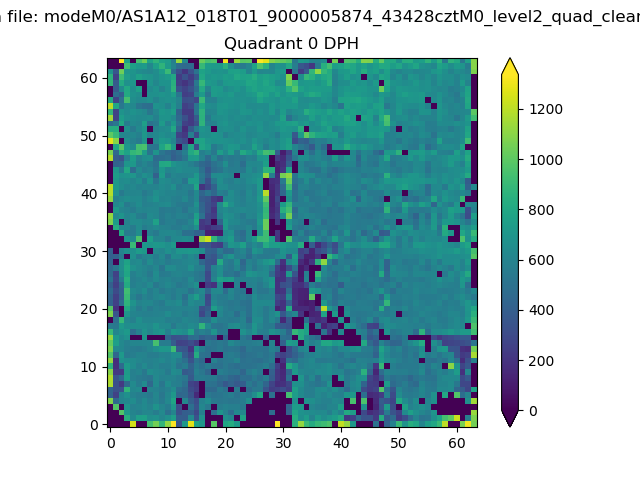 |
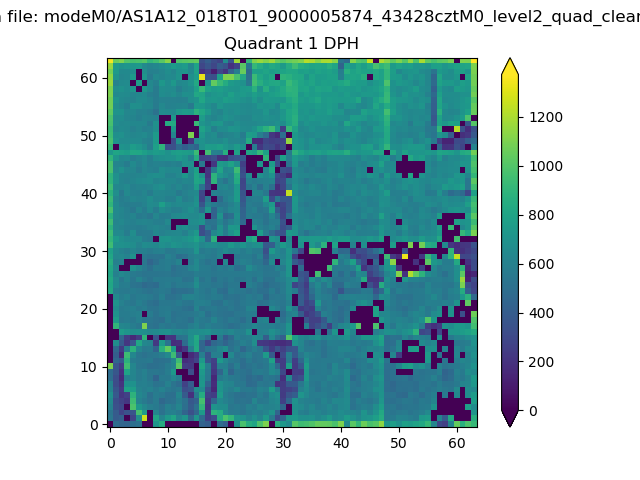 |
Quadrant B |
|---|---|---|---|
| Quadrant D | 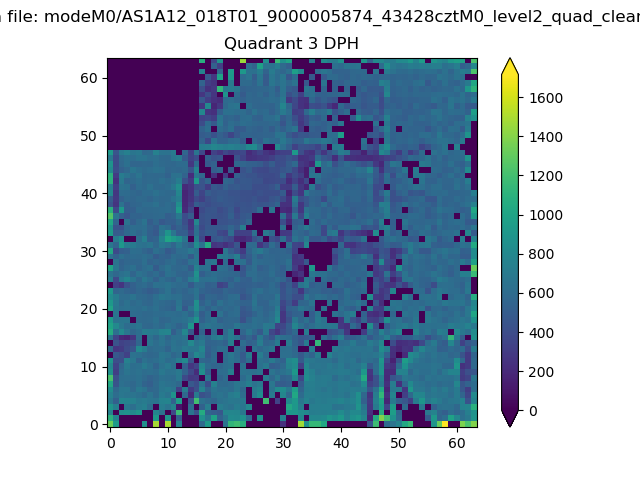 |
 |
Quadrant C |
| Plot type | Count rate plots | Images |
|---|---|---|
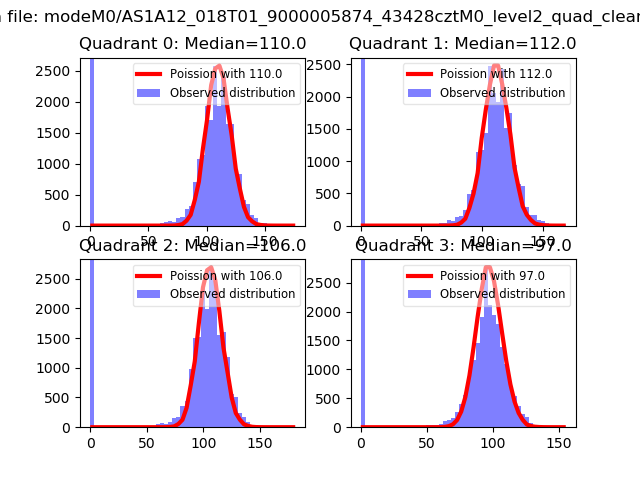
| Comparison with Poisson distribution Blue bars denote a histogram of data divided into 1 sec bins. Red curve is a Poisson curve with rate = median count rate of data. |
 |
 |
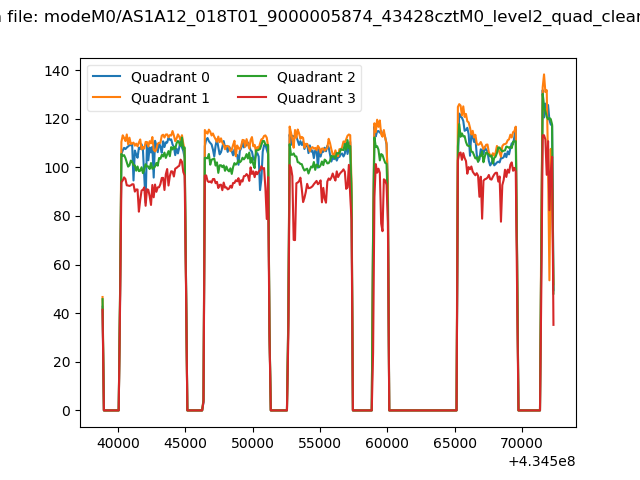
| Quadrant-wise count rates Data is divided into 100 sec bins |
 |
|
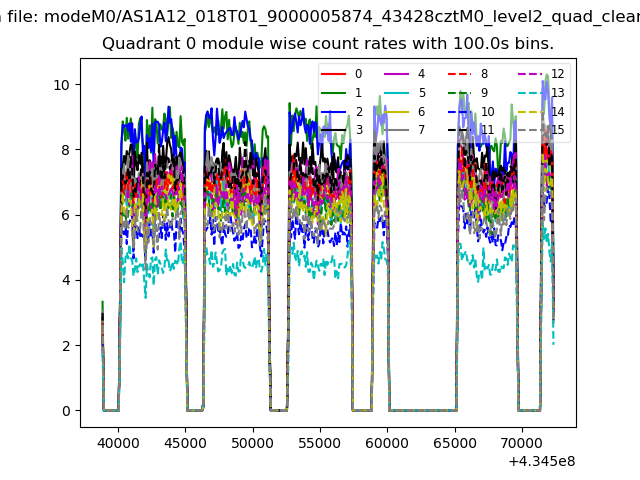
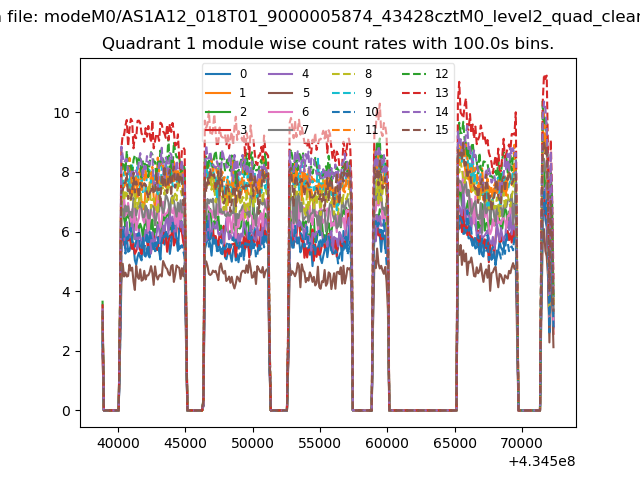
| Module-wise count rates for Quadrant A Data is divided into 100 sec bins |
 |
 |
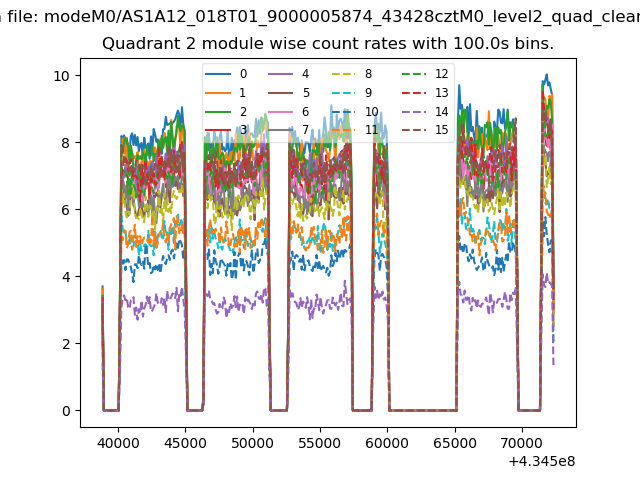
| Module-wise count rates for Quadrant B Data is divided into 100 sec bins |
 |
 |
| Module-wise count rates for Quadrant C Data is divided into 100 sec bins |
 |
 |
| Module-wise count rates for Quadrant D Data is divided into 100 sec bins |
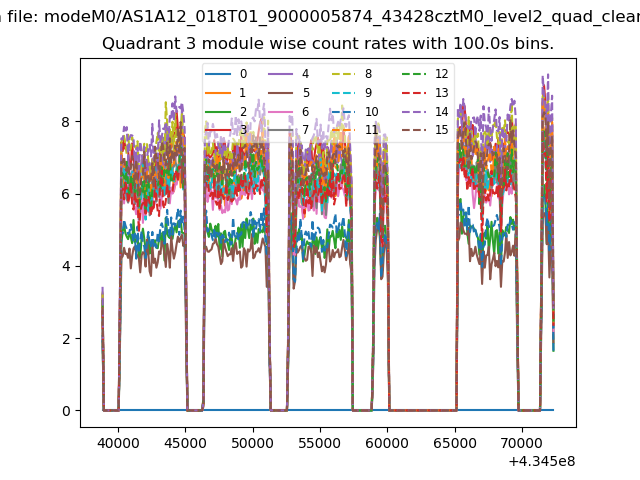 |
 |
| Parameter | Plot |
|---|---|
| CZT HV Monitor | 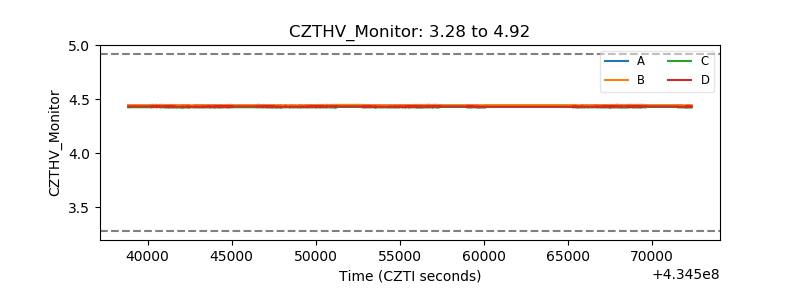 |
| D_VDD | 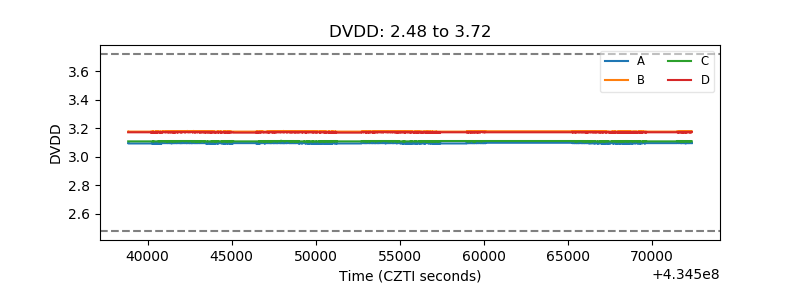 |
| Temperature 1 | 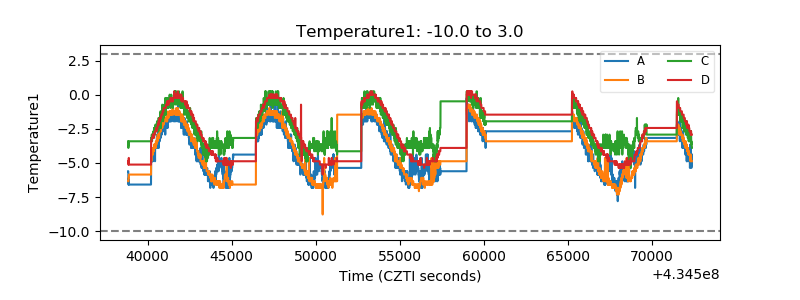 |
| Veto HV Monitor | 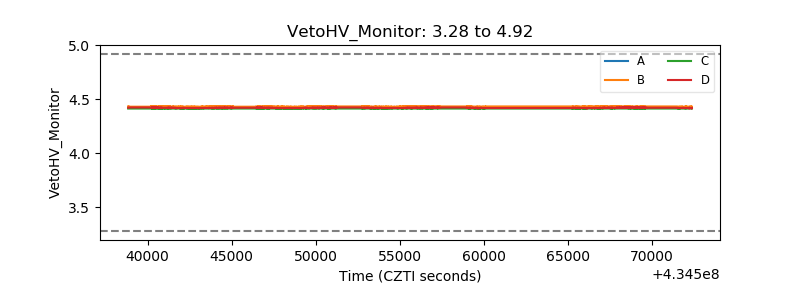 |
| Veto LLD | 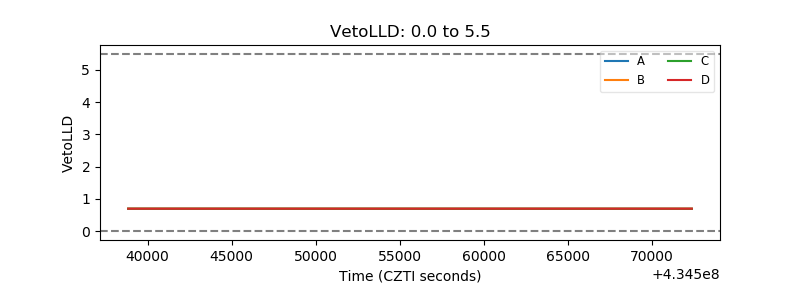 |
| Alpha Counter | 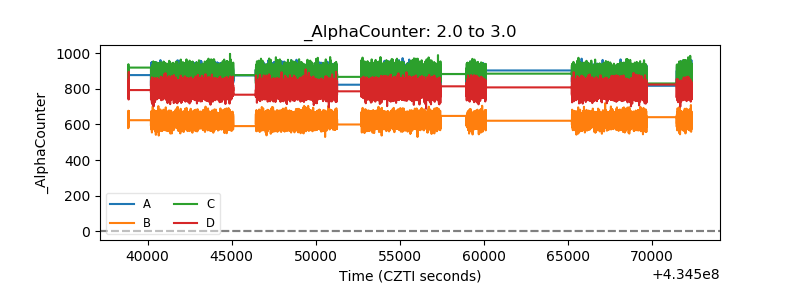 |
| _CPM_Rate | 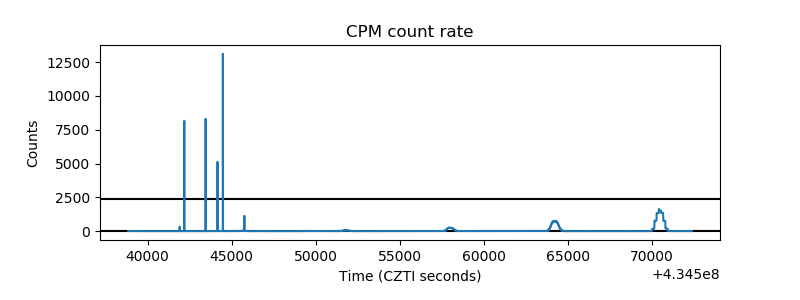 |
| CZT Counter | 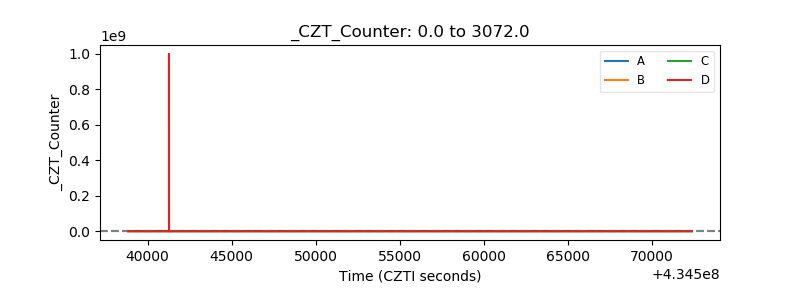 |
| +2.5 Volts monitor | 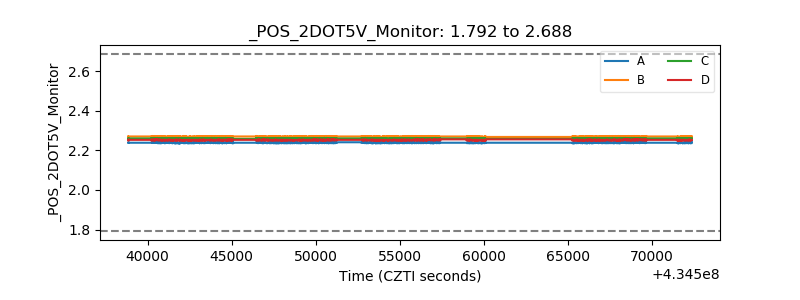 |
| +5 Volts monitor | 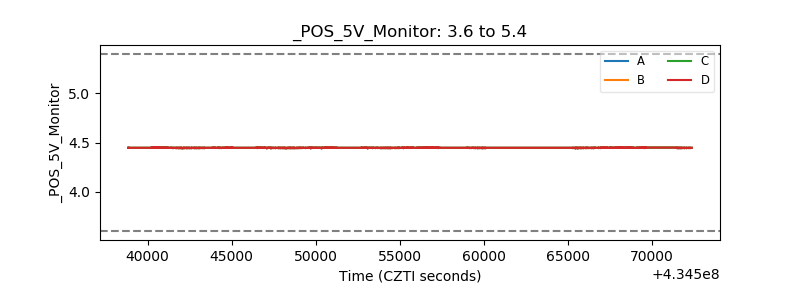 |
| _ROLL_ROT | 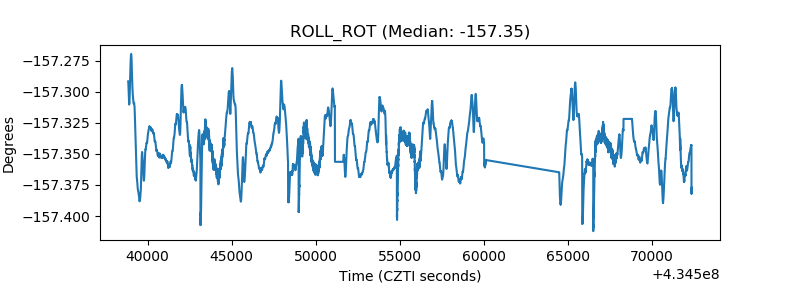 |
| _Roll_DEC |  |
| _Roll_RA | 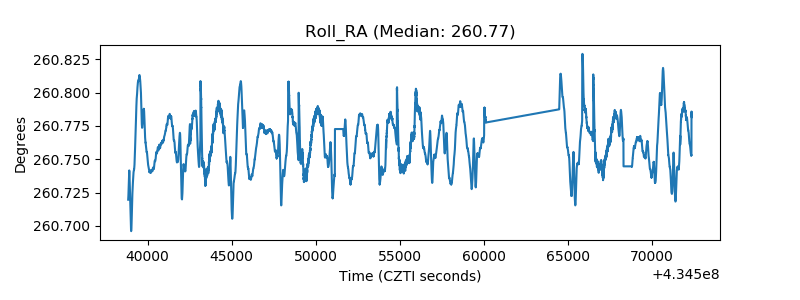 |
| Veto Counter | 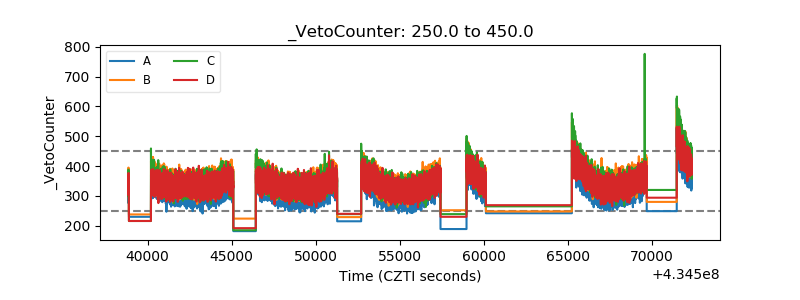 |