| Param | Original file | Final file |
|---|---|---|
| Filename | modeM0/AS1A12_018T01_9000005874_43431cztM0_level2.fits | modeM0/AS1A12_018T01_9000005874_43431cztM0_level2_quad_clean.evt |
| Size (bytes) | 297,921,600 | 83,243,520 |
| Size | 284.1 MB | 79.4 MB |
| Events in quadrant A | 2,767,985 | 556,108 |
| Events in quadrant B | 2,363,590 | 581,779 |
| Events in quadrant C | 2,302,837 | 555,942 |
| Events in quadrant D | 3,218,907 | 489,531 |
| Mode M0 | |||
|---|---|---|---|
| Quadrant | BADHDUFLAG | Total packets | Discarded packets |
| A | 0 | 11162 | 2 |
| B | 0 | 10297 | 2 |
| C | 0 | 9866 | 2 |
| D | 0 | 12968 | 2 |
| Mode M9 | |||
|---|---|---|---|
| Quadrant | BADHDUFLAG | Total packets | Discarded packets |
| A | 0 | 32 | 0 |
| B | 0 | 33 | 0 |
| C | 0 | 33 | 0 |
| D | 0 | 33 | 0 |
| Mode SS | |||
|---|---|---|---|
| Quadrant | BADHDUFLAG | Total packets | Discarded packets |
| A | 0 | 98 | 0 |
| B | 0 | 98 | 0 |
| C | 0 | 98 | 0 |
| D | 0 | 98 | 0 |
| Quadrant | Total seconds | Saturated seconds | Saturation percentage |
|---|---|---|---|
| A | 4805 | 55 | 1.144641% |
| B | 4805 | 22 | 0.457856% |
| C | 4805 | 3 | 0.062435% |
| D | 4805 | 194 | 4.037461% |
Noise dominated data is calculated using 1-second bins in cleaned event files. If a bin has >2000 counts, and if more than 50% of those come from <1% of pixels, then it is considered to be noise-dominated and hence unusable.
| Quadrant | # 1 sec bins | Bins with >0 counts | Bins with >2000 counts | High rate bins dominated by noise | Noise dominated (total time) | Noise dominated (detector-on time) | Marked lightcurve |
|---|---|---|---|---|---|---|---|
| A | 6928 | 4806 | 36 | 36 | 0.52% | 0.75% | 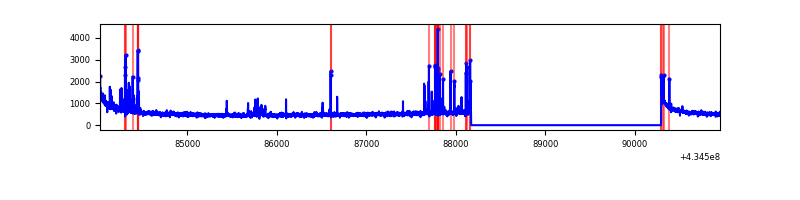 |
| B | 6928 | 4806 | 11 | 11 | 0.16% | 0.23% | 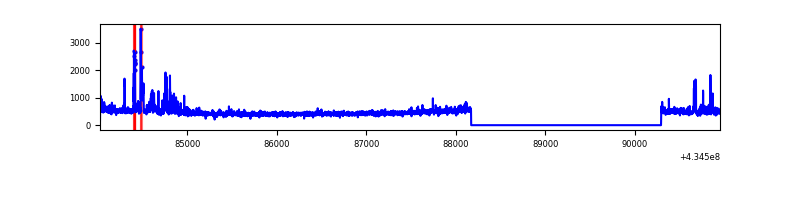 |
| C | 6928 | 4806 | 0 | 0 | 0.00% | 0.00% | 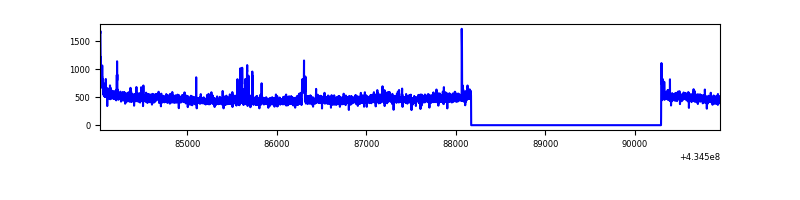 |
| D | 6928 | 4806 | 180 | 180 | 2.60% | 3.75% | 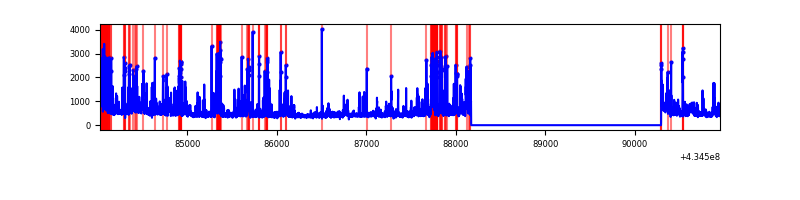 |
Top three noisy pixels from each quadrant. If the there are fewer than three noisy pixels in the level2.evt file, extra rows are filled as -1
| Pixel properties | Quadrant properties | ||||||
|---|---|---|---|---|---|---|---|
| Quadrant | DetID | PixID | Counts | Sigma | Mean | Median | Sigma |
| A | 10 | 83 | 539982 | 5084.41 | 520 | 510 | 106.1 |
| A | 15 | 237 | 168586 | 1584.08 | 520 | 510 | 106.1 |
| A | 7 | 3 | 23929 | 220.72 | 520 | 510 | 106.1 |
| B | 0 | 189 | 172931 | 1719.82 | 526 | 514 | 100.3 |
| B | 5 | 255 | 47488 | 468.55 | 526 | 514 | 100.3 |
| B | 15 | 35 | 24343 | 237.69 | 526 | 514 | 100.3 |
| C | 15 | 214 | 201033 | 1691.43 | 515 | 520 | 118.5 |
| C | 3 | 233 | 42722 | 356.0 | 515 | 520 | 118.5 |
| C | 0 | 207 | 39619 | 329.82 | 515 | 520 | 118.5 |
| D | 1 | 52 | 504525 | 4129.59 | 499 | 485 | 122.1 |
| D | 12 | 6 | 223728 | 1829.02 | 499 | 485 | 122.1 |
| D | 1 | 47 | 191618 | 1565.95 | 499 | 485 | 122.1 |
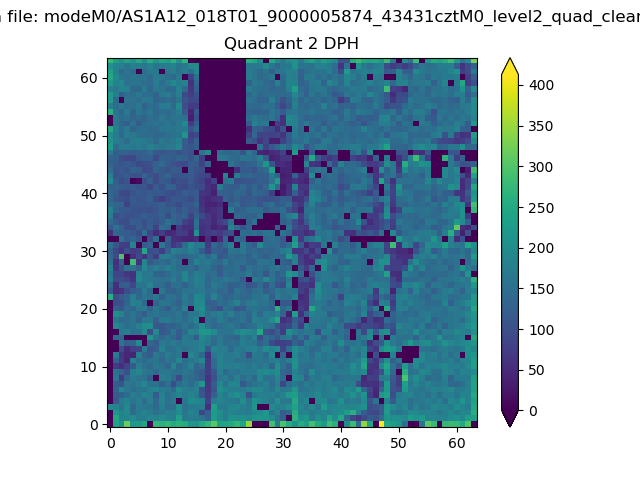
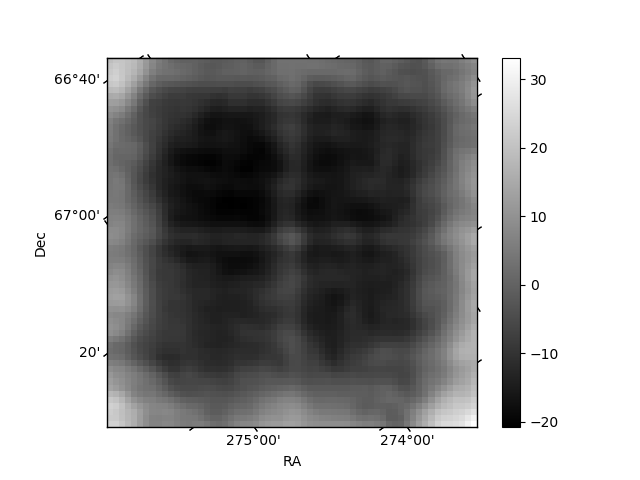
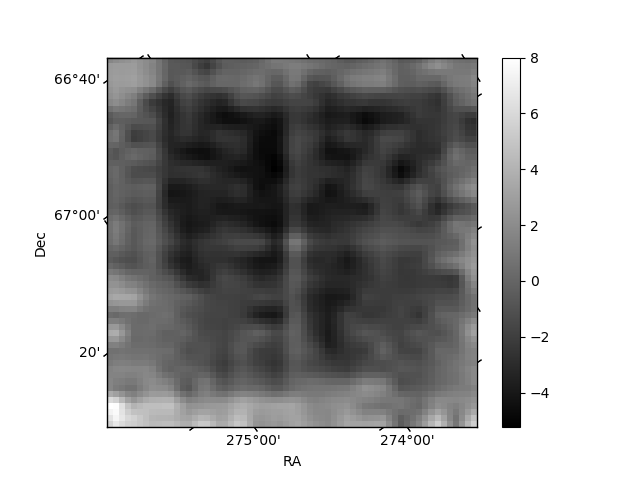
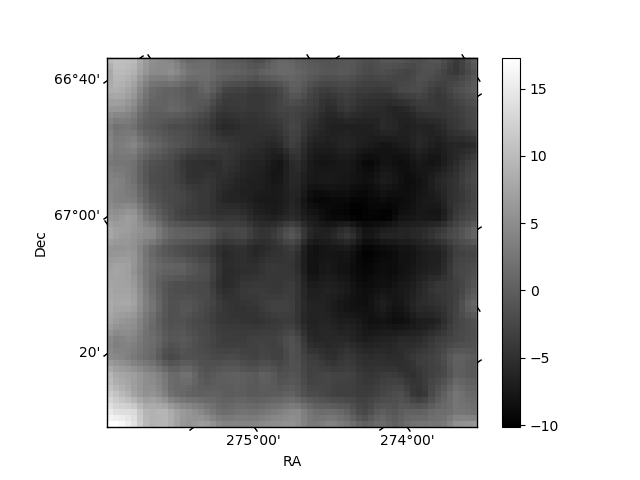
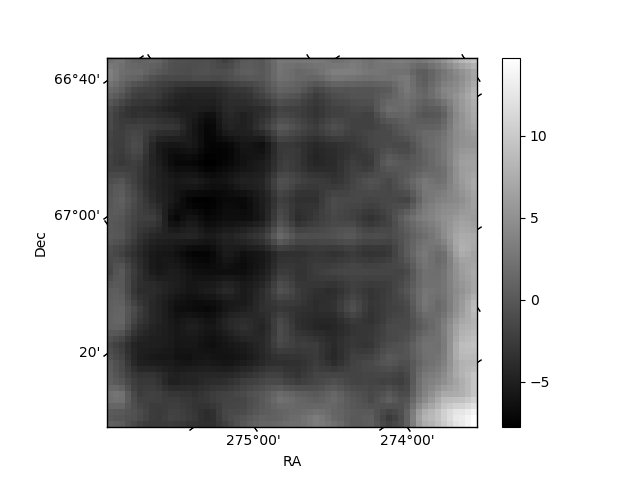
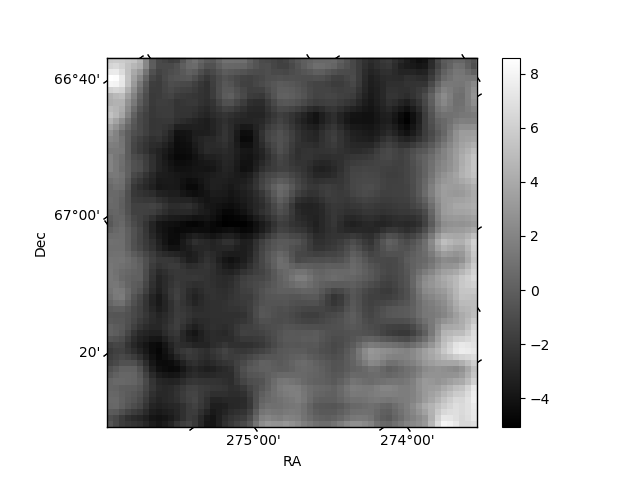
Histogram calculated using DETX and DETY for each event in the final _common_clean file
| Quadrant A | 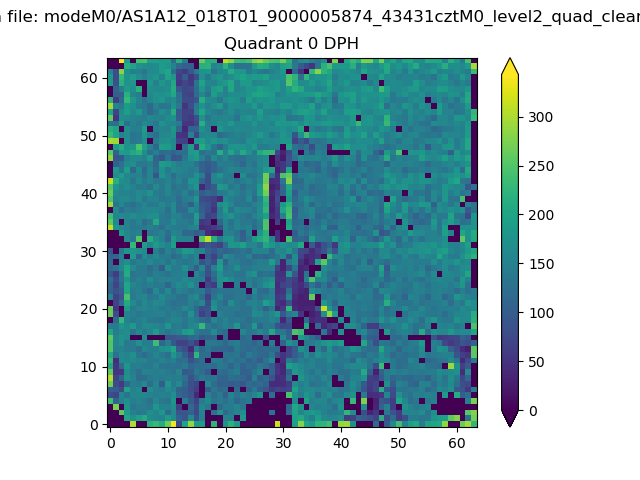 |
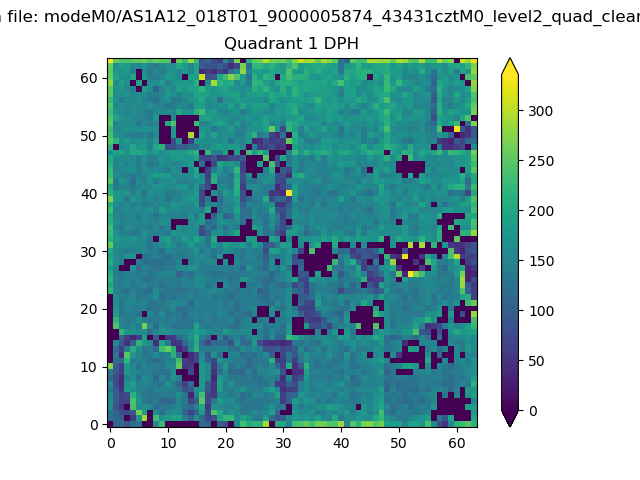 |
Quadrant B |
|---|---|---|---|
| Quadrant D | 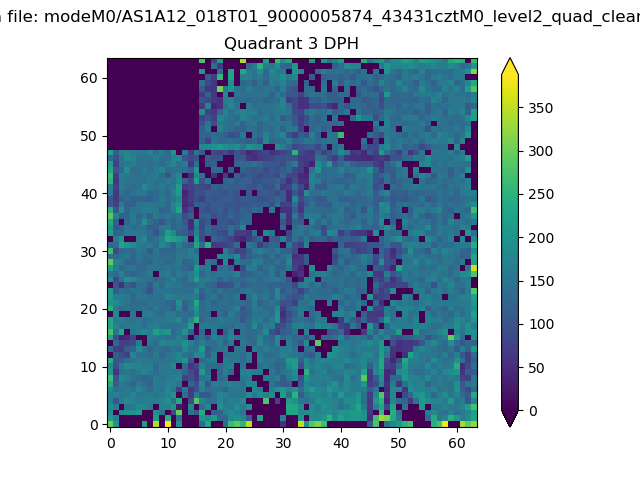 |
 |
Quadrant C |
| Plot type | Count rate plots | Images |
|---|---|---|
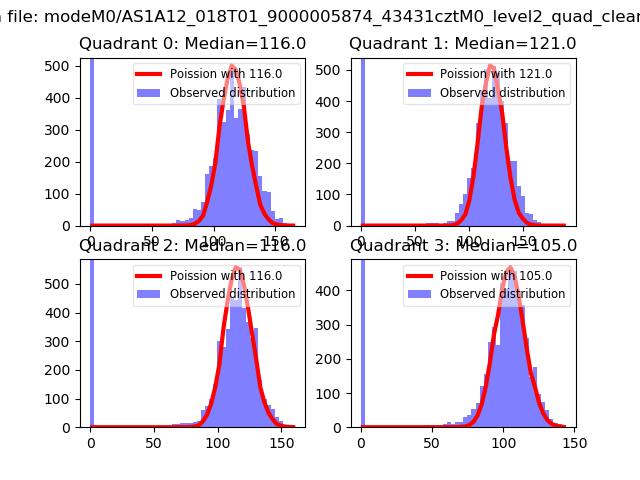
| Comparison with Poisson distribution Blue bars denote a histogram of data divided into 1 sec bins. Red curve is a Poisson curve with rate = median count rate of data. |
 |
 |
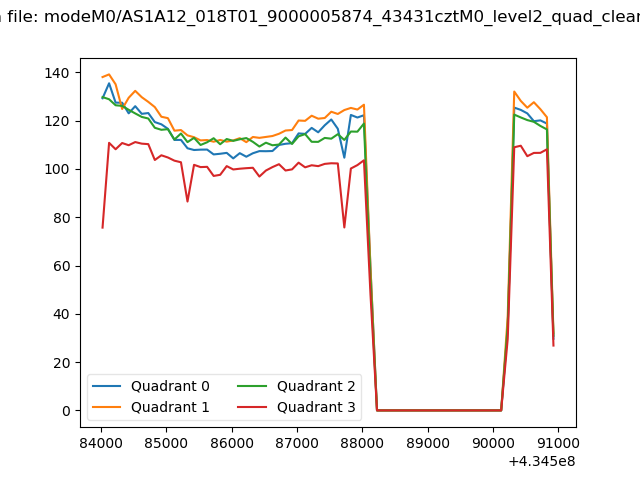
| Quadrant-wise count rates Data is divided into 100 sec bins |
 |
|
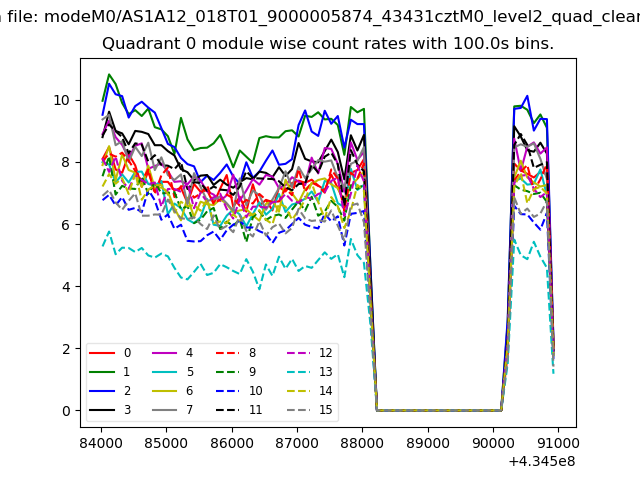
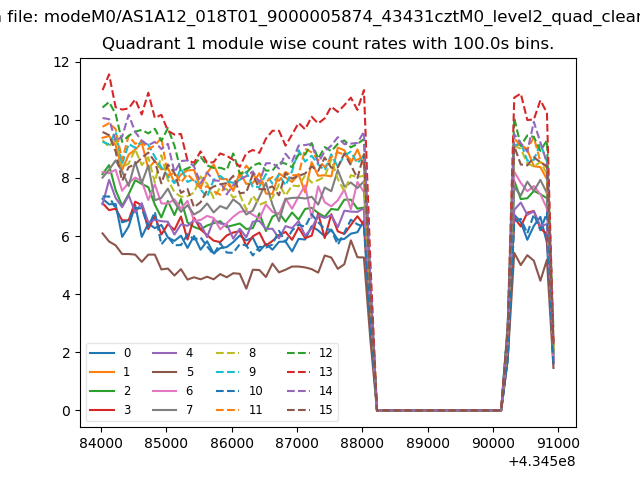
| Module-wise count rates for Quadrant A Data is divided into 100 sec bins |
 |
 |
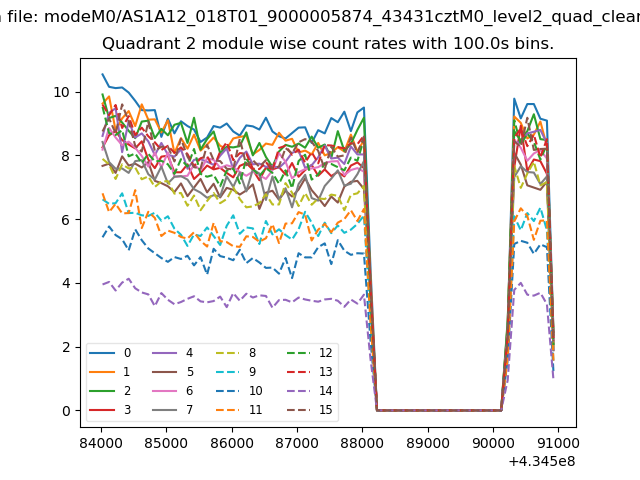
| Module-wise count rates for Quadrant B Data is divided into 100 sec bins |
 |
 |
| Module-wise count rates for Quadrant C Data is divided into 100 sec bins |
 |
 |
| Module-wise count rates for Quadrant D Data is divided into 100 sec bins |
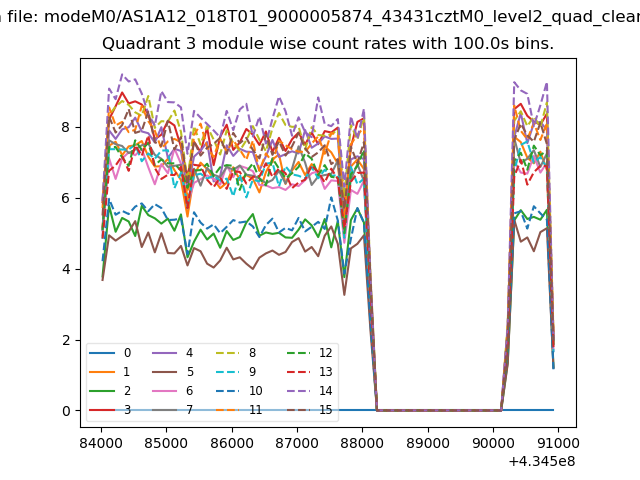 |
 |
| Parameter | Plot |
|---|---|
| CZT HV Monitor | 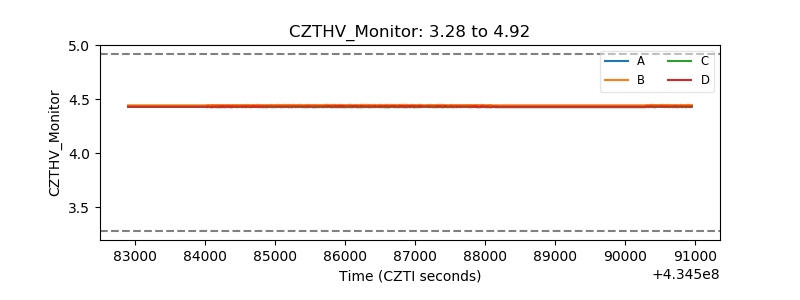 |
| D_VDD | 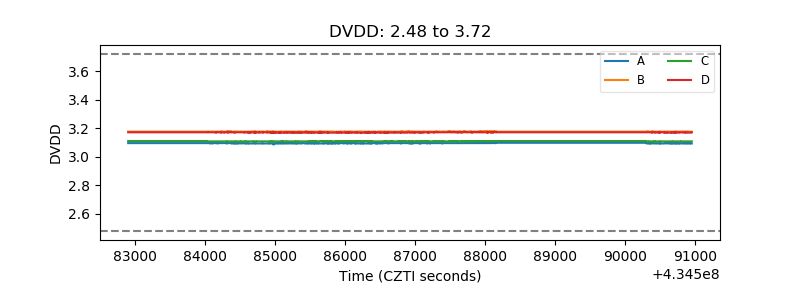 |
| Temperature 1 | 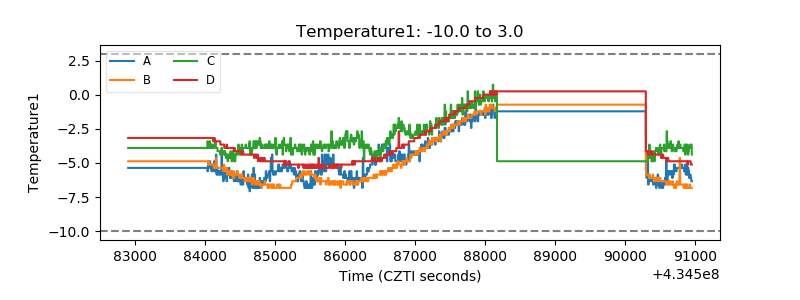 |
| Veto HV Monitor | 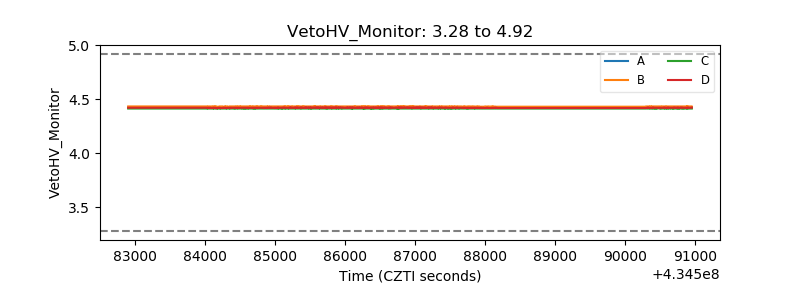 |
| Veto LLD | 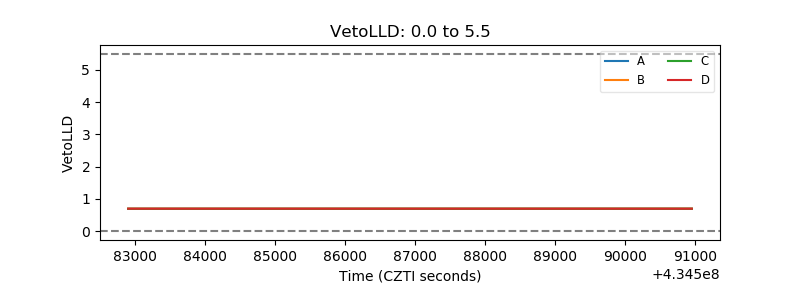 |
| Alpha Counter | 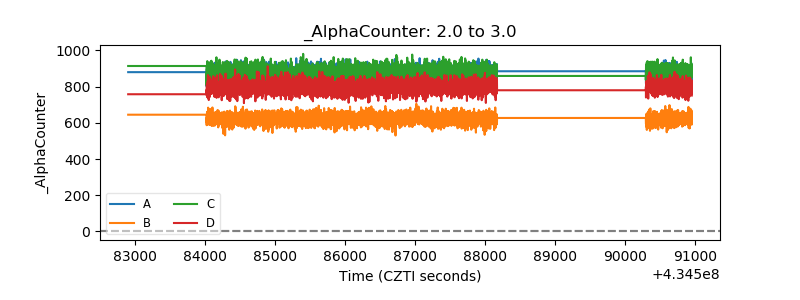 |
| _CPM_Rate | 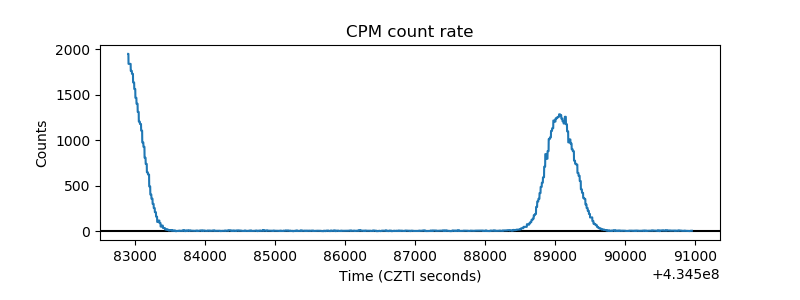 |
| CZT Counter | 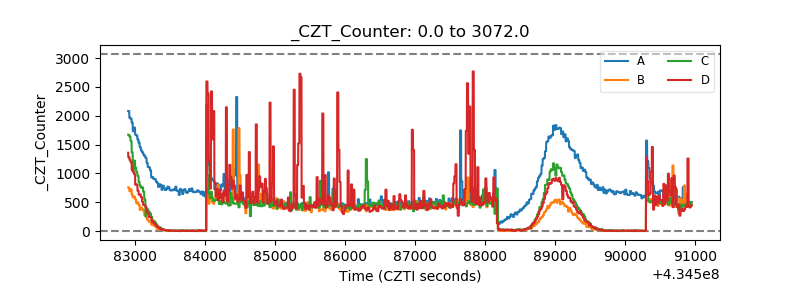 |
| +2.5 Volts monitor | 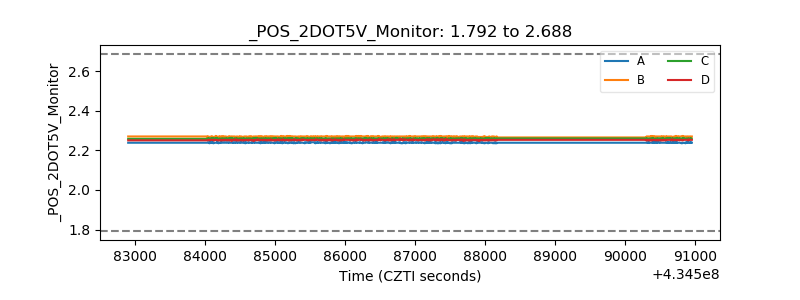 |
| +5 Volts monitor | 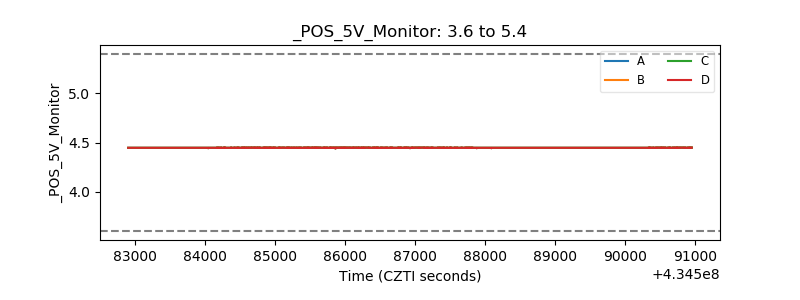 |
| _ROLL_ROT | 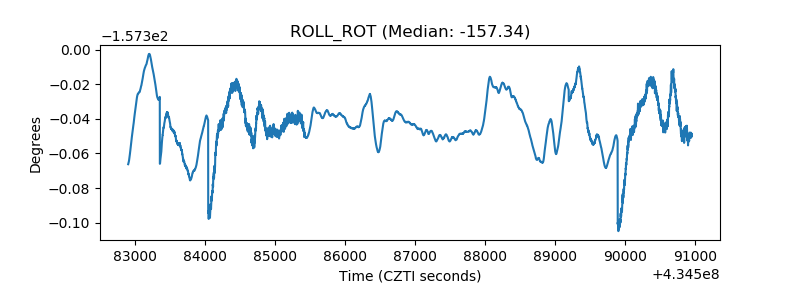 |
| _Roll_DEC | 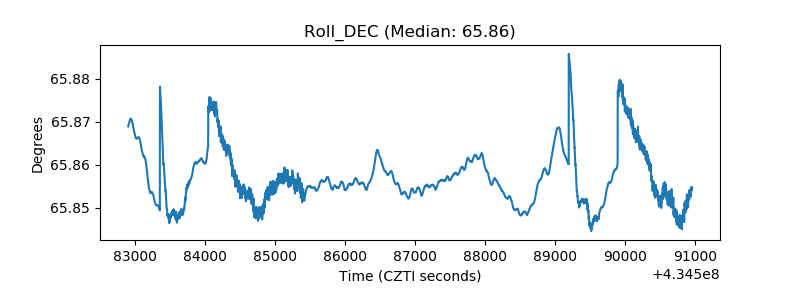 |
| _Roll_RA | 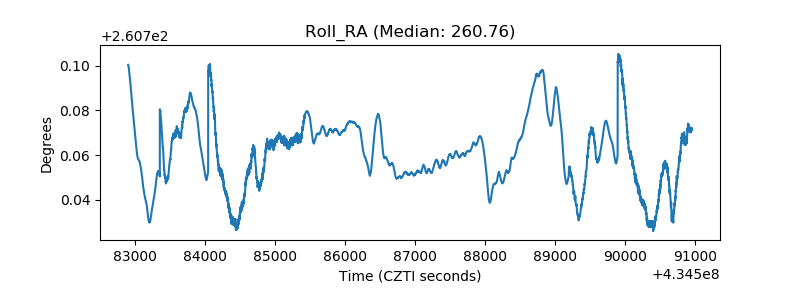 |
| Veto Counter | 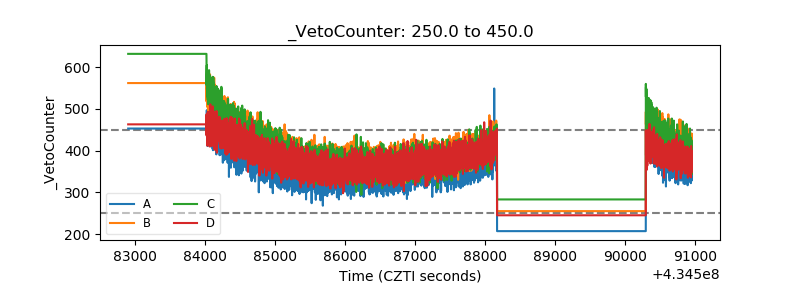 |