| Param | Original file | Final file |
|---|---|---|
| Filename | modeM0/AS1A12_018T01_9000005874_43433cztM0_level2.fits | modeM0/AS1A12_018T01_9000005874_43433cztM0_level2_quad_clean.evt |
| Size (bytes) | 340,833,600 | 83,592,000 |
| Size | 325.0 MB | 79.7 MB |
| Events in quadrant A | 2,860,187 | 556,492 |
| Events in quadrant B | 2,391,156 | 577,307 |
| Events in quadrant C | 2,422,466 | 554,237 |
| Events in quadrant D | 4,539,457 | 480,335 |
| Mode M0 | |||
|---|---|---|---|
| Quadrant | BADHDUFLAG | Total packets | Discarded packets |
| A | 0 | 11718 | 2 |
| B | 0 | 10841 | 2 |
| C | 0 | 10555 | 2 |
| D | 0 | 17279 | 2 |
| Mode M9 | |||
|---|---|---|---|
| Quadrant | BADHDUFLAG | Total packets | Discarded packets |
| A | 0 | 34 | 0 |
| B | 0 | 35 | 0 |
| C | 0 | 35 | 0 |
| D | 0 | 35 | 0 |
| Mode SS | |||
|---|---|---|---|
| Quadrant | BADHDUFLAG | Total packets | Discarded packets |
| A | 0 | 106 | 0 |
| B | 0 | 106 | 0 |
| C | 0 | 106 | 0 |
| D | 0 | 106 | 0 |
| Quadrant | Total seconds | Saturated seconds | Saturation percentage |
|---|---|---|---|
| A | 5177 | 52 | 1.004443% |
| B | 5177 | 25 | 0.482905% |
| C | 5177 | 7 | 0.135213% |
| D | 5177 | 403 | 7.784431% |
Noise dominated data is calculated using 1-second bins in cleaned event files. If a bin has >2000 counts, and if more than 50% of those come from <1% of pixels, then it is considered to be noise-dominated and hence unusable.
| Quadrant | # 1 sec bins | Bins with >0 counts | Bins with >2000 counts | High rate bins dominated by noise | Noise dominated (total time) | Noise dominated (detector-on time) | Marked lightcurve |
|---|---|---|---|---|---|---|---|
| A | 7180 | 5178 | 35 | 35 | 0.49% | 0.68% | 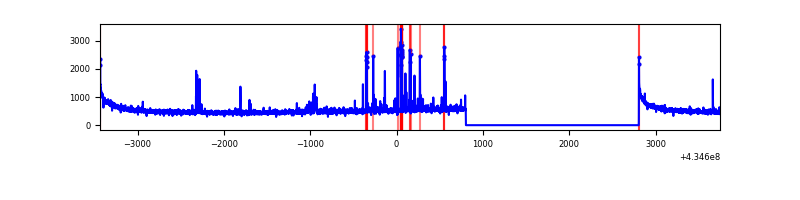 |
| B | 7180 | 5178 | 13 | 13 | 0.18% | 0.25% | 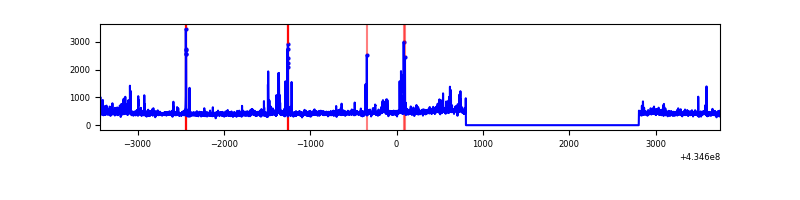 |
| C | 7180 | 5178 | 1 | 1 | 0.01% | 0.02% | 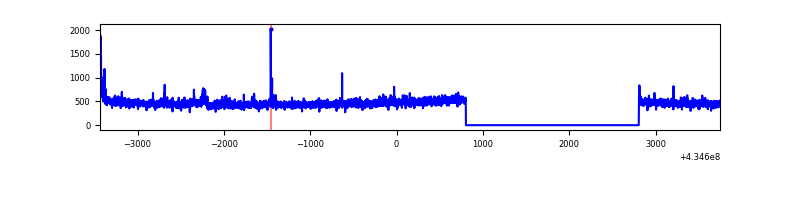 |
| D | 7180 | 5177 | 432 | 432 | 6.02% | 8.34% | 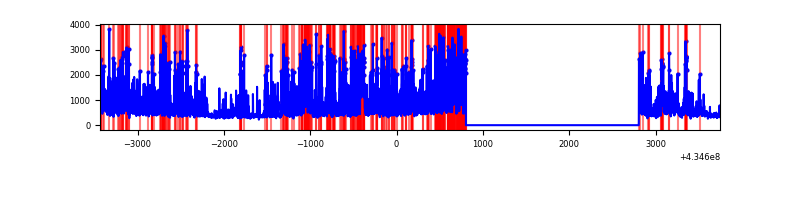 |
Top three noisy pixels from each quadrant. If the there are fewer than three noisy pixels in the level2.evt file, extra rows are filled as -1
| Pixel properties | Quadrant properties | ||||||
|---|---|---|---|---|---|---|---|
| Quadrant | DetID | PixID | Counts | Sigma | Mean | Median | Sigma |
| A | 10 | 83 | 569329 | 5127.0 | 544 | 534 | 110.9 |
| A | 15 | 237 | 133992 | 1202.96 | 544 | 534 | 110.9 |
| A | 13 | 248 | 32669 | 289.66 | 544 | 534 | 110.9 |
| B | 0 | 189 | 96249 | 915.7 | 544 | 529 | 104.5 |
| B | 0 | 245 | 46669 | 441.4 | 544 | 529 | 104.5 |
| B | 0 | 186 | 28974 | 272.12 | 544 | 529 | 104.5 |
| C | 15 | 214 | 218307 | 1754.19 | 530 | 530 | 124.1 |
| C | 3 | 233 | 84031 | 672.6 | 530 | 530 | 124.1 |
| C | 0 | 207 | 47469 | 378.09 | 530 | 530 | 124.1 |
| D | 1 | 52 | 1608365 | 12798.1 | 511 | 495 | 125.6 |
| D | 2 | 16 | 406933 | 3235.11 | 511 | 495 | 125.6 |
| D | 13 | 249 | 217750 | 1729.28 | 511 | 495 | 125.6 |
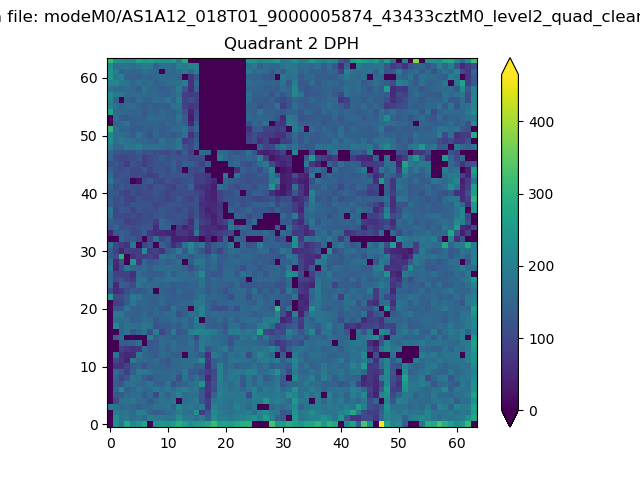
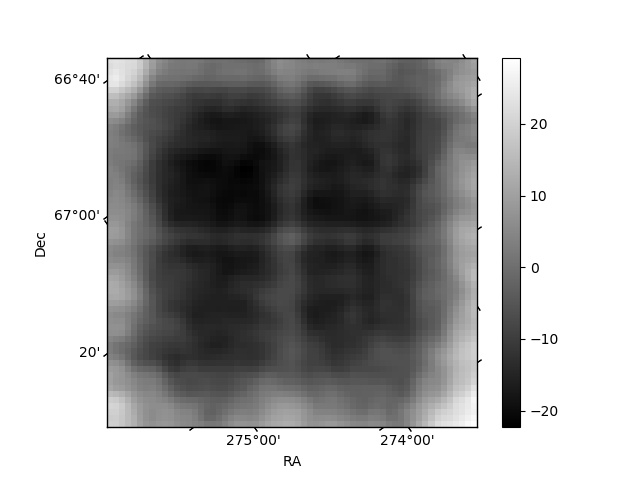
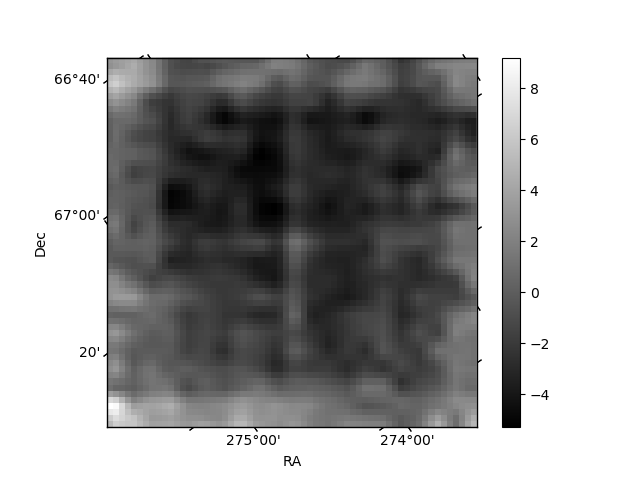
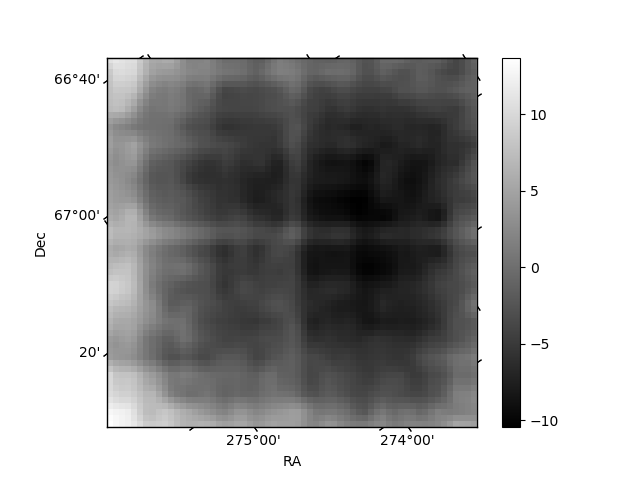
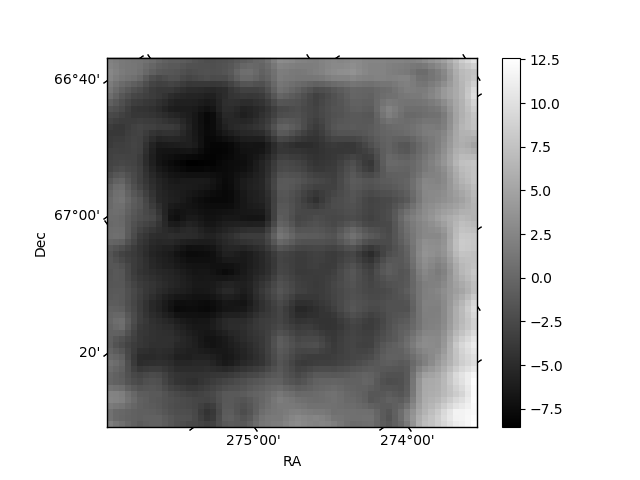
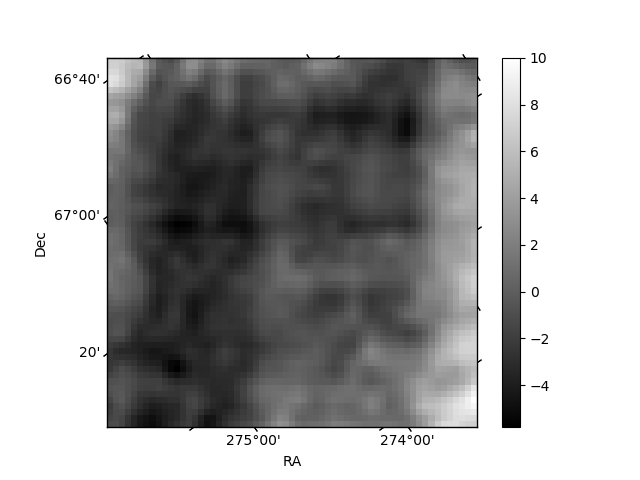
Histogram calculated using DETX and DETY for each event in the final _common_clean file
| Quadrant A | 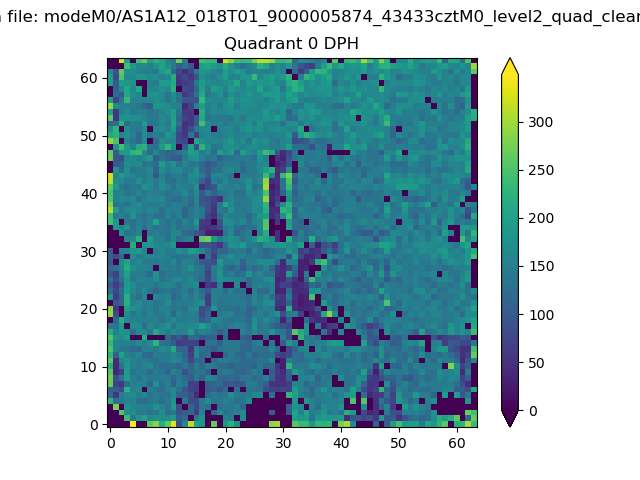 |
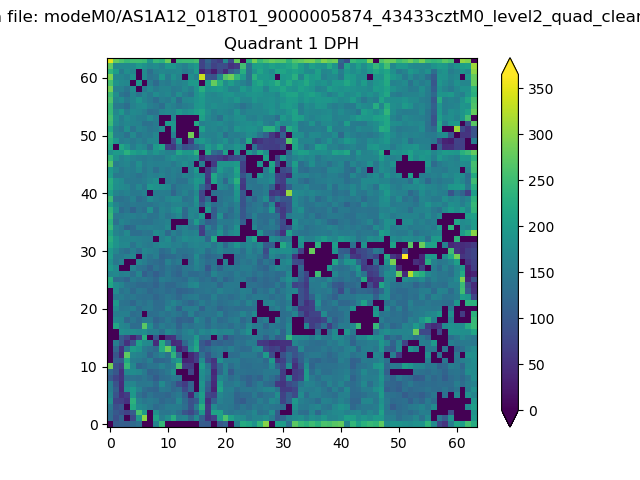 |
Quadrant B |
|---|---|---|---|
| Quadrant D | 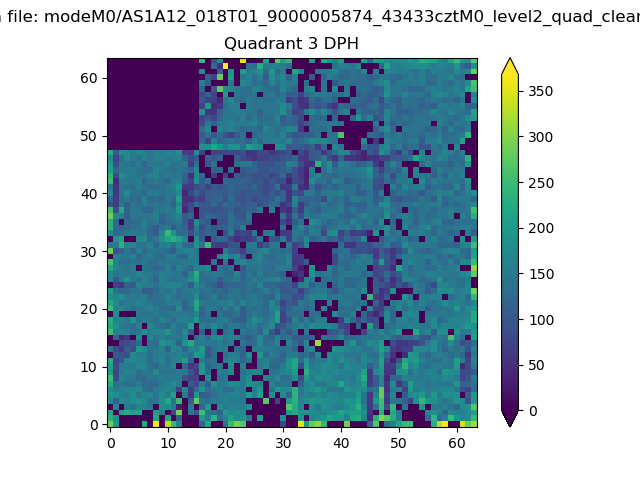 |
 |
Quadrant C |
| Plot type | Count rate plots | Images |
|---|---|---|
| Comparison with Poisson distribution Blue bars denote a histogram of data divided into 1 sec bins. Red curve is a Poisson curve with rate = median count rate of data. |
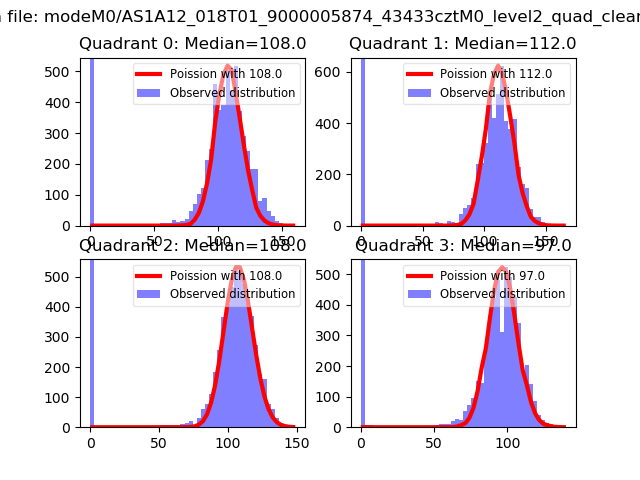 |
 |
| Quadrant-wise count rates Data is divided into 100 sec bins |
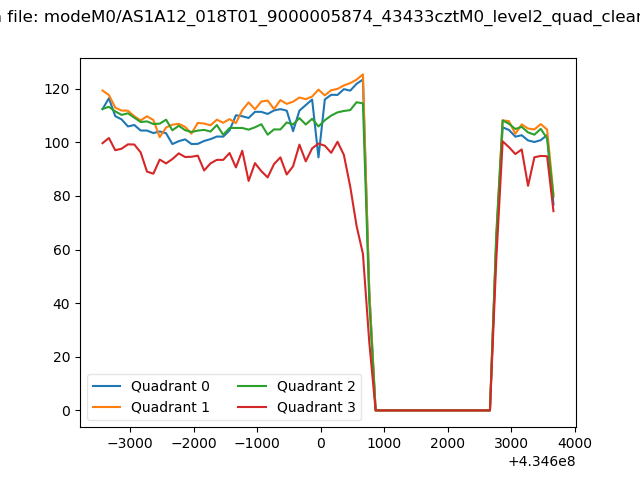 |
|
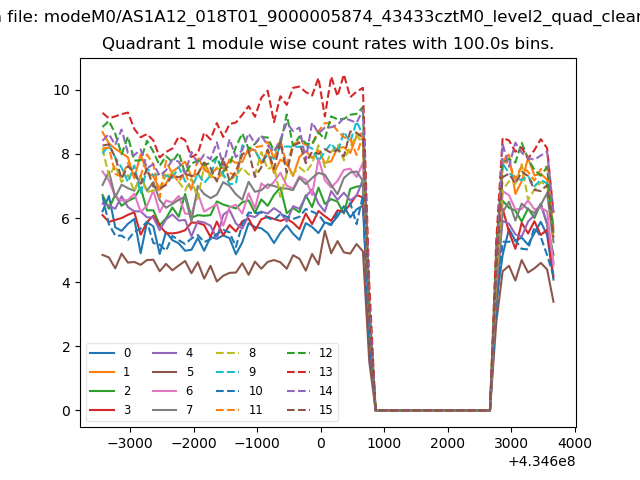
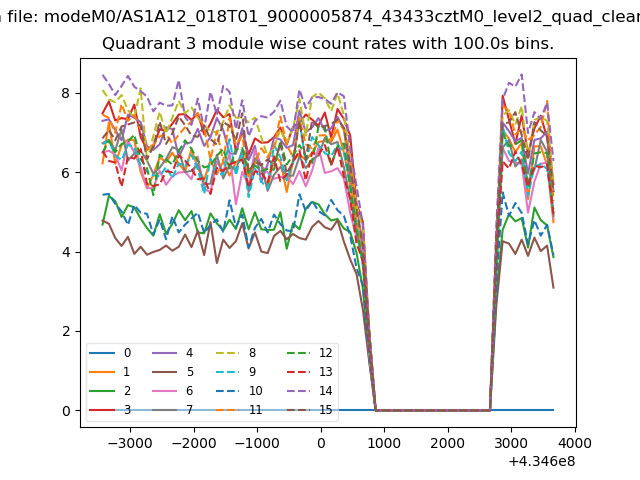
| Module-wise count rates for Quadrant A Data is divided into 100 sec bins |
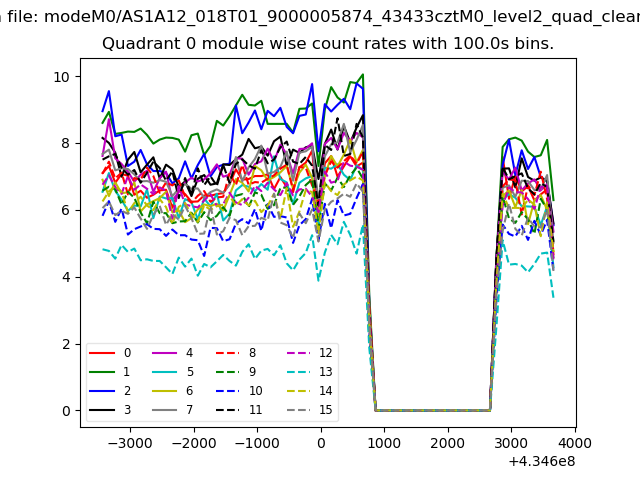 |
 |
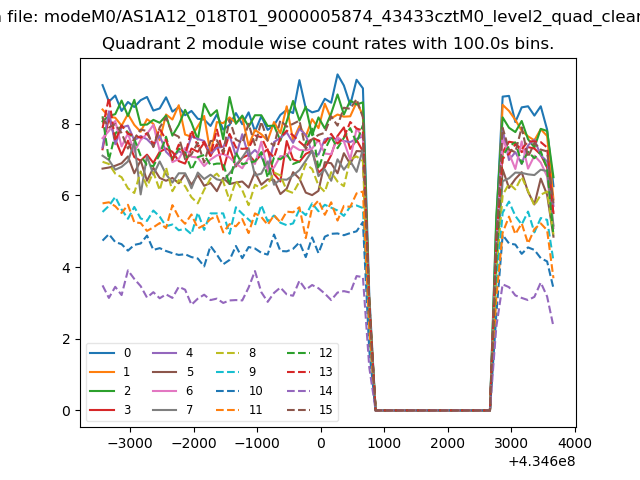
| Module-wise count rates for Quadrant B Data is divided into 100 sec bins |
 |
 |
| Module-wise count rates for Quadrant C Data is divided into 100 sec bins |
 |
 |
| Module-wise count rates for Quadrant D Data is divided into 100 sec bins |
 |
 |
| Parameter | Plot |
|---|---|
| CZT HV Monitor | 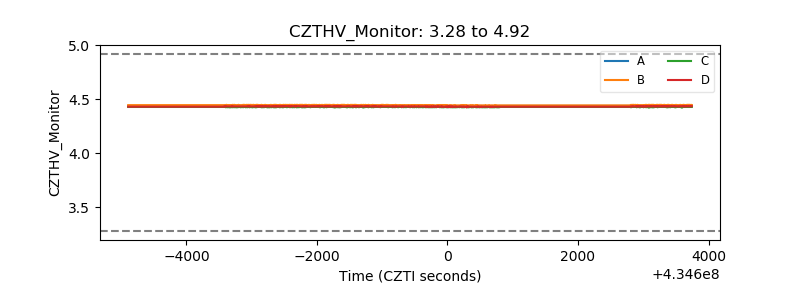 |
| D_VDD | 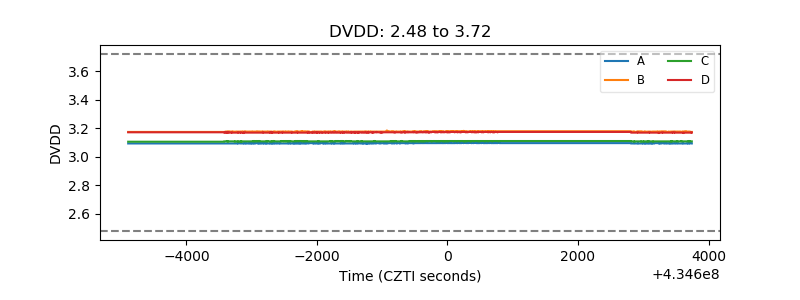 |
| Temperature 1 | 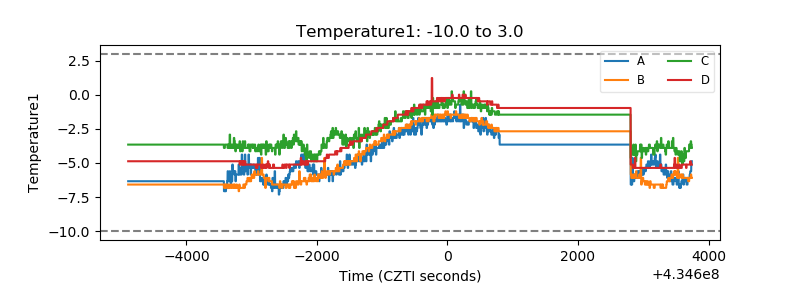 |
| Veto HV Monitor |  |
| Veto LLD | 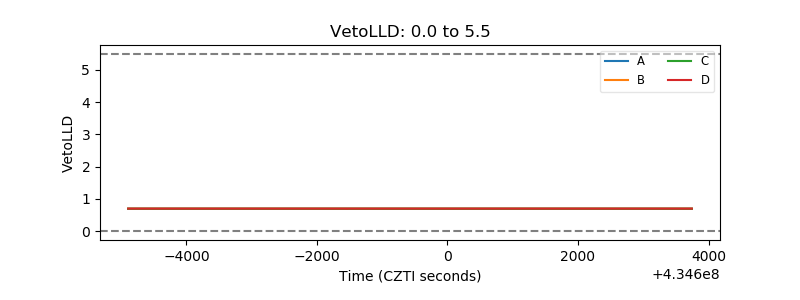 |
| Alpha Counter | 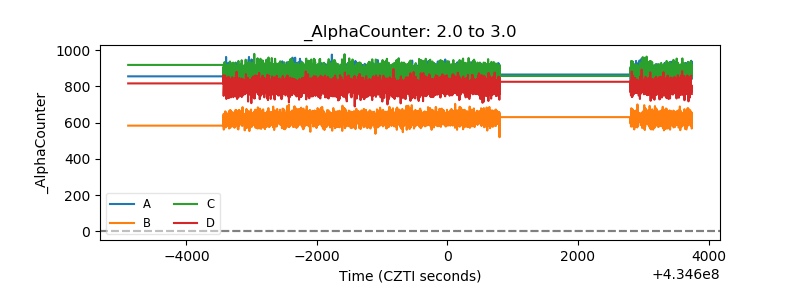 |
| _CPM_Rate | 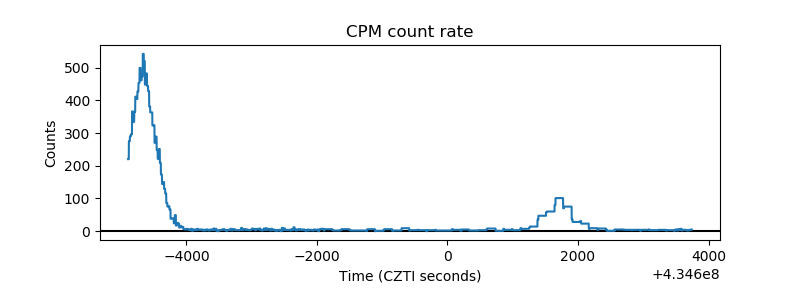 |
| CZT Counter | 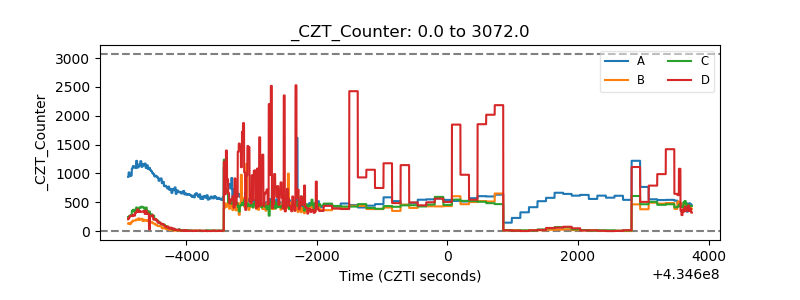 |
| +2.5 Volts monitor | 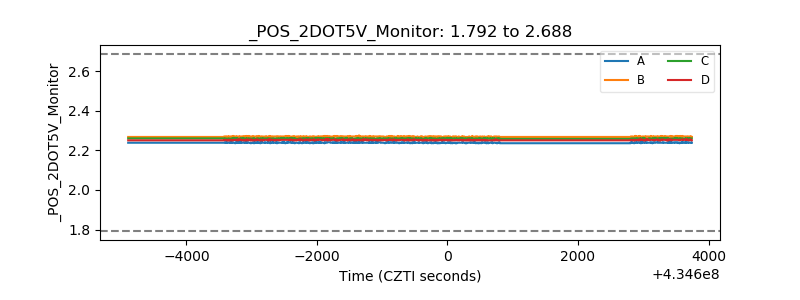 |
| +5 Volts monitor | 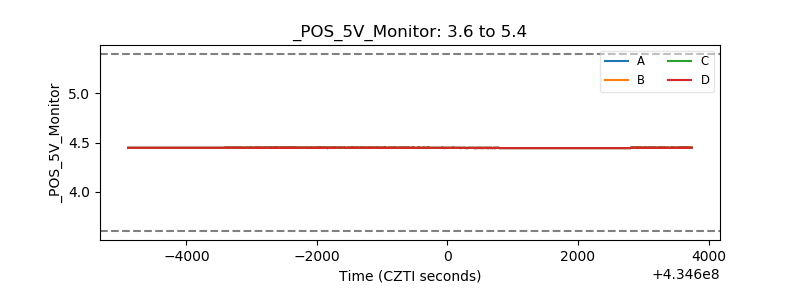 |
| _ROLL_ROT | 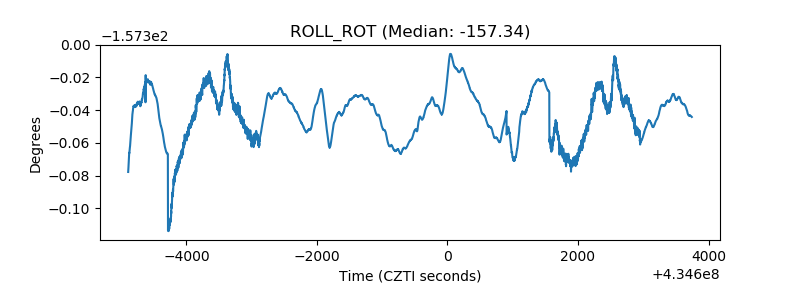 |
| _Roll_DEC | 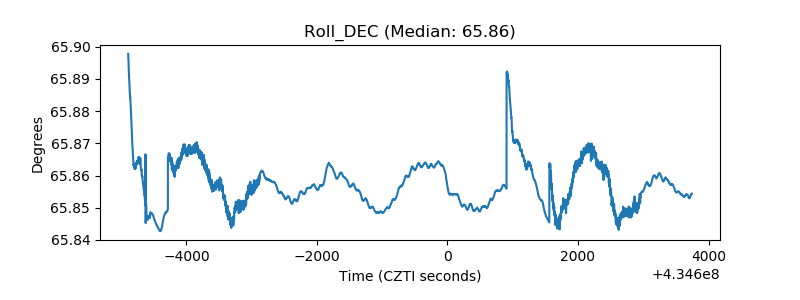 |
| _Roll_RA | 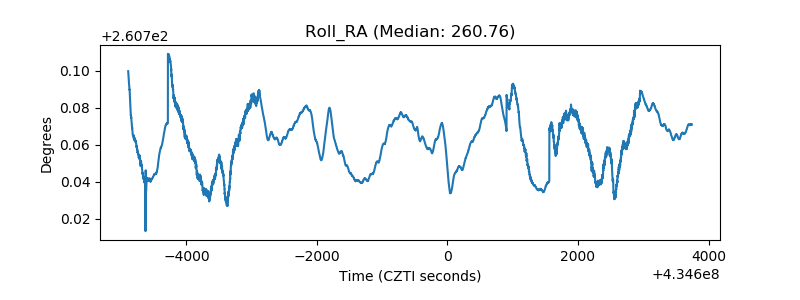 |
| Veto Counter | 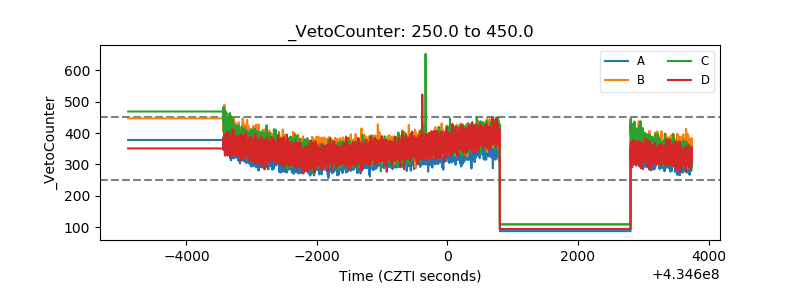 |