| Param | Original file | Final file |
|---|---|---|
| Filename | modeM0/AS1A12_018T01_9000005874_43434cztM0_level2.fits | modeM0/AS1A12_018T01_9000005874_43434cztM0_level2_quad_clean.evt |
| Size (bytes) | 354,352,320 | 86,520,960 |
| Size | 337.9 MB | 82.5 MB |
| Events in quadrant A | 3,093,532 | 579,651 |
| Events in quadrant B | 2,589,014 | 598,442 |
| Events in quadrant C | 2,569,562 | 567,008 |
| Events in quadrant D | 4,441,530 | 493,833 |
| Mode M0 | |||
|---|---|---|---|
| Quadrant | BADHDUFLAG | Total packets | Discarded packets |
| A | 0 | 12481 | 2 |
| B | 0 | 11503 | 2 |
| C | 0 | 11268 | 2 |
| D | 0 | 17157 | 2 |
| Mode M9 | |||
|---|---|---|---|
| Quadrant | BADHDUFLAG | Total packets | Discarded packets |
| A | 0 | 32 | 0 |
| B | 0 | 33 | 0 |
| C | 0 | 33 | 0 |
| D | 0 | 33 | 0 |
| Mode SS | |||
|---|---|---|---|
| Quadrant | BADHDUFLAG | Total packets | Discarded packets |
| A | 0 | 112 | 0 |
| B | 0 | 112 | 0 |
| C | 0 | 112 | 0 |
| D | 0 | 112 | 0 |
| Quadrant | Total seconds | Saturated seconds | Saturation percentage |
|---|---|---|---|
| A | 5435 | 63 | 1.159154% |
| B | 5435 | 15 | 0.275989% |
| C | 5435 | 3 | 0.055198% |
| D | 5435 | 455 | 8.371665% |
Noise dominated data is calculated using 1-second bins in cleaned event files. If a bin has >2000 counts, and if more than 50% of those come from <1% of pixels, then it is considered to be noise-dominated and hence unusable.
| Quadrant | # 1 sec bins | Bins with >0 counts | Bins with >2000 counts | High rate bins dominated by noise | Noise dominated (total time) | Noise dominated (detector-on time) | Marked lightcurve |
|---|---|---|---|---|---|---|---|
| A | 7138 | 5436 | 45 | 45 | 0.63% | 0.83% | 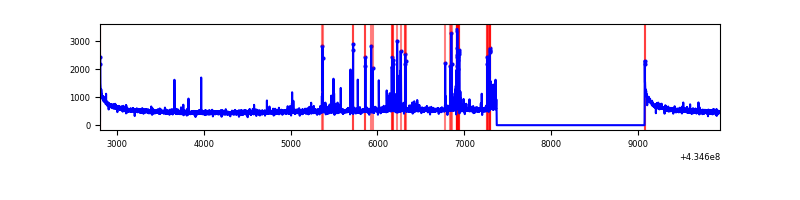 |
| B | 7138 | 5436 | 7 | 7 | 0.10% | 0.13% | 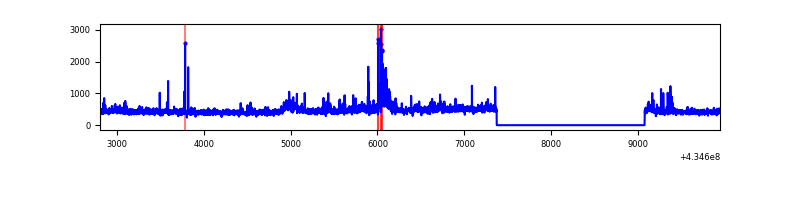 |
| C | 7138 | 5436 | 1 | 1 | 0.01% | 0.02% | 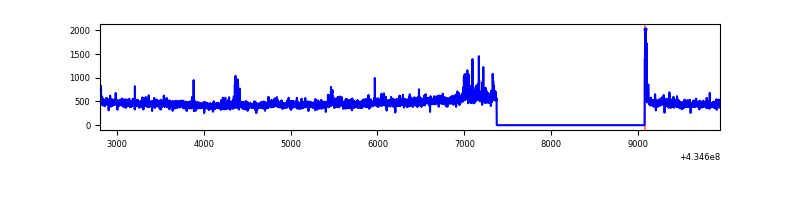 |
| D | 7138 | 5436 | 463 | 463 | 6.49% | 8.52% | 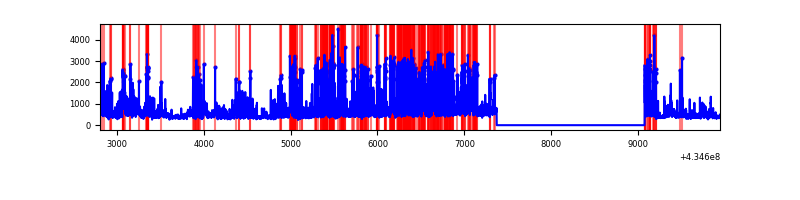 |
Top three noisy pixels from each quadrant. If the there are fewer than three noisy pixels in the level2.evt file, extra rows are filled as -1
| Pixel properties | Quadrant properties | ||||||
|---|---|---|---|---|---|---|---|
| Quadrant | DetID | PixID | Counts | Sigma | Mean | Median | Sigma |
| A | 10 | 83 | 624944 | 5348.7 | 570 | 560 | 116.7 |
| A | 15 | 237 | 218432 | 1866.37 | 570 | 560 | 116.7 |
| A | 2 | 79 | 17578 | 145.78 | 570 | 560 | 116.7 |
| B | 0 | 186 | 107863 | 975.18 | 572 | 556 | 110.0 |
| B | 0 | 199 | 94422 | 853.03 | 572 | 556 | 110.0 |
| B | 0 | 189 | 57249 | 515.21 | 572 | 556 | 110.0 |
| C | 15 | 214 | 229232 | 1753.44 | 557 | 560 | 130.4 |
| C | 3 | 233 | 124878 | 953.26 | 557 | 560 | 130.4 |
| C | 0 | 207 | 38559 | 291.37 | 557 | 560 | 130.4 |
| D | 1 | 52 | 1952211 | 14934.44 | 536 | 519 | 130.7 |
| D | 13 | 249 | 173634 | 1324.68 | 536 | 519 | 130.7 |
| D | 2 | 249 | 55852 | 423.41 | 536 | 519 | 130.7 |
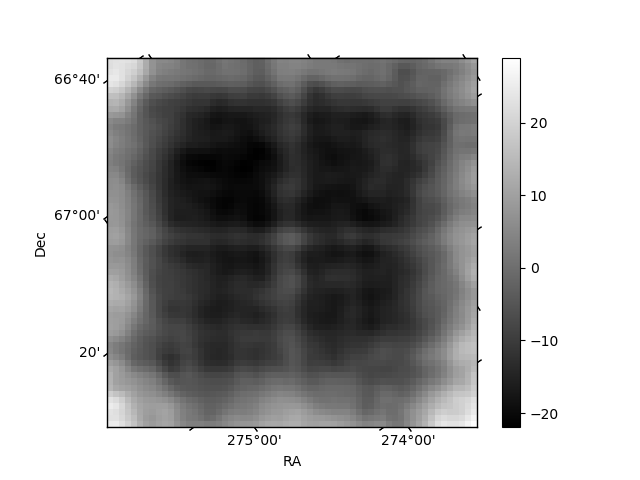
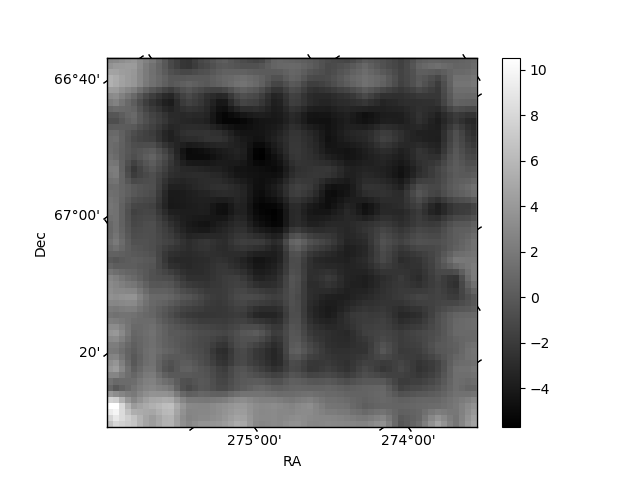
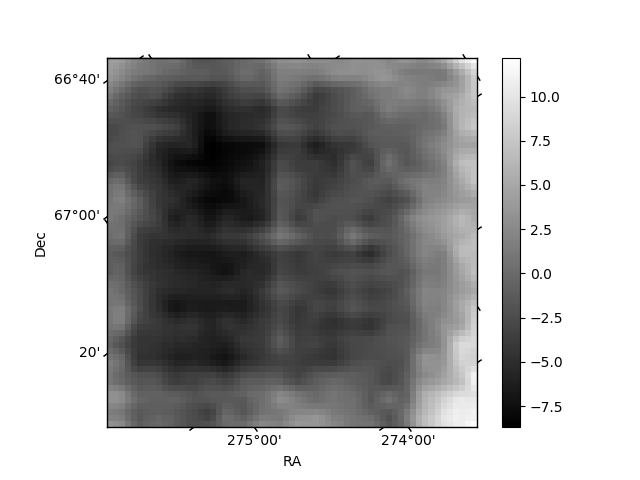
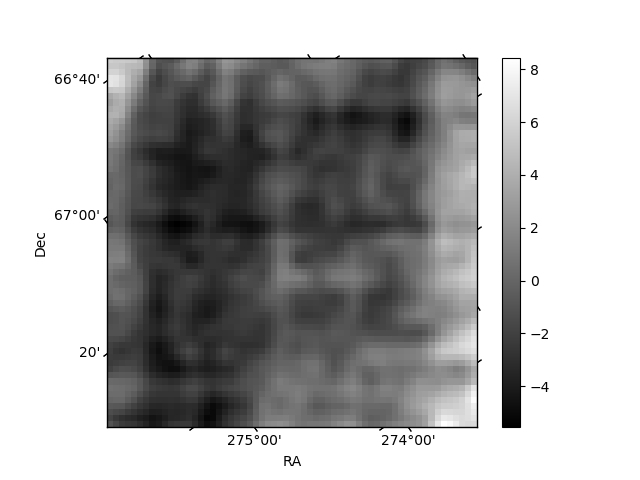
Histogram calculated using DETX and DETY for each event in the final _common_clean file
| Quadrant A | 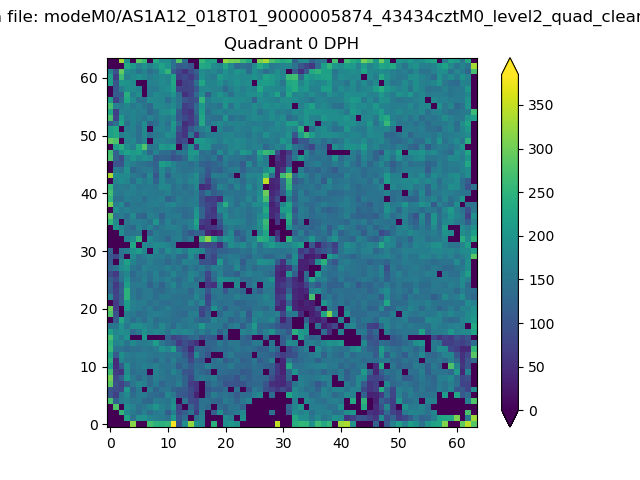 |
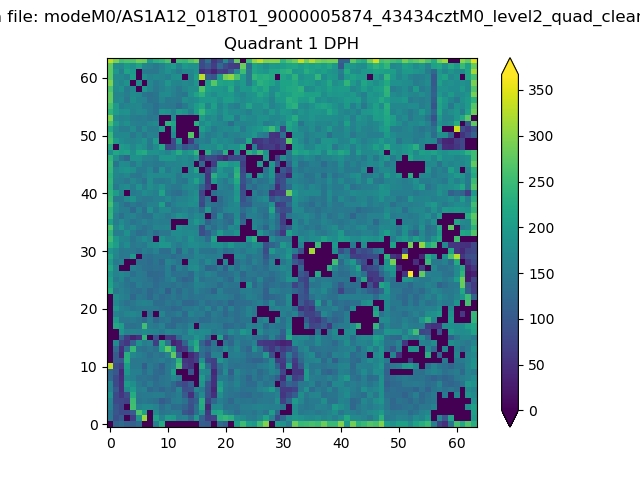 |
Quadrant B |
|---|---|---|---|
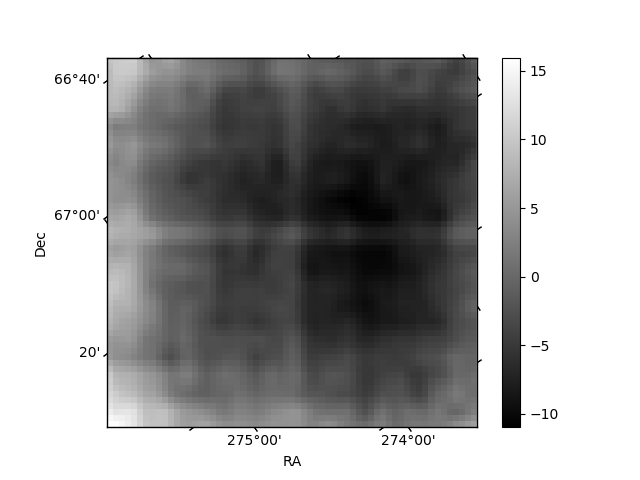
| Quadrant D | 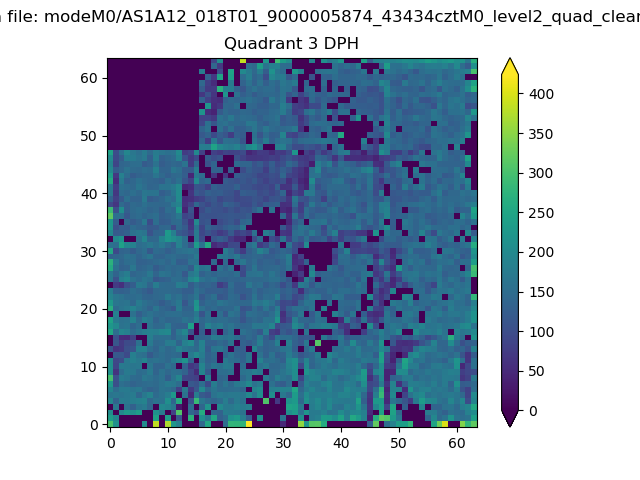 |
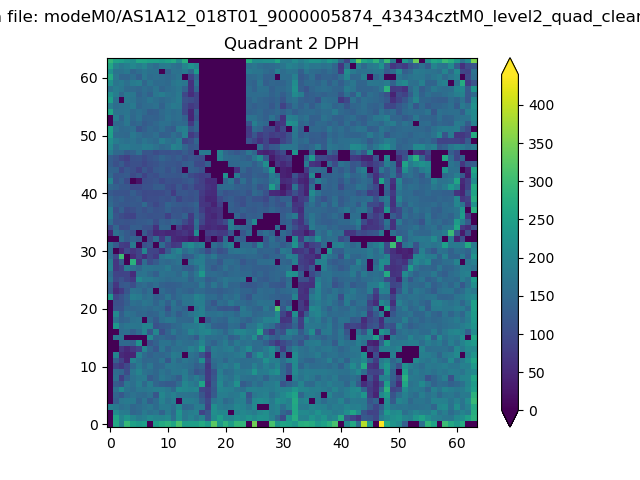 |
Quadrant C |
| Plot type | Count rate plots | Images |
|---|---|---|
| Comparison with Poisson distribution Blue bars denote a histogram of data divided into 1 sec bins. Red curve is a Poisson curve with rate = median count rate of data. |
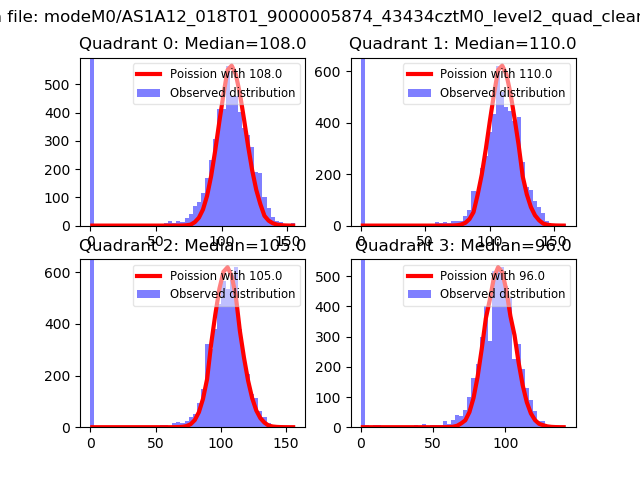 |
 |
| Quadrant-wise count rates Data is divided into 100 sec bins |
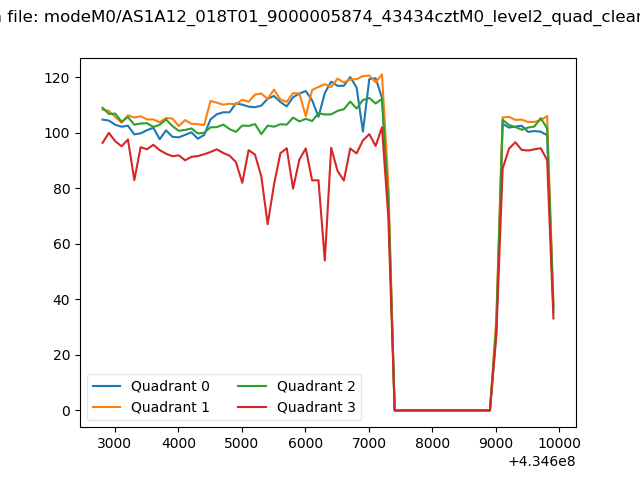 |
|
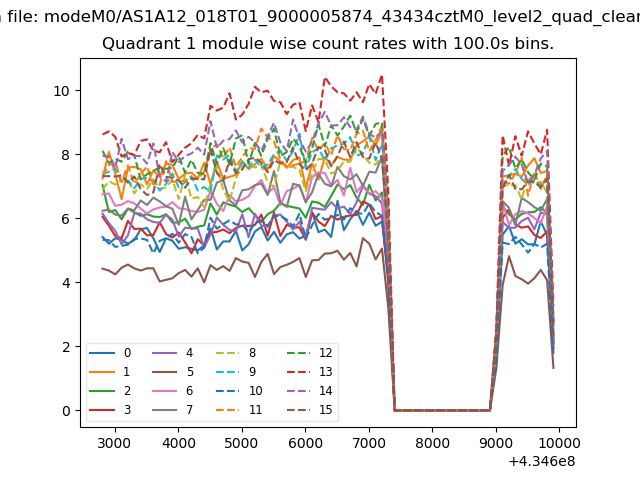
| Module-wise count rates for Quadrant A Data is divided into 100 sec bins |
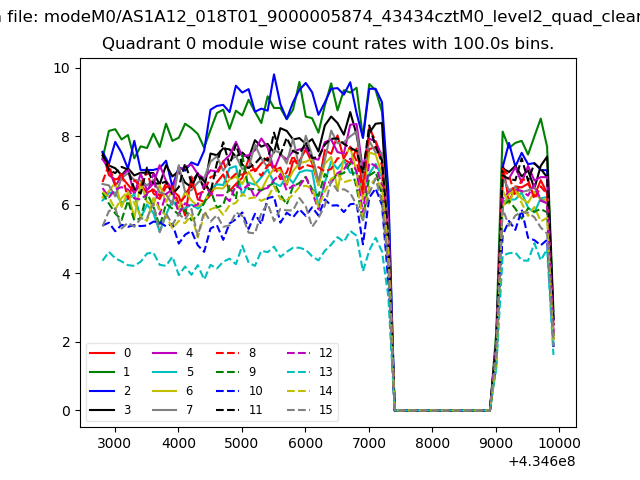 |
 |
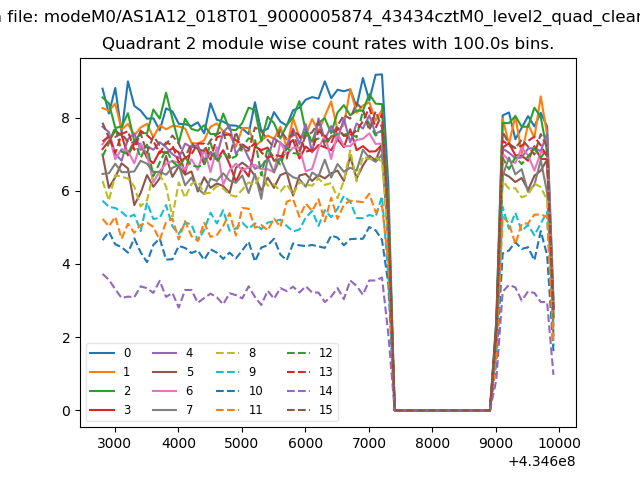
| Module-wise count rates for Quadrant B Data is divided into 100 sec bins |
 |
 |
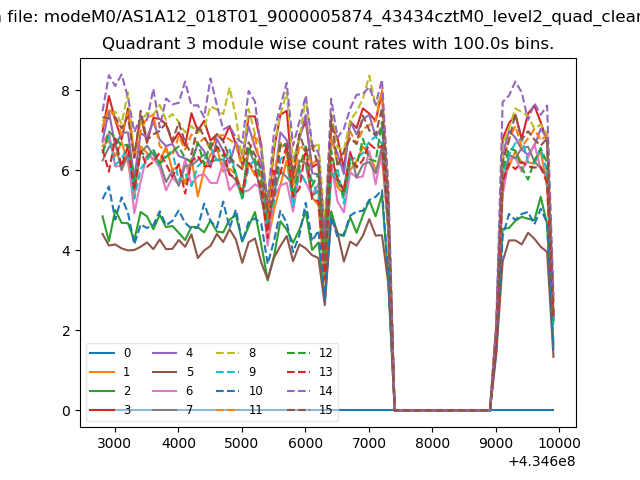
| Module-wise count rates for Quadrant C Data is divided into 100 sec bins |
 |
 |
| Module-wise count rates for Quadrant D Data is divided into 100 sec bins |
 |
 |
| Parameter | Plot |
|---|---|
| CZT HV Monitor | 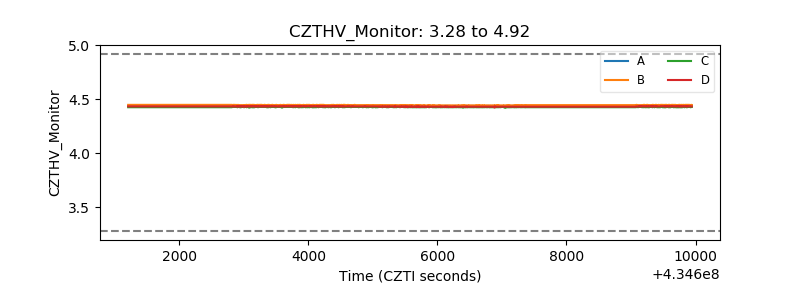 |
| D_VDD | 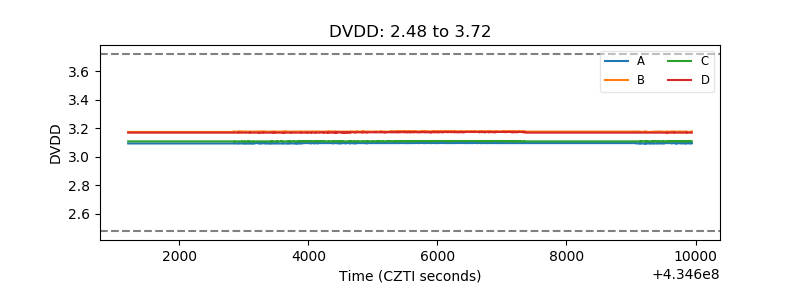 |
| Temperature 1 |  |
| Veto HV Monitor | 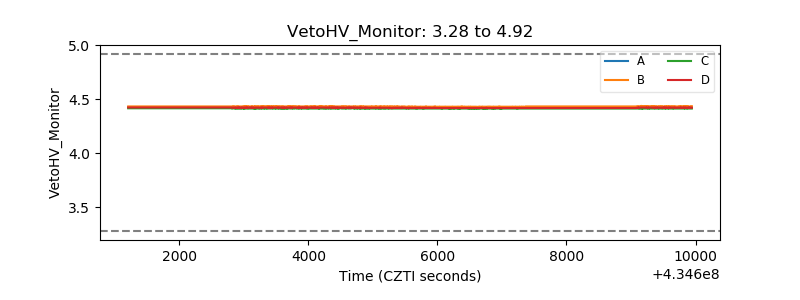 |
| Veto LLD | 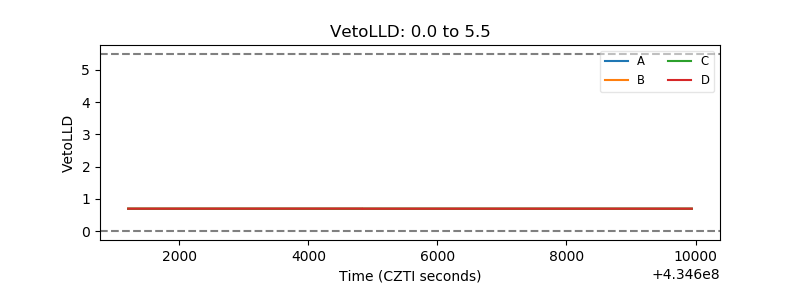 |
| Alpha Counter | 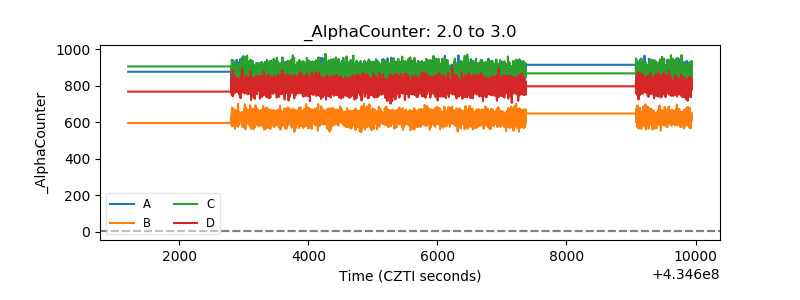 |
| _CPM_Rate | 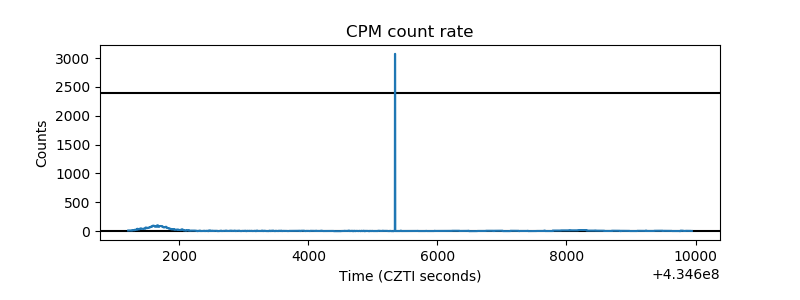 |
| CZT Counter | 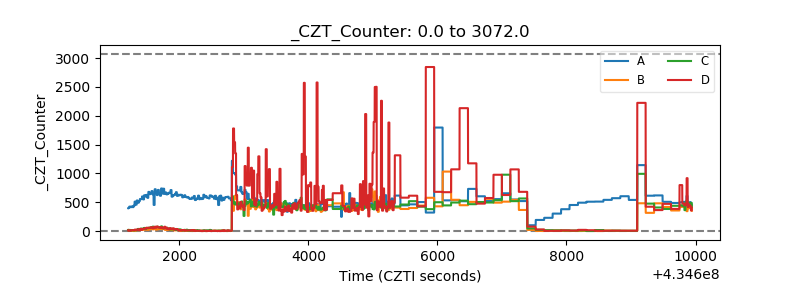 |
| +2.5 Volts monitor | 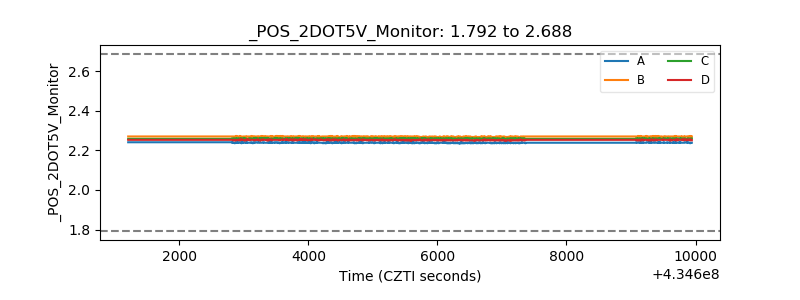 |
| +5 Volts monitor | 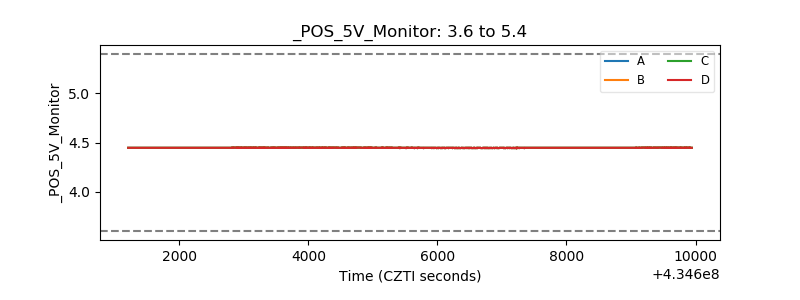 |
| _ROLL_ROT | 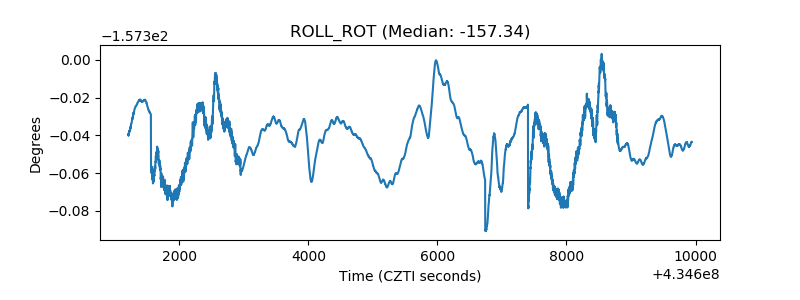 |
| _Roll_DEC | 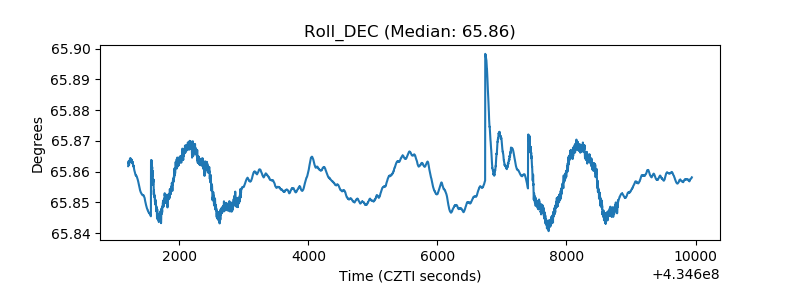 |
| _Roll_RA | 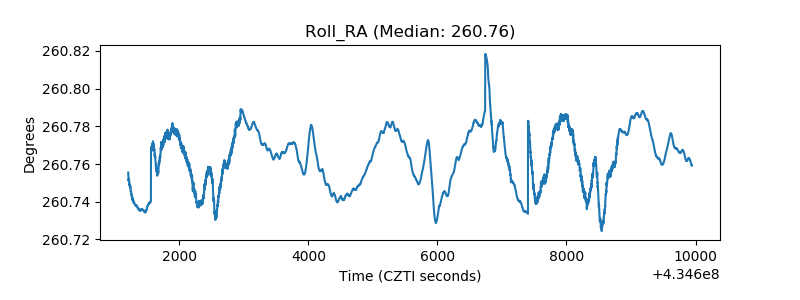 |
| Veto Counter |  |