| Param | Original file | Final file |
|---|---|---|
| Filename | modeM0/AS1A12_018T01_9000005874_43435cztM0_level2.fits | modeM0/AS1A12_018T01_9000005874_43435cztM0_level2_quad_clean.evt |
| Size (bytes) | 453,237,120 | 84,663,360 |
| Size | 432.2 MB | 80.7 MB |
| Events in quadrant A | 5,721,267 | 494,084 |
| Events in quadrant B | 2,936,732 | 618,071 |
| Events in quadrant C | 2,647,887 | 584,741 |
| Events in quadrant D | 5,032,770 | 471,774 |
| Mode M0 | |||
|---|---|---|---|
| Quadrant | BADHDUFLAG | Total packets | Discarded packets |
| A | 0 | 20720 | 1 |
| B | 0 | 12689 | 1 |
| C | 0 | 11580 | 1 |
| D | 0 | 19008 | 1 |
| Mode M9 | |||
|---|---|---|---|
| Quadrant | BADHDUFLAG | Total packets | Discarded packets |
| A | 0 | 14 | 0 |
| B | 0 | 14 | 0 |
| C | 0 | 14 | 0 |
| D | 0 | 14 | 0 |
| Mode SS | |||
|---|---|---|---|
| Quadrant | BADHDUFLAG | Total packets | Discarded packets |
| A | 0 | 116 | 0 |
| B | 0 | 116 | 0 |
| C | 0 | 116 | 0 |
| D | 0 | 116 | 0 |
| Quadrant | Total seconds | Saturated seconds | Saturation percentage |
|---|---|---|---|
| A | 5638 | 1161 | 20.592409% |
| B | 5638 | 41 | 0.727208% |
| C | 5638 | 5 | 0.088684% |
| D | 5638 | 784 | 13.905640% |
Noise dominated data is calculated using 1-second bins in cleaned event files. If a bin has >2000 counts, and if more than 50% of those come from <1% of pixels, then it is considered to be noise-dominated and hence unusable.
| Quadrant | # 1 sec bins | Bins with >0 counts | Bins with >2000 counts | High rate bins dominated by noise | Noise dominated (total time) | Noise dominated (detector-on time) | Marked lightcurve |
|---|---|---|---|---|---|---|---|
| A | 7041 | 5639 | 1043 | 1043 | 14.81% | 18.50% | 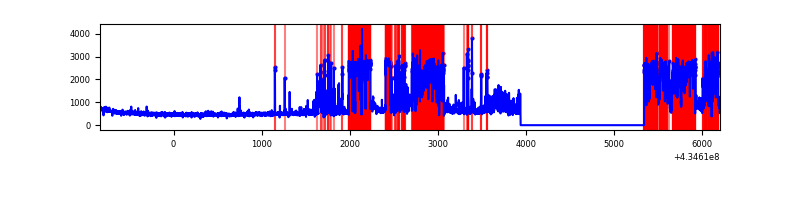 |
| B | 7041 | 5639 | 30 | 30 | 0.43% | 0.53% | 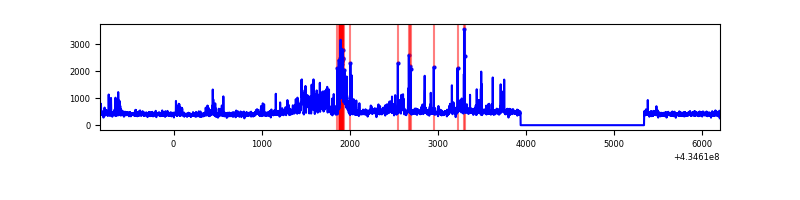 |
| C | 7041 | 5639 | 1 | 1 | 0.01% | 0.02% | 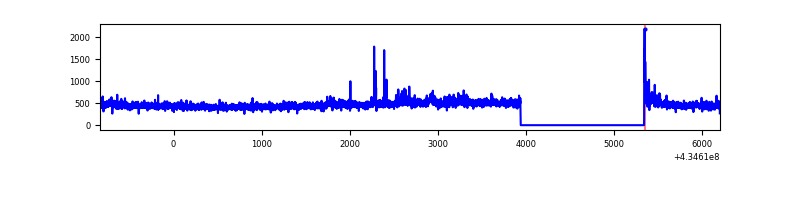 |
| D | 7041 | 5639 | 751 | 751 | 10.67% | 13.32% | 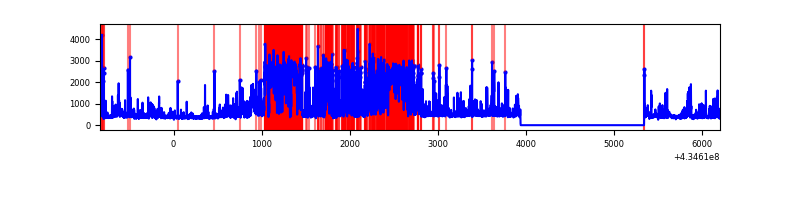 |
Top three noisy pixels from each quadrant. If the there are fewer than three noisy pixels in the level2.evt file, extra rows are filled as -1
| Pixel properties | Quadrant properties | ||||||
|---|---|---|---|---|---|---|---|
| Quadrant | DetID | PixID | Counts | Sigma | Mean | Median | Sigma |
| A | 15 | 222 | 2904408 | 26475.32 | 537 | 526 | 109.7 |
| A | 10 | 83 | 520368 | 4739.51 | 537 | 526 | 109.7 |
| A | 15 | 237 | 192194 | 1747.48 | 537 | 526 | 109.7 |
| B | 0 | 199 | 182353 | 1585.74 | 596 | 578 | 114.6 |
| B | 0 | 186 | 143208 | 1244.25 | 596 | 578 | 114.6 |
| B | 0 | 189 | 114287 | 991.95 | 596 | 578 | 114.6 |
| C | 15 | 214 | 236204 | 1724.38 | 582 | 582 | 136.6 |
| C | 3 | 233 | 125090 | 911.2 | 582 | 582 | 136.6 |
| C | 14 | 67 | 15017 | 105.64 | 582 | 582 | 136.6 |
| D | 1 | 52 | 2235470 | 16538.56 | 548 | 530 | 135.1 |
| D | 10 | 118 | 311784 | 2303.28 | 548 | 530 | 135.1 |
| D | 13 | 249 | 125676 | 926.08 | 548 | 530 | 135.1 |
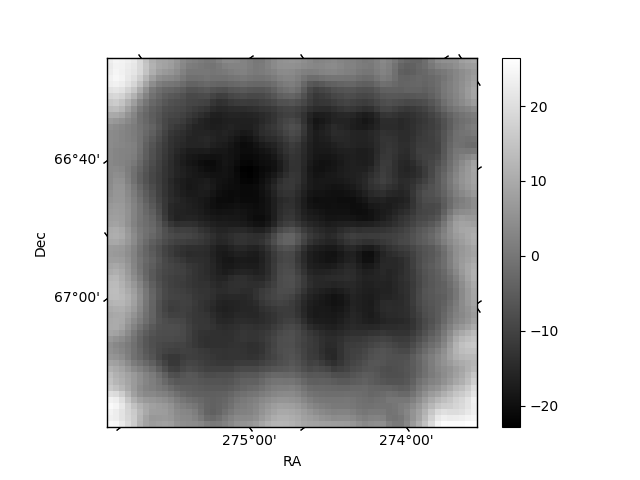
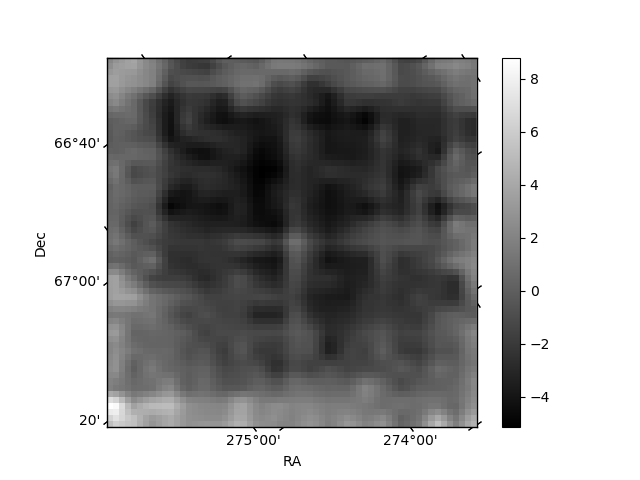
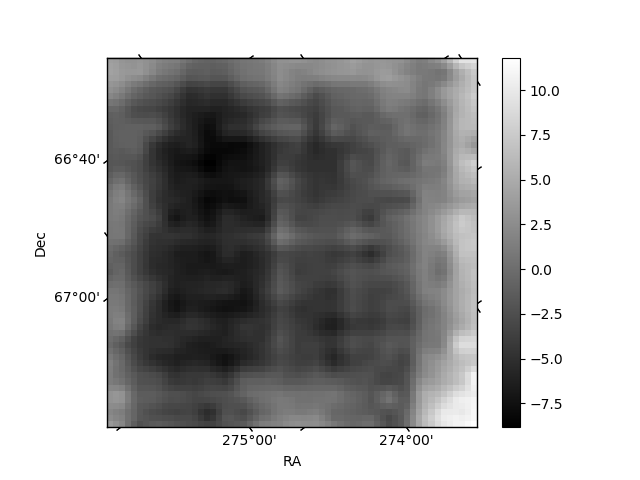
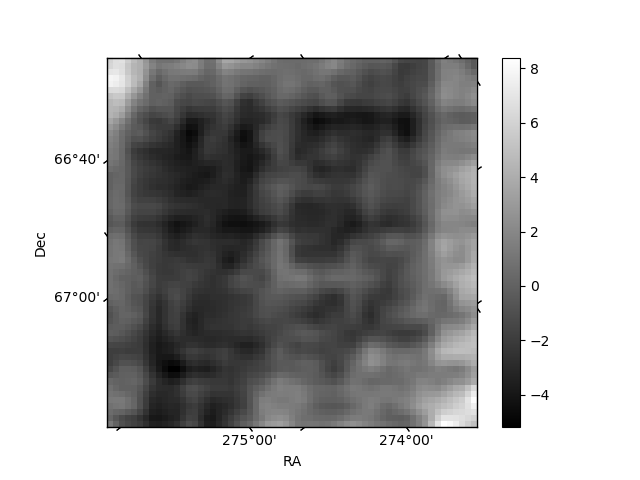
Histogram calculated using DETX and DETY for each event in the final _common_clean file
| Quadrant A | 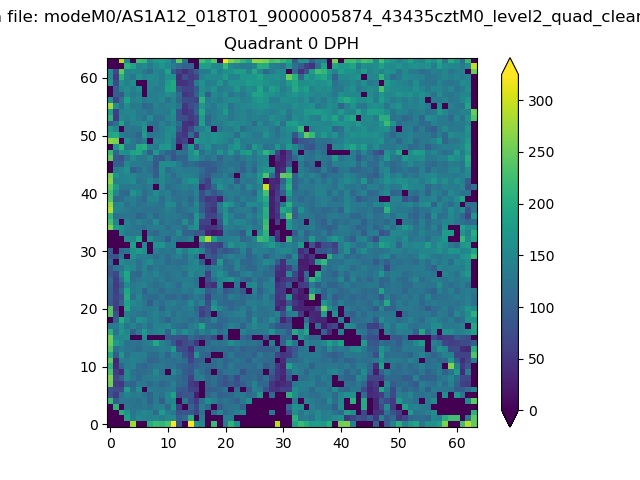 |
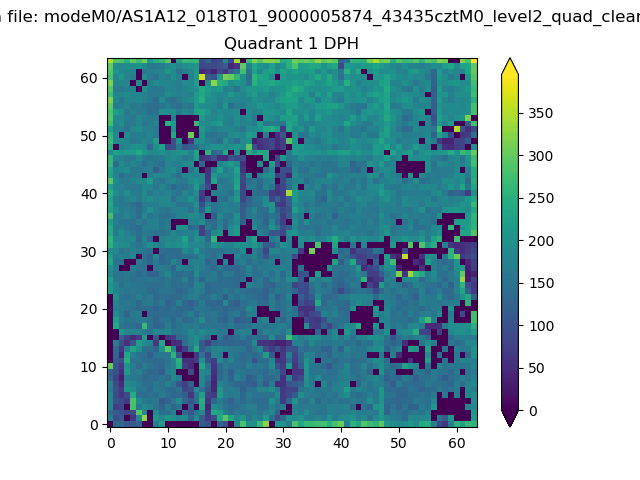 |
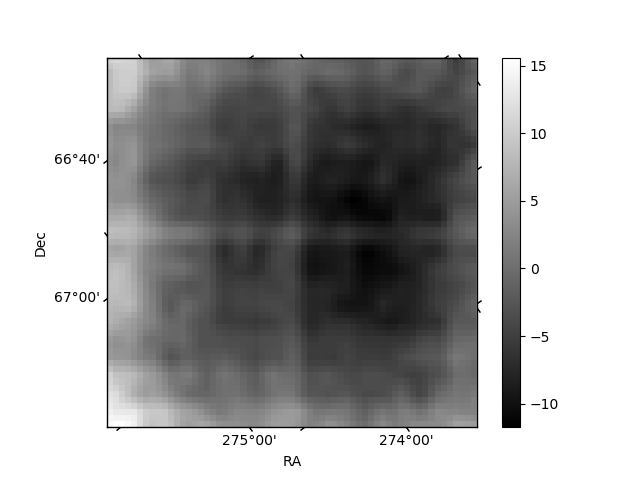
Quadrant B |
|---|---|---|---|
| Quadrant D | 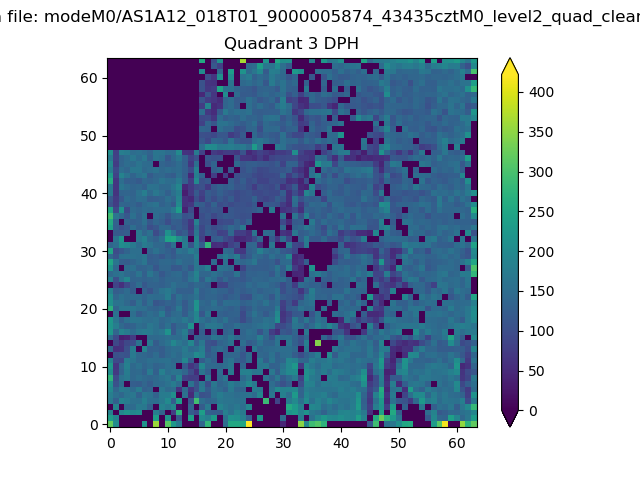 |
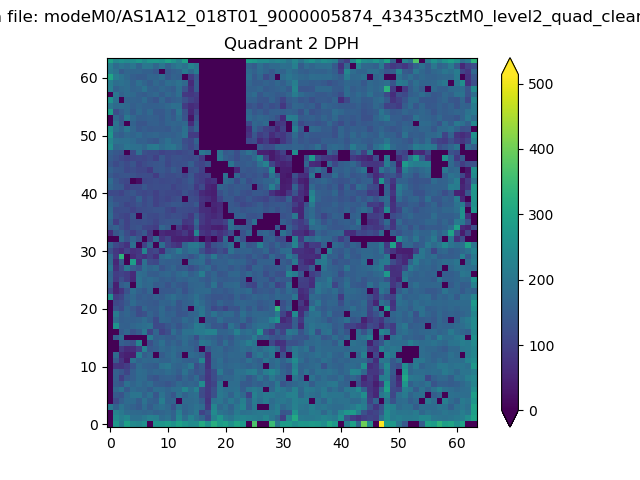 |
Quadrant C |
| Plot type | Count rate plots | Images |
|---|---|---|
| Comparison with Poisson distribution Blue bars denote a histogram of data divided into 1 sec bins. Red curve is a Poisson curve with rate = median count rate of data. |
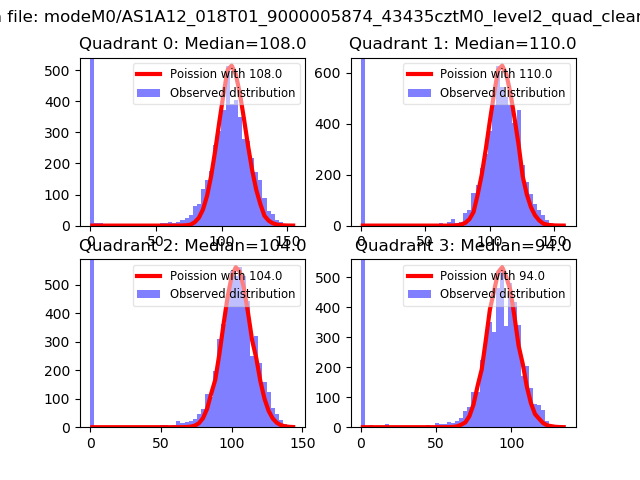 |
 |
| Quadrant-wise count rates Data is divided into 100 sec bins |
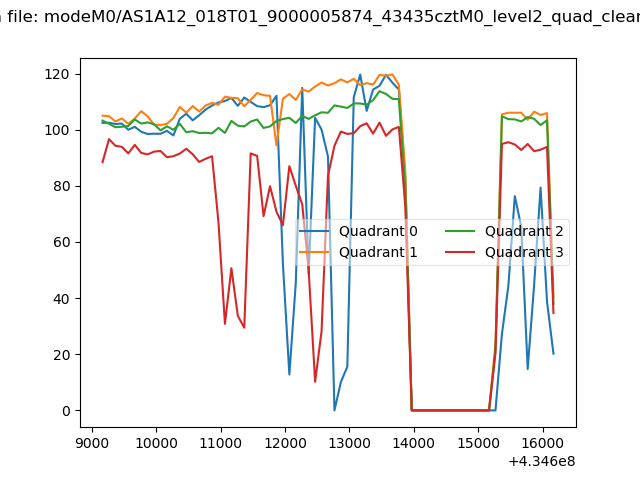 |
|
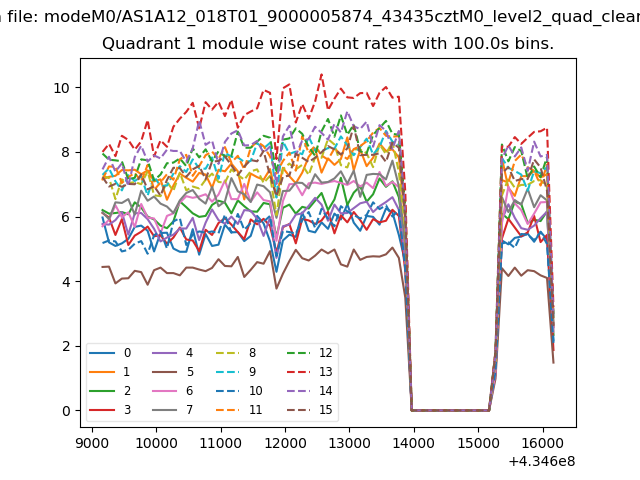
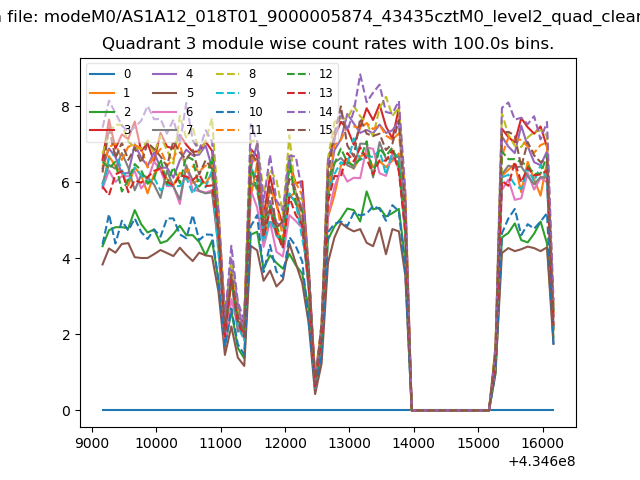
| Module-wise count rates for Quadrant A Data is divided into 100 sec bins |
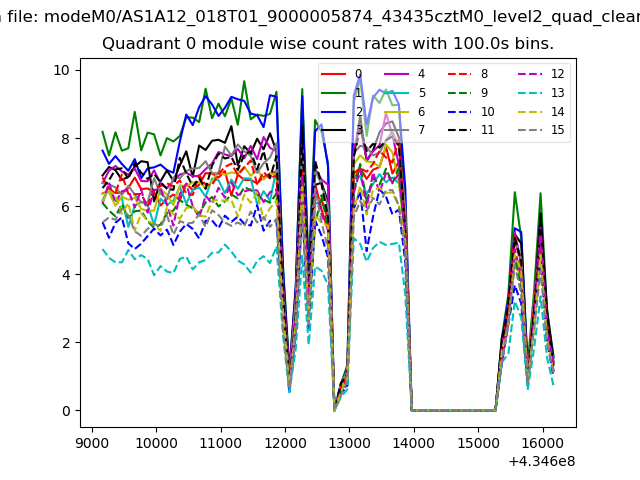 |
 |
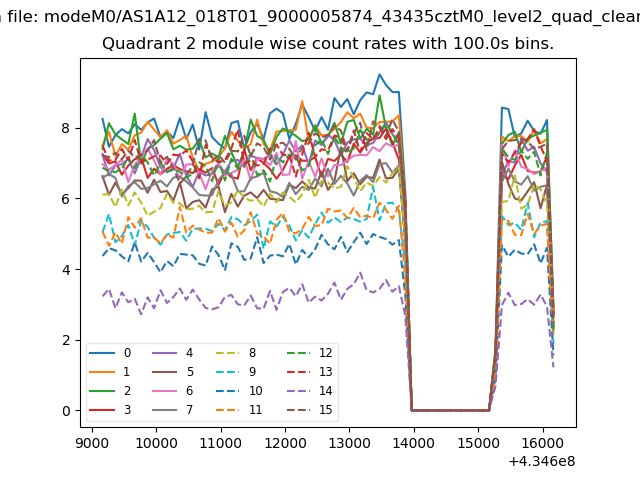
| Module-wise count rates for Quadrant B Data is divided into 100 sec bins |
 |
 |
| Module-wise count rates for Quadrant C Data is divided into 100 sec bins |
 |
 |
| Module-wise count rates for Quadrant D Data is divided into 100 sec bins |
 |
 |
| Parameter | Plot |
|---|---|
| CZT HV Monitor | 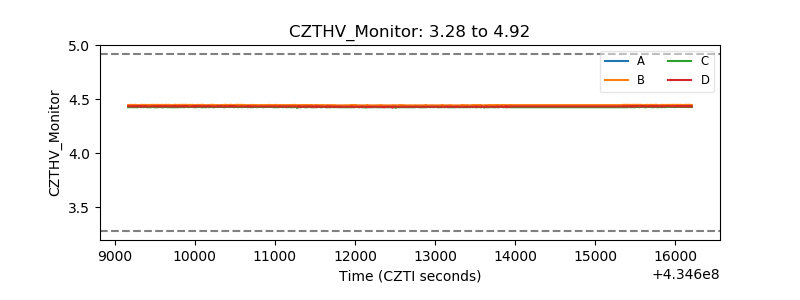 |
| D_VDD | 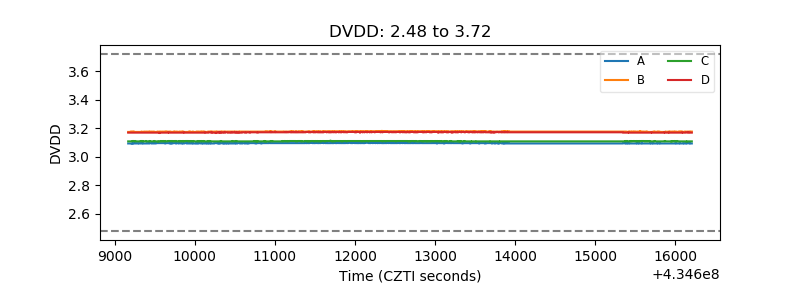 |
| Temperature 1 | 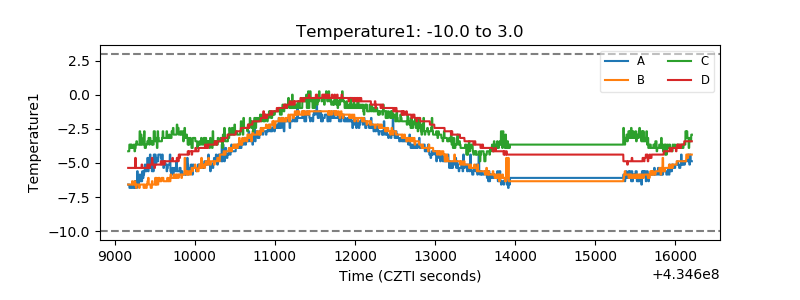 |
| Veto HV Monitor | 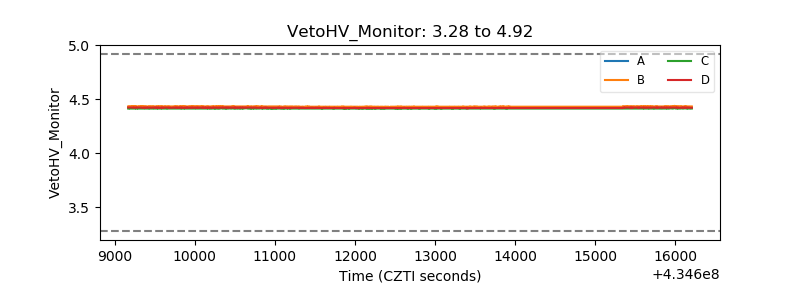 |
| Veto LLD | 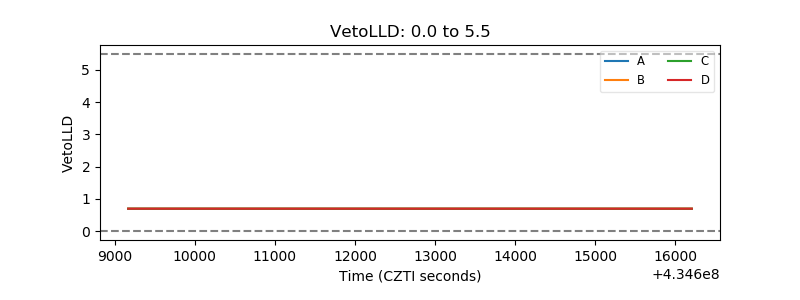 |
| Alpha Counter | 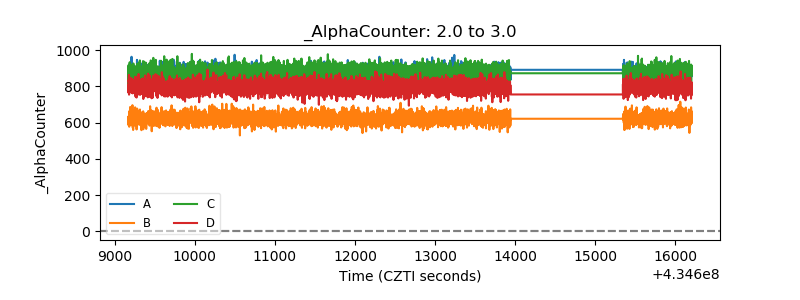 |
| _CPM_Rate | 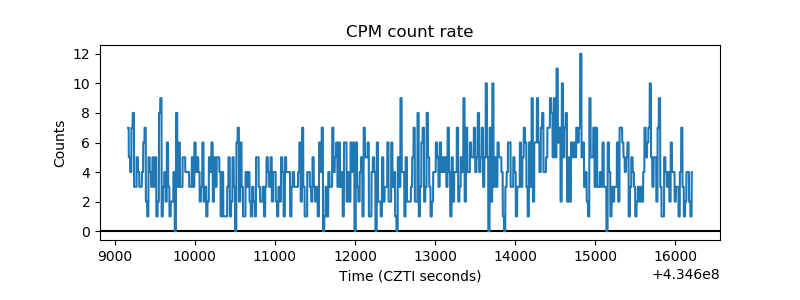 |
| CZT Counter | 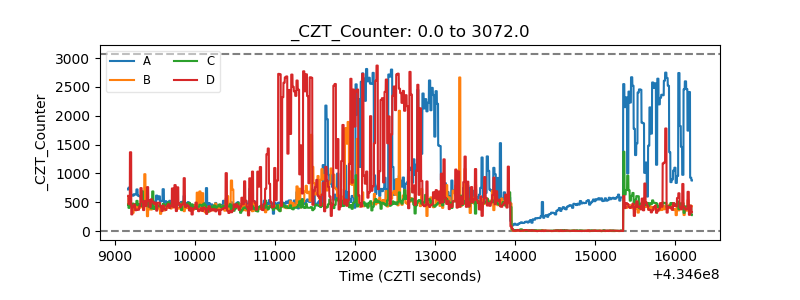 |
| +2.5 Volts monitor | 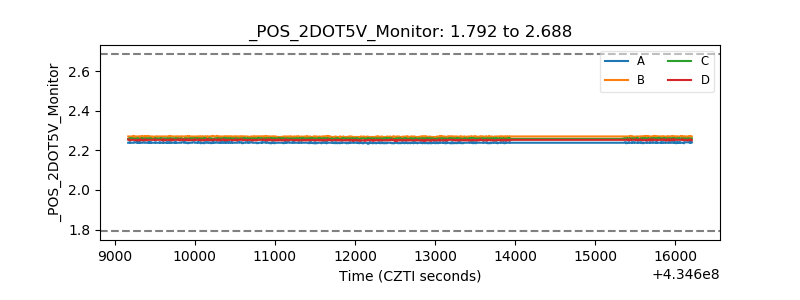 |
| +5 Volts monitor | 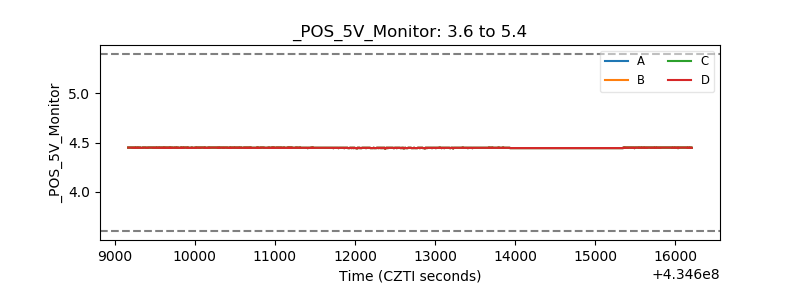 |
| _ROLL_ROT | 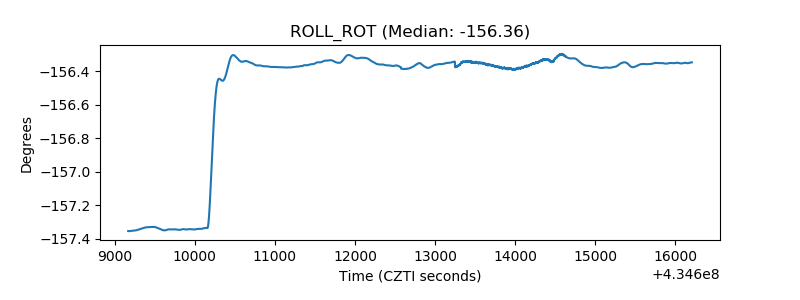 |
| _Roll_DEC | 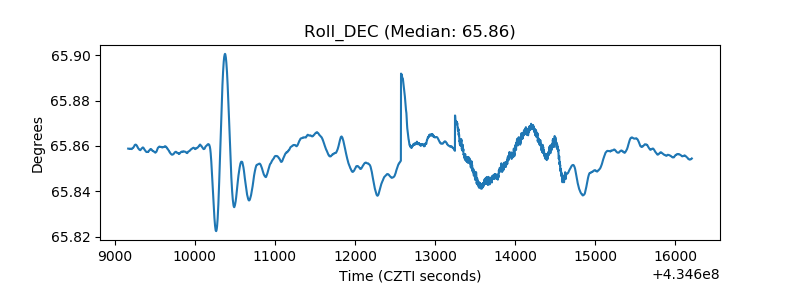 |
| _Roll_RA | 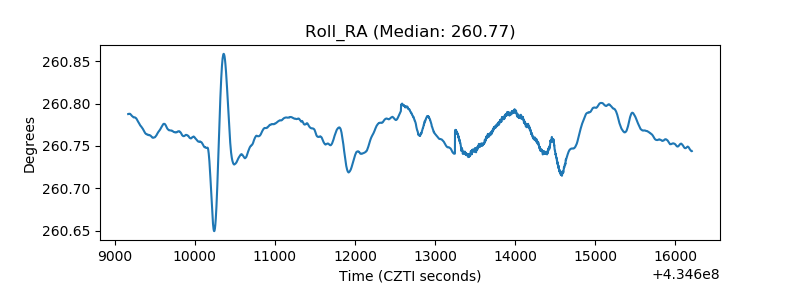 |
| Veto Counter | 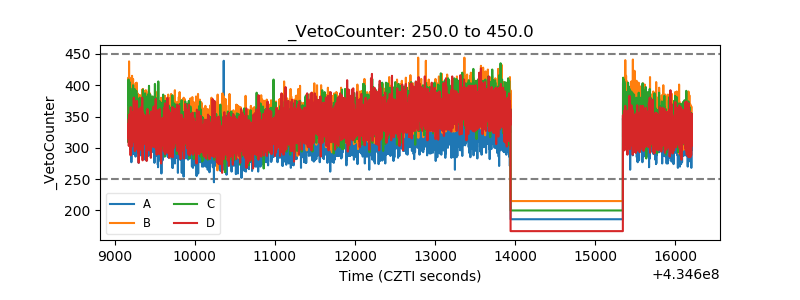 |