| Param | Original file | Final file |
|---|---|---|
| Filename | modeM0/AS1A12_018T01_9000005874_43436cztM0_level2.fits | modeM0/AS1A12_018T01_9000005874_43436cztM0_level2_quad_clean.evt |
| Size (bytes) | 508,752,000 | 91,056,960 |
| Size | 485.2 MB | 86.8 MB |
| Events in quadrant A | 6,667,292 | 570,956 |
| Events in quadrant B | 2,845,719 | 657,829 |
| Events in quadrant C | 2,733,649 | 613,847 |
| Events in quadrant D | 6,127,777 | 501,899 |
| Mode M0 | |||
|---|---|---|---|
| Quadrant | BADHDUFLAG | Total packets | Discarded packets |
| A | 0 | 23945 | 2 |
| B | 0 | 12515 | 2 |
| C | 0 | 11986 | 2 |
| D | 0 | 22427 | 2 |
| Mode M9 | |||
|---|---|---|---|
| Quadrant | BADHDUFLAG | Total packets | Discarded packets |
| A | 0 | 17 | 0 |
| B | 0 | 18 | 0 |
| C | 0 | 18 | 0 |
| D | 0 | 18 | 0 |
| Mode SS | |||
|---|---|---|---|
| Quadrant | BADHDUFLAG | Total packets | Discarded packets |
| A | 0 | 120 | 0 |
| B | 0 | 120 | 0 |
| C | 0 | 120 | 0 |
| D | 0 | 120 | 0 |
| Quadrant | Total seconds | Saturated seconds | Saturation percentage |
|---|---|---|---|
| A | 5901 | 813 | 13.777326% |
| B | 5901 | 15 | 0.254194% |
| C | 5901 | 5 | 0.084731% |
| D | 5901 | 891 | 15.099136% |
Noise dominated data is calculated using 1-second bins in cleaned event files. If a bin has >2000 counts, and if more than 50% of those come from <1% of pixels, then it is considered to be noise-dominated and hence unusable.
| Quadrant | # 1 sec bins | Bins with >0 counts | Bins with >2000 counts | High rate bins dominated by noise | Noise dominated (total time) | Noise dominated (detector-on time) | Marked lightcurve |
|---|---|---|---|---|---|---|---|
| A | 7184 | 5902 | 739 | 739 | 10.29% | 12.52% | 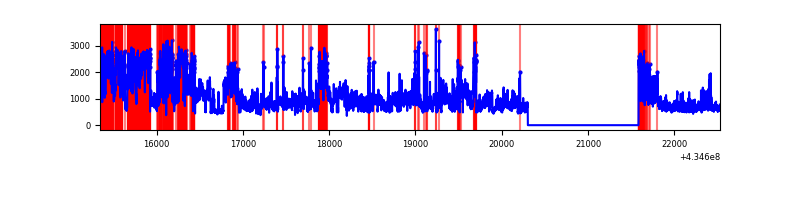 |
| B | 7184 | 5902 | 7 | 7 | 0.10% | 0.12% | 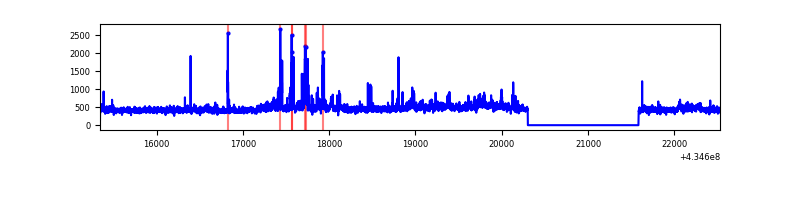 |
| C | 7184 | 5902 | 1 | 1 | 0.01% | 0.02% | 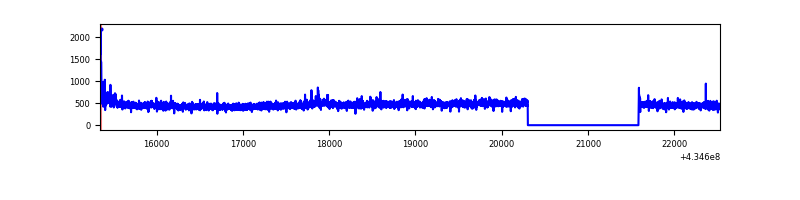 |
| D | 7184 | 5902 | 876 | 876 | 12.19% | 14.84% | 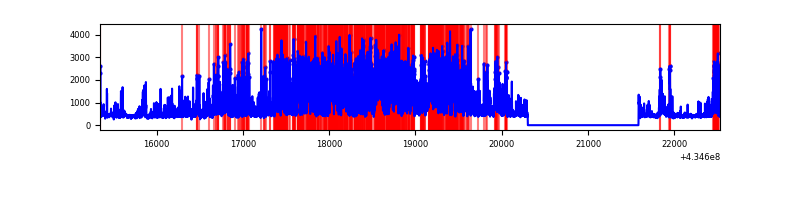 |
Top three noisy pixels from each quadrant. If the there are fewer than three noisy pixels in the level2.evt file, extra rows are filled as -1
| Pixel properties | Quadrant properties | ||||||
|---|---|---|---|---|---|---|---|
| Quadrant | DetID | PixID | Counts | Sigma | Mean | Median | Sigma |
| A | 15 | 222 | 3290878 | 26608.58 | 607 | 595 | 123.7 |
| A | 10 | 83 | 603410 | 4874.98 | 607 | 595 | 123.7 |
| A | 15 | 237 | 416043 | 3359.74 | 607 | 595 | 123.7 |
| B | 0 | 189 | 178880 | 1474.24 | 629 | 611 | 120.9 |
| B | 0 | 186 | 70414 | 577.25 | 629 | 611 | 120.9 |
| B | 15 | 85 | 33696 | 273.61 | 629 | 611 | 120.9 |
| C | 15 | 214 | 246677 | 1726.45 | 612 | 611 | 142.5 |
| C | 3 | 233 | 89843 | 626.07 | 612 | 611 | 142.5 |
| C | 14 | 67 | 8352 | 54.31 | 612 | 611 | 142.5 |
| D | 1 | 52 | 3182199 | 22487.04 | 580 | 562 | 141.5 |
| D | 2 | 16 | 280015 | 1975.11 | 580 | 562 | 141.5 |
| D | 2 | 249 | 126922 | 893.08 | 580 | 562 | 141.5 |
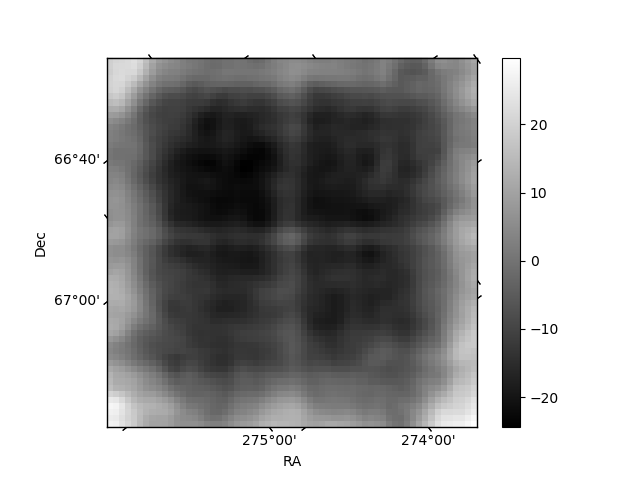
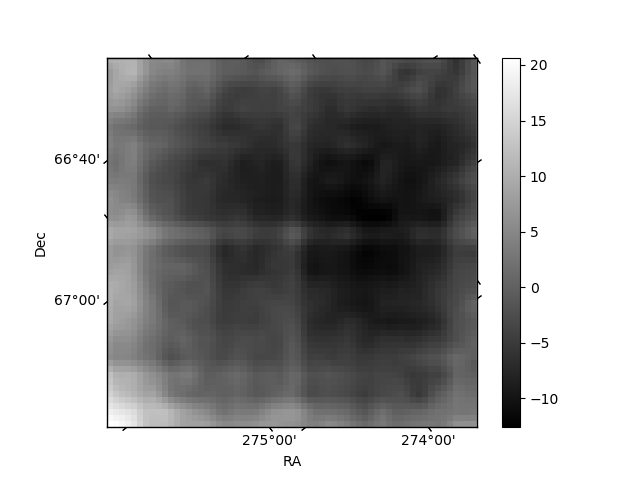
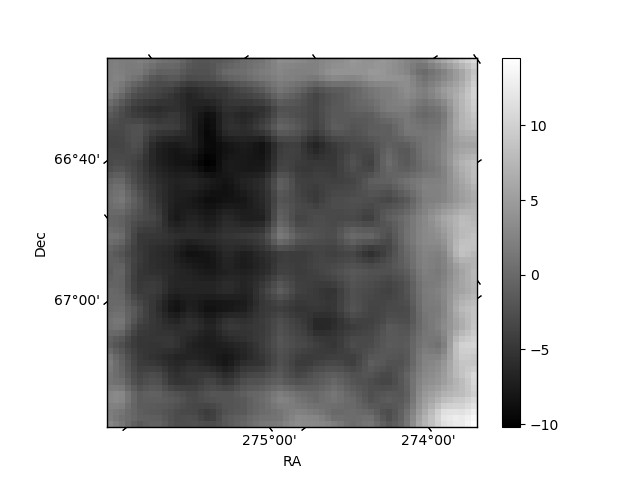
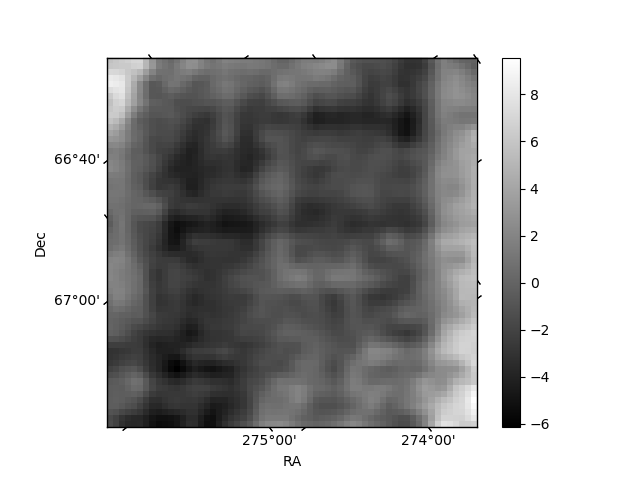
Histogram calculated using DETX and DETY for each event in the final _common_clean file
| Quadrant A | 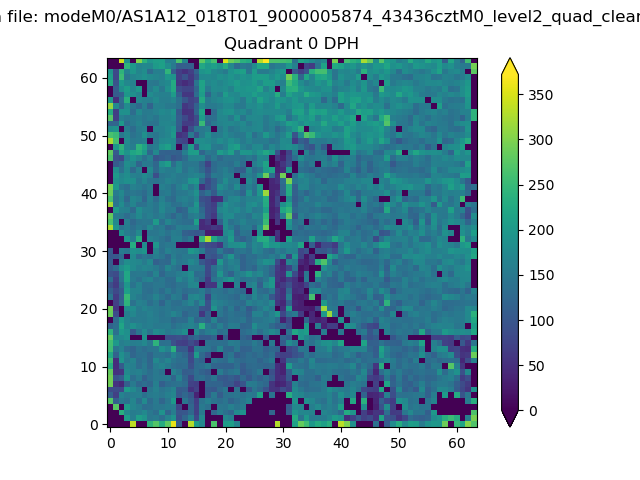 |
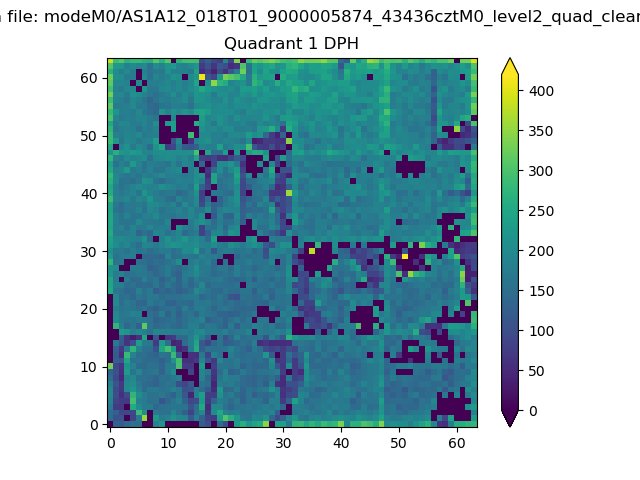 |
Quadrant B |
|---|---|---|---|
| Quadrant D | 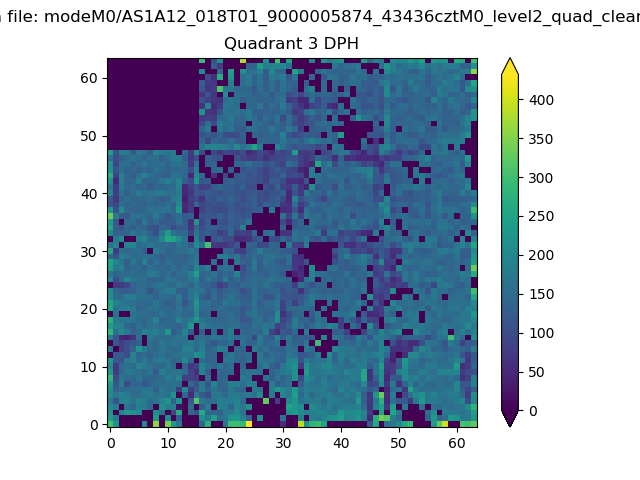 |
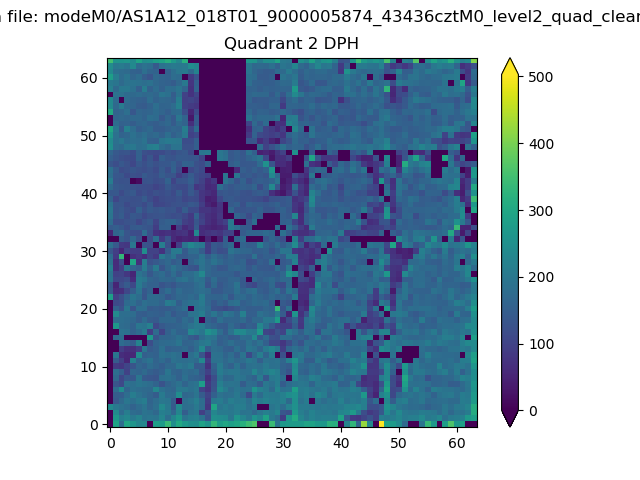 |
Quadrant C |
| Plot type | Count rate plots | Images |
|---|---|---|
| Comparison with Poisson distribution Blue bars denote a histogram of data divided into 1 sec bins. Red curve is a Poisson curve with rate = median count rate of data. |
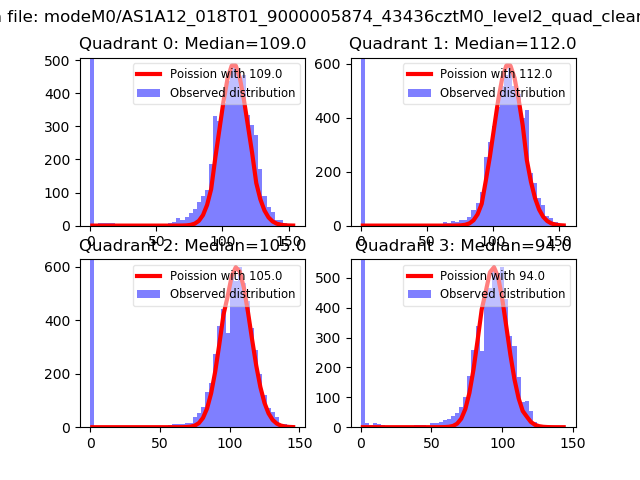 |
 |
| Quadrant-wise count rates Data is divided into 100 sec bins |
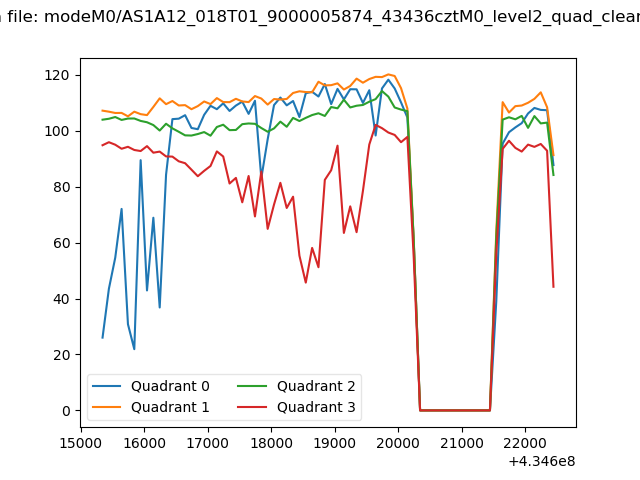 |
|
| Module-wise count rates for Quadrant A Data is divided into 100 sec bins |
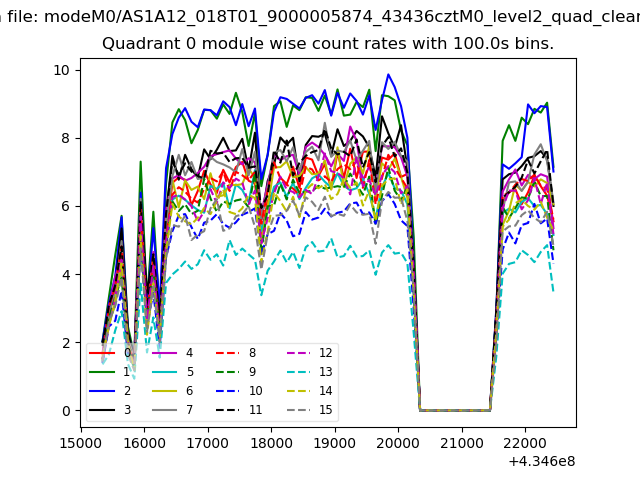 |
 |
| Module-wise count rates for Quadrant B Data is divided into 100 sec bins |
 |
 |
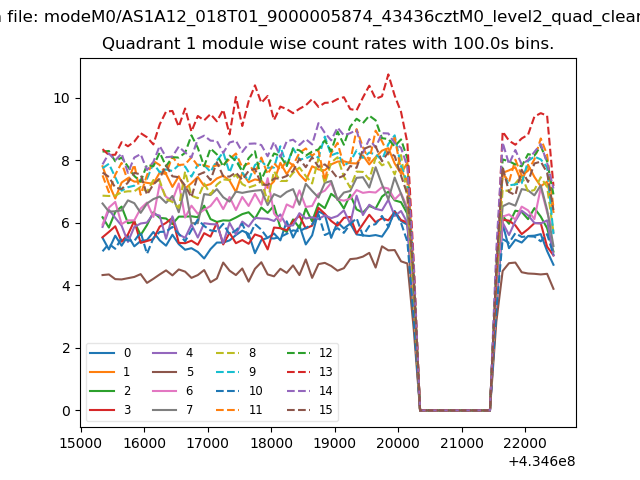
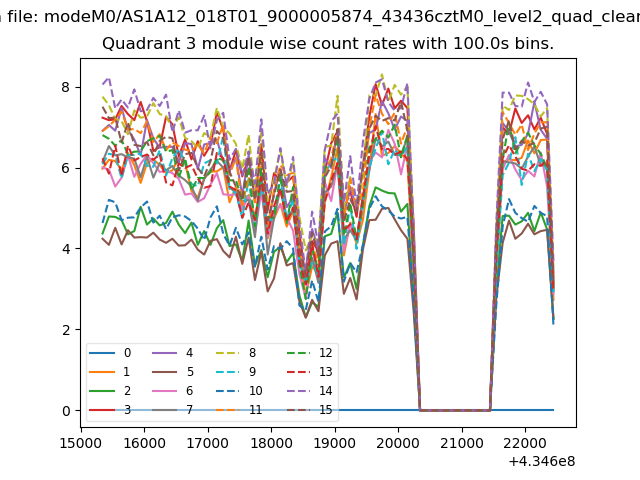
| Module-wise count rates for Quadrant C Data is divided into 100 sec bins |
 |
 |
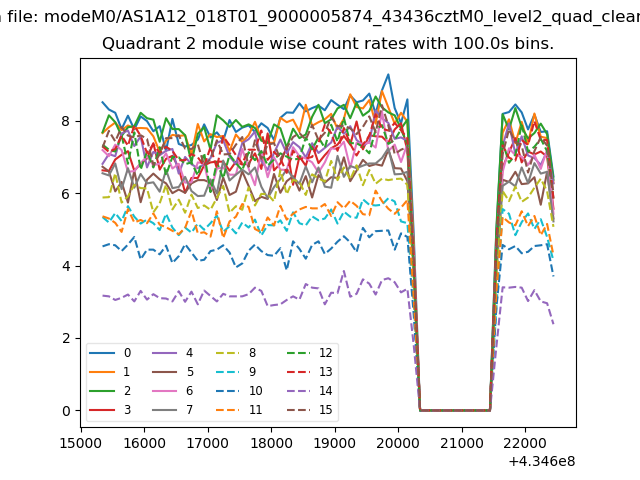
| Module-wise count rates for Quadrant D Data is divided into 100 sec bins |
 |
 |
| Parameter | Plot |
|---|---|
| CZT HV Monitor | 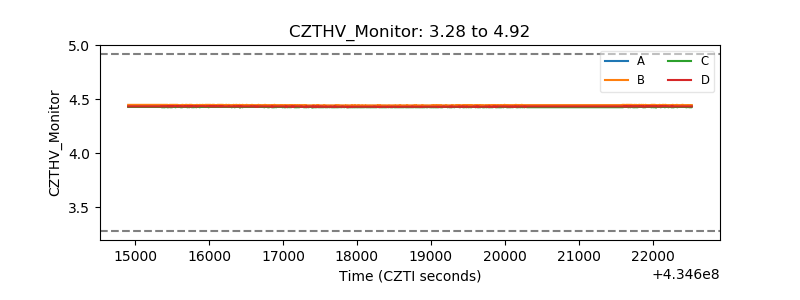 |
| D_VDD |  |
| Temperature 1 | 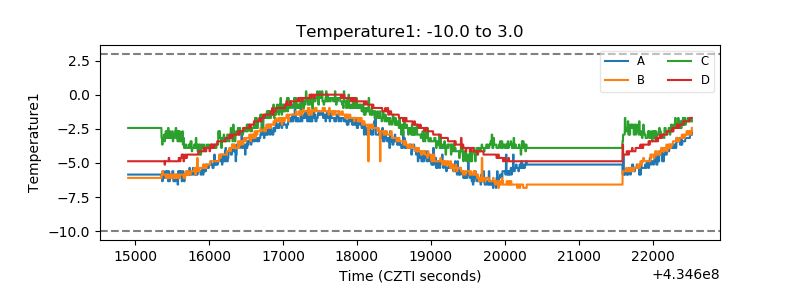 |
| Veto HV Monitor |  |
| Veto LLD | 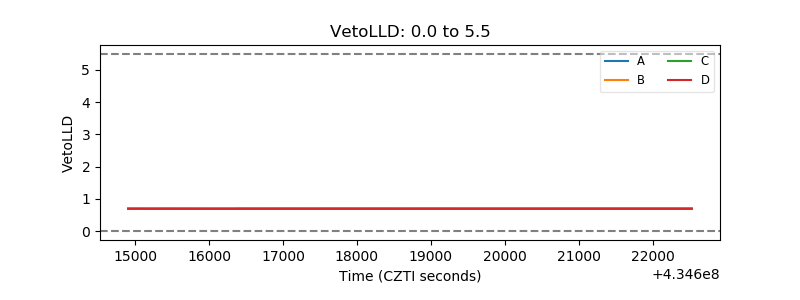 |
| Alpha Counter | 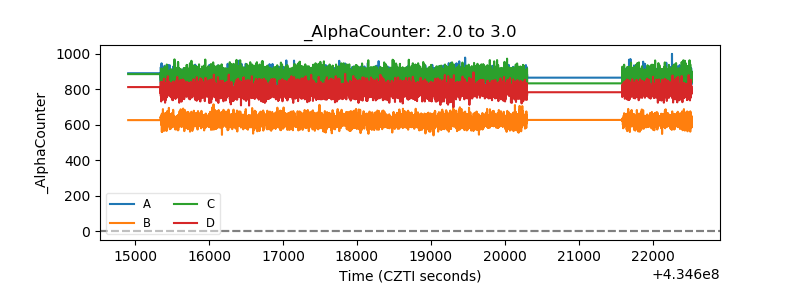 |
| _CPM_Rate | 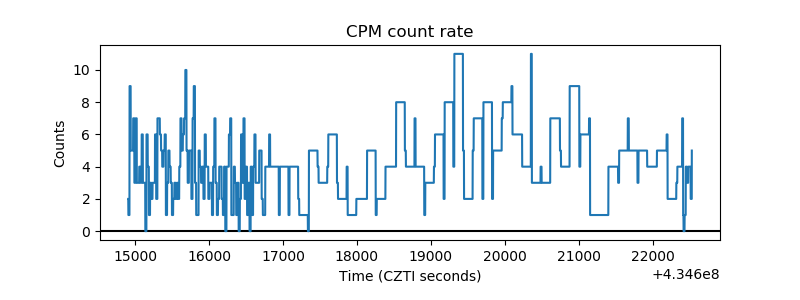 |
| CZT Counter | 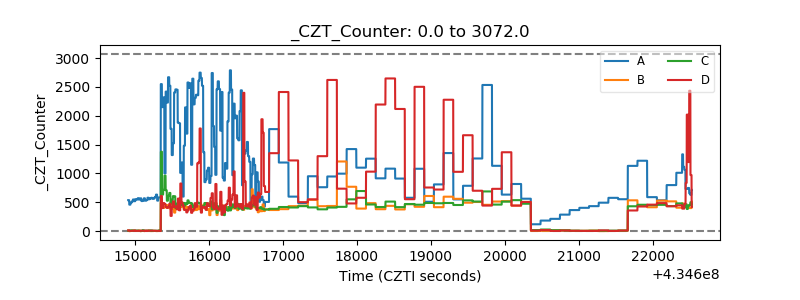 |
| +2.5 Volts monitor | 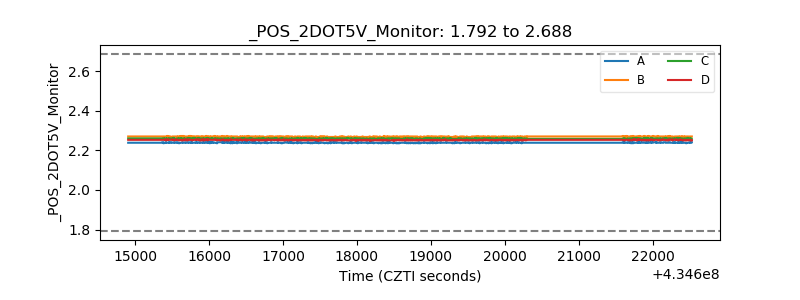 |
| +5 Volts monitor | 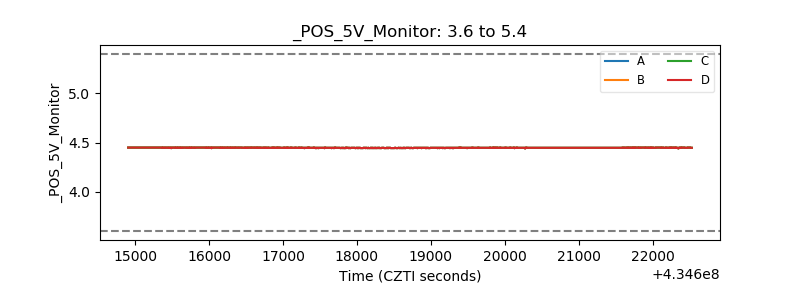 |
| _ROLL_ROT | 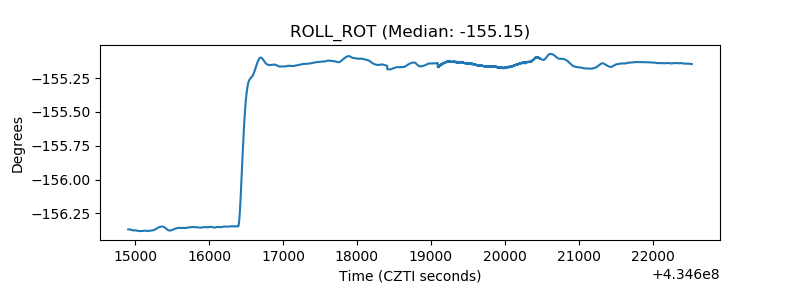 |
| _Roll_DEC | 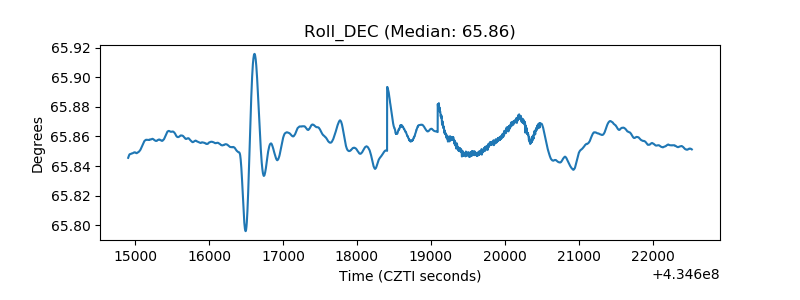 |
| _Roll_RA | 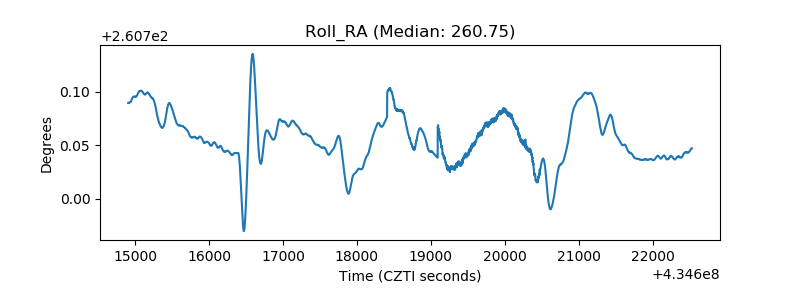 |
| Veto Counter | 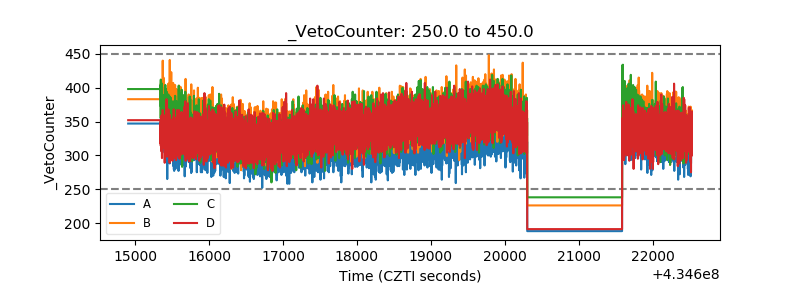 |