| Param | Original file | Final file |
|---|---|---|
| Filename | modeM0/AS1A12_018T01_9000005874_43439cztM0_level2.fits | modeM0/AS1A12_018T01_9000005874_43439cztM0_level2_quad_clean.evt |
| Size (bytes) | 985,515,840 | 160,021,440 |
| Size | 939.9 MB | 152.6 MB |
| Events in quadrant A | 15,901,439 | 754,395 |
| Events in quadrant B | 5,649,886 | 1,212,559 |
| Events in quadrant C | 5,174,320 | 1,128,427 |
| Events in quadrant D | 8,906,549 | 990,595 |
| Mode M0 | |||
|---|---|---|---|
| Quadrant | BADHDUFLAG | Total packets | Discarded packets |
| A | 0 | 54918 | 17 |
| B | 0 | 23934 | 3 |
| C | 0 | 22426 | 3 |
| D | 0 | 34094 | 3 |
| Mode M9 | |||
|---|---|---|---|
| Quadrant | BADHDUFLAG | Total packets | Discarded packets |
| A | 0 | 29 | 0 |
| B | 0 | 30 | 0 |
| C | 0 | 30 | 0 |
| D | 0 | 30 | 0 |
| Mode SS | |||
|---|---|---|---|
| Quadrant | BADHDUFLAG | Total packets | Discarded packets |
| A | 0 | 224 | 0 |
| B | 0 | 224 | 0 |
| C | 0 | 224 | 0 |
| D | 0 | 224 | 0 |
| Quadrant | Total seconds | Saturated seconds | Saturation percentage |
|---|---|---|---|
| A | 10956 | 4338 | 39.594743% |
| B | 10958 | 46 | 0.419785% |
| C | 10958 | 7 | 0.063880% |
| D | 10958 | 768 | 7.008578% |
Noise dominated data is calculated using 1-second bins in cleaned event files. If a bin has >2000 counts, and if more than 50% of those come from <1% of pixels, then it is considered to be noise-dominated and hence unusable.
| Quadrant | # 1 sec bins | Bins with >0 counts | Bins with >2000 counts | High rate bins dominated by noise | Noise dominated (total time) | Noise dominated (detector-on time) | Marked lightcurve |
|---|---|---|---|---|---|---|---|
| A | 13644 | 10957 | 3586 | 3586 | 26.28% | 32.73% | 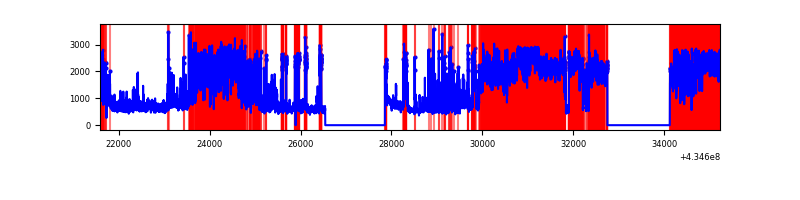 |
| B | 13645 | 10960 | 19 | 19 | 0.14% | 0.17% | 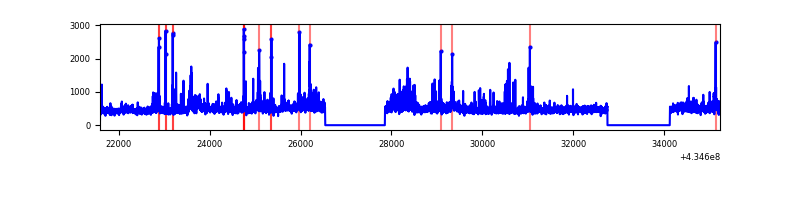 |
| C | 13645 | 10960 | 3 | 3 | 0.02% | 0.03% | 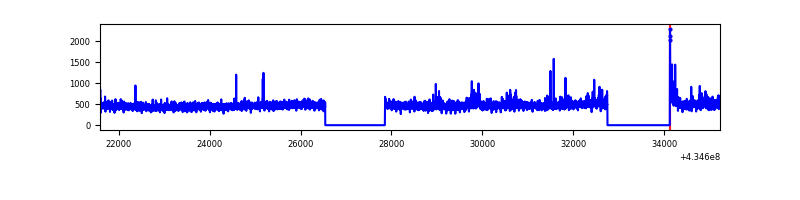 |
| D | 13645 | 10960 | 760 | 760 | 5.57% | 6.93% | 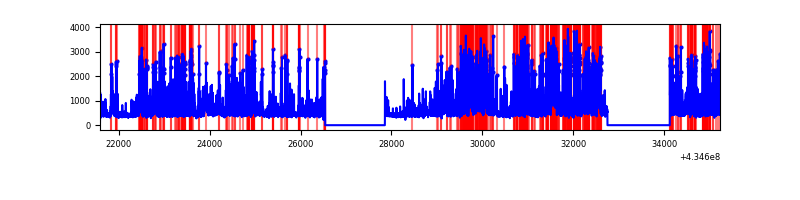 |
Top three noisy pixels from each quadrant. If the there are fewer than three noisy pixels in the level2.evt file, extra rows are filled as -1
| Pixel properties | Quadrant properties | ||||||
|---|---|---|---|---|---|---|---|
| Quadrant | DetID | PixID | Counts | Sigma | Mean | Median | Sigma |
| A | 15 | 222 | 9988083 | 52608.64 | 927 | 909 | 189.8 |
| A | 15 | 237 | 1339487 | 7051.12 | 927 | 909 | 189.8 |
| A | 10 | 83 | 931433 | 4901.65 | 927 | 909 | 189.8 |
| B | 0 | 199 | 381433 | 1690.37 | 1175 | 1143 | 225.0 |
| B | 0 | 189 | 250245 | 1107.25 | 1175 | 1143 | 225.0 |
| B | 0 | 229 | 107097 | 470.96 | 1175 | 1143 | 225.0 |
| C | 15 | 214 | 456275 | 1709.54 | 1147 | 1151 | 266.2 |
| C | 3 | 233 | 243475 | 910.22 | 1147 | 1151 | 266.2 |
| C | 13 | 61 | 7698 | 24.59 | 1147 | 1151 | 266.2 |
| D | 1 | 52 | 2509231 | 9206.63 | 1119 | 1086 | 272.4 |
| D | 2 | 16 | 727201 | 2665.35 | 1119 | 1086 | 272.4 |
| D | 13 | 249 | 505799 | 1852.65 | 1119 | 1086 | 272.4 |
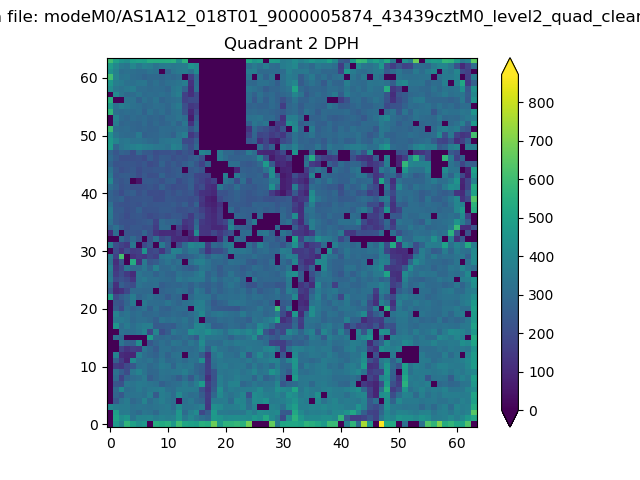
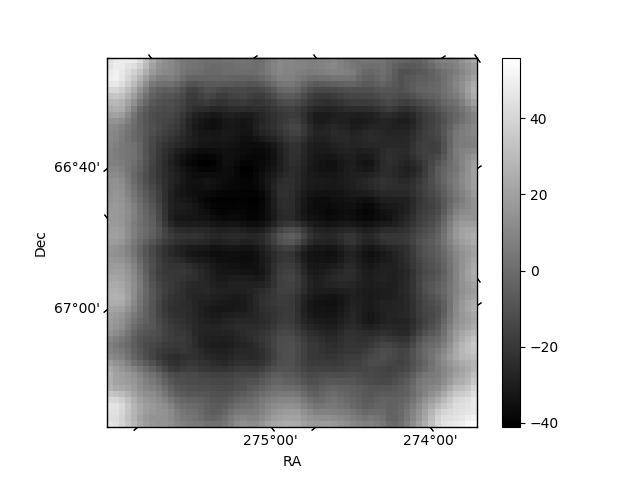
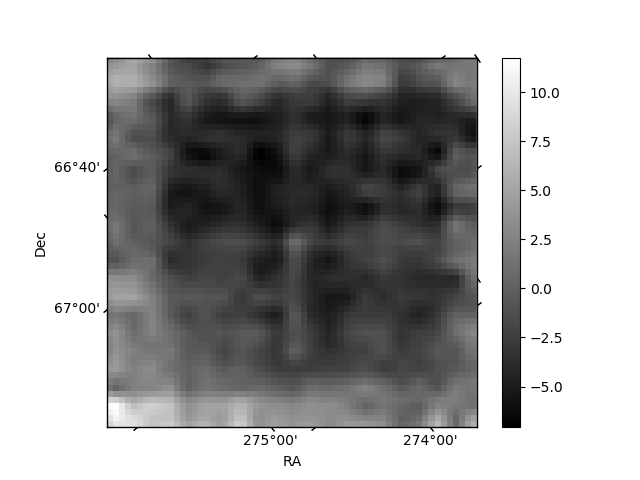
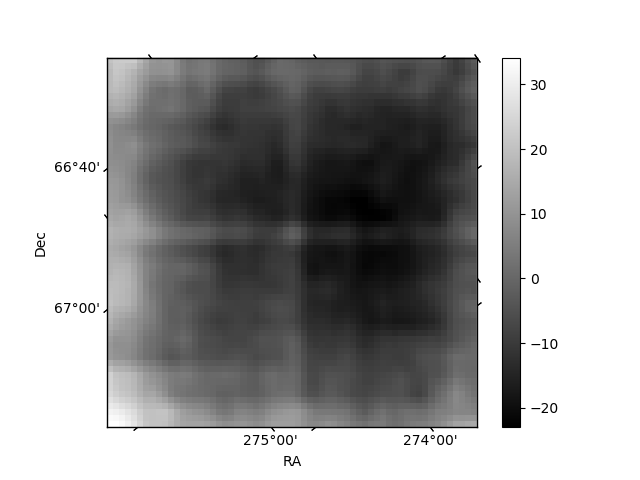
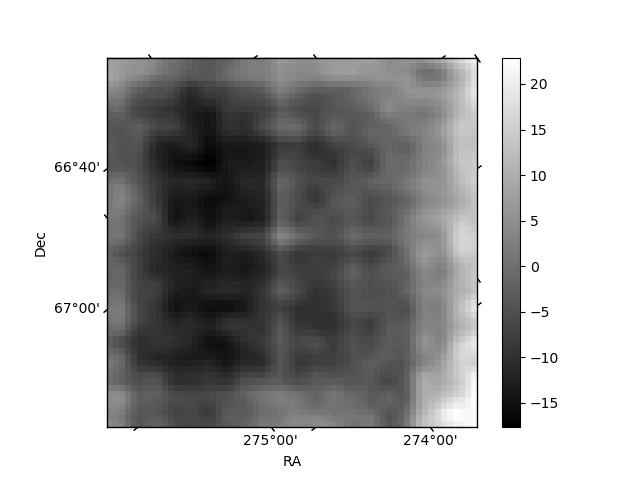
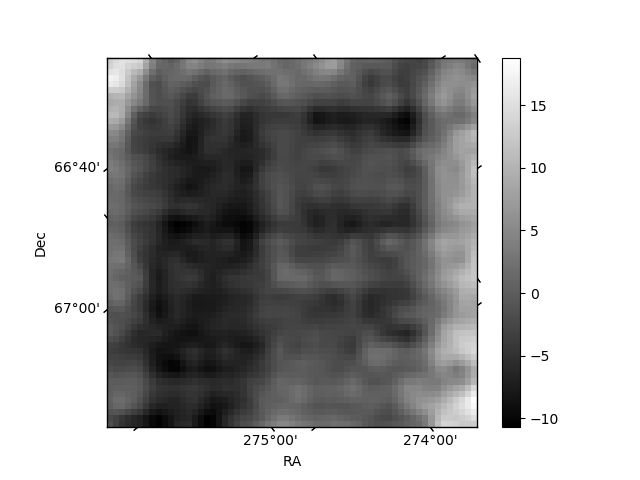
Histogram calculated using DETX and DETY for each event in the final _common_clean file
| Quadrant A | 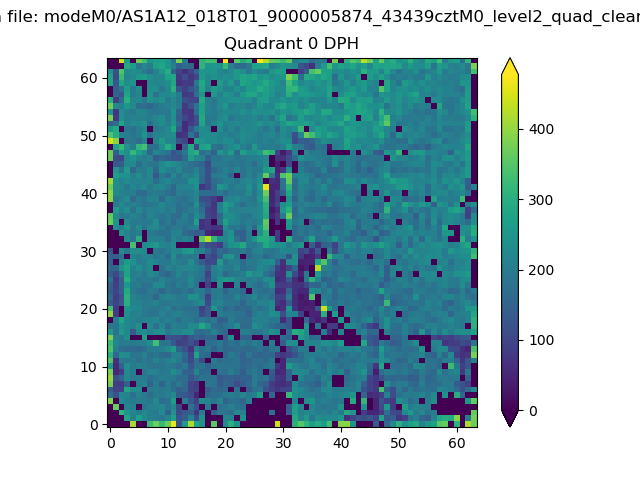 |
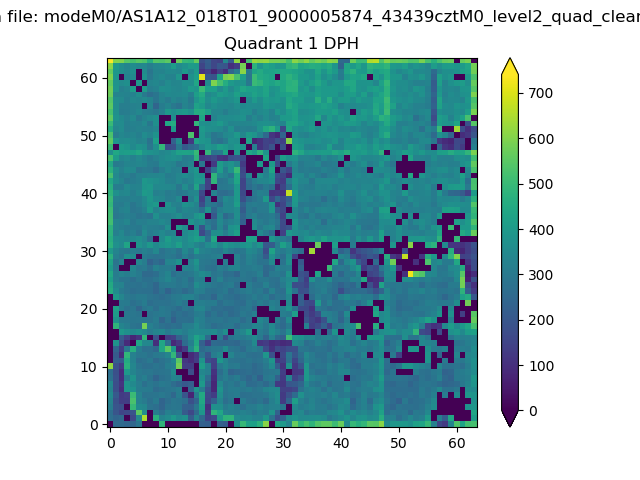 |
Quadrant B |
|---|---|---|---|
| Quadrant D | 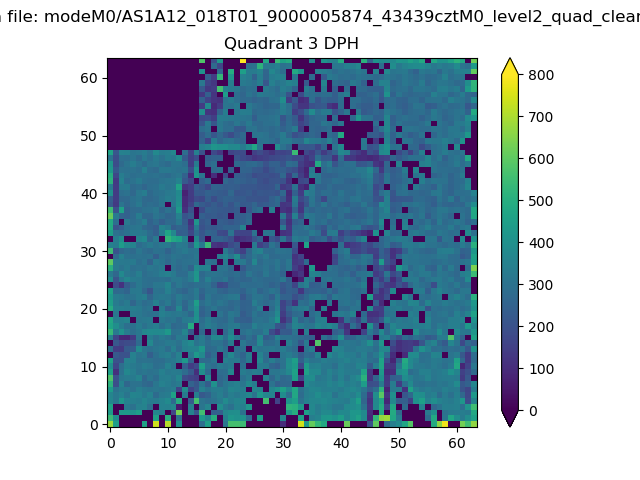 |
 |
Quadrant C |
| Plot type | Count rate plots | Images |
|---|---|---|
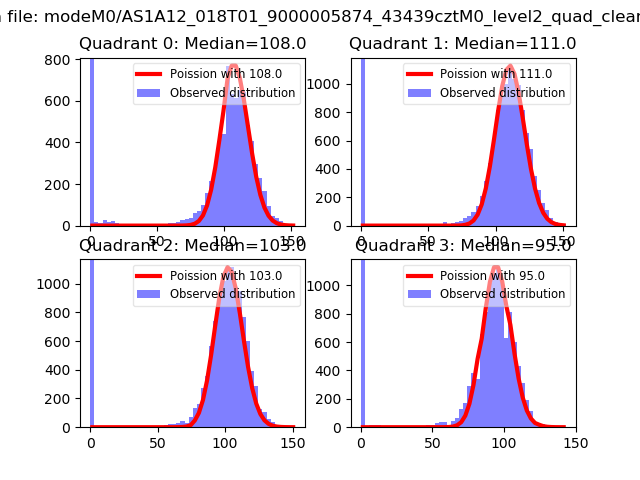
| Comparison with Poisson distribution Blue bars denote a histogram of data divided into 1 sec bins. Red curve is a Poisson curve with rate = median count rate of data. |
 |
 |
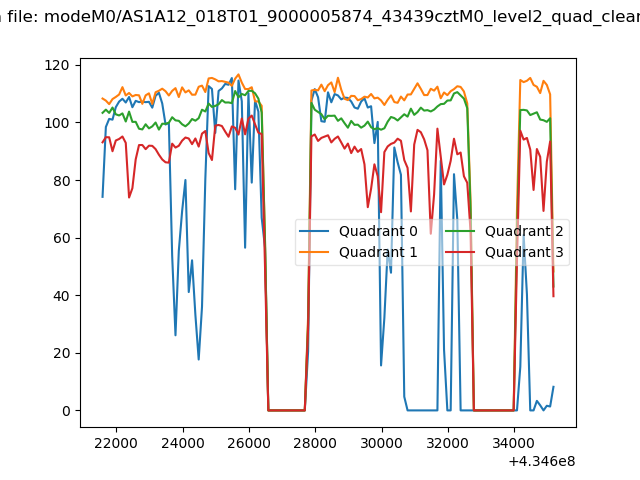
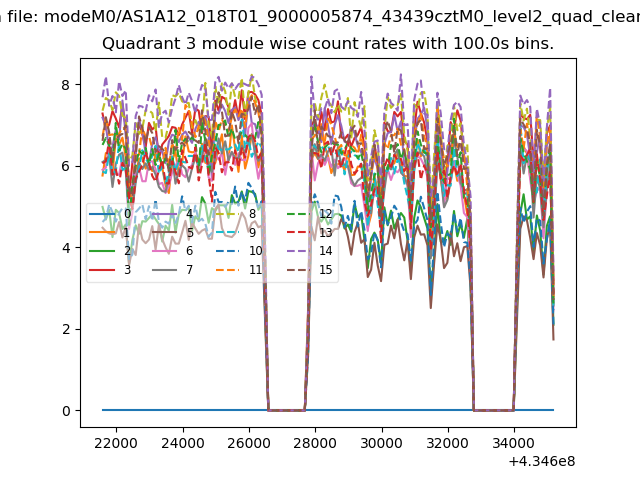
| Quadrant-wise count rates Data is divided into 100 sec bins |
 |
|
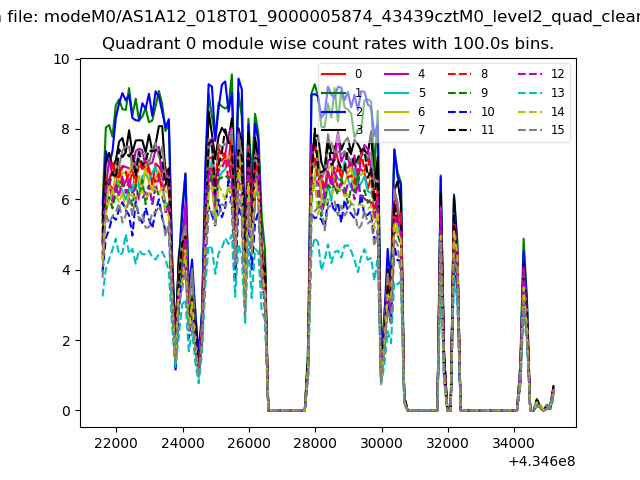
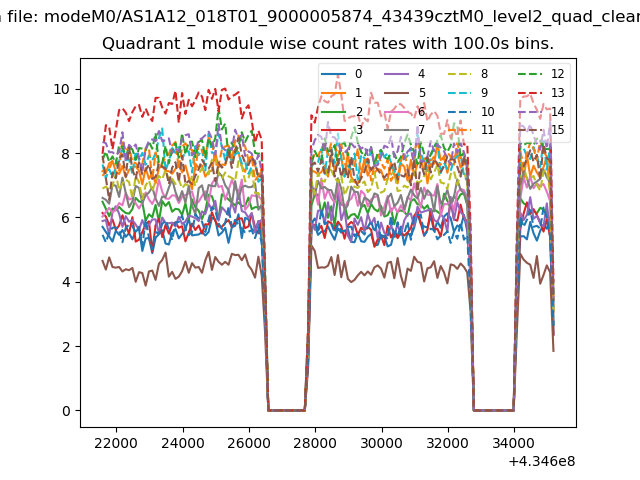
| Module-wise count rates for Quadrant A Data is divided into 100 sec bins |
 |
 |
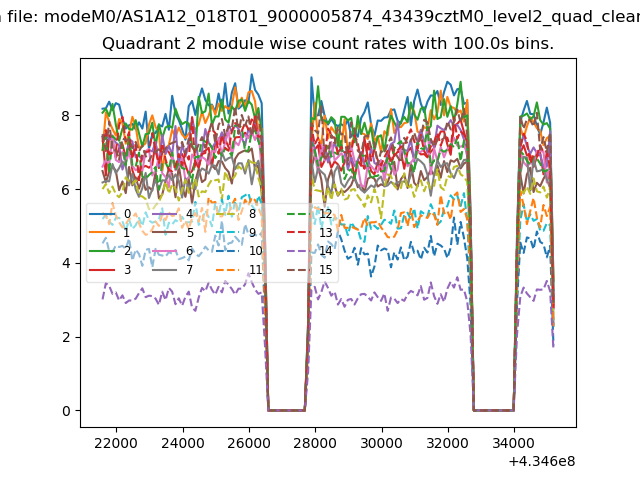
| Module-wise count rates for Quadrant B Data is divided into 100 sec bins |
 |
 |
| Module-wise count rates for Quadrant C Data is divided into 100 sec bins |
 |
 |
| Module-wise count rates for Quadrant D Data is divided into 100 sec bins |
 |
 |
| Parameter | Plot |
|---|---|
| CZT HV Monitor | 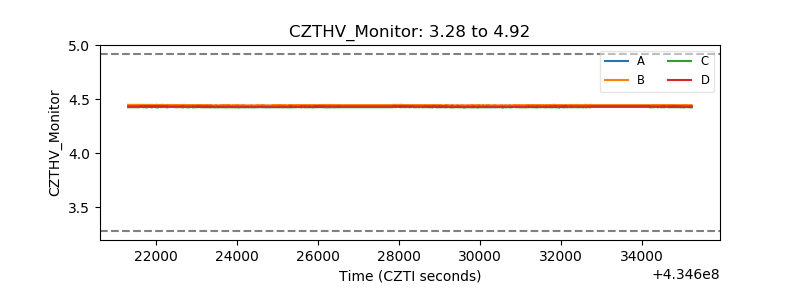 |
| D_VDD | 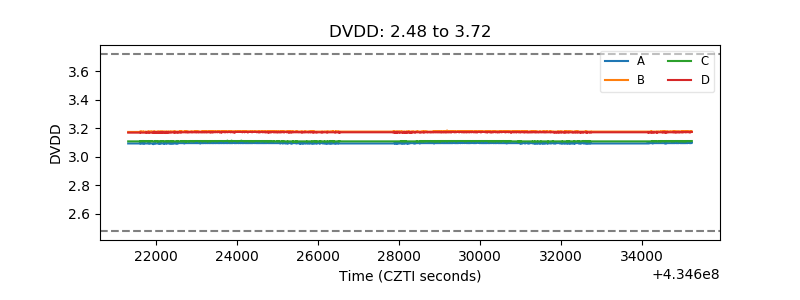 |
| Temperature 1 | 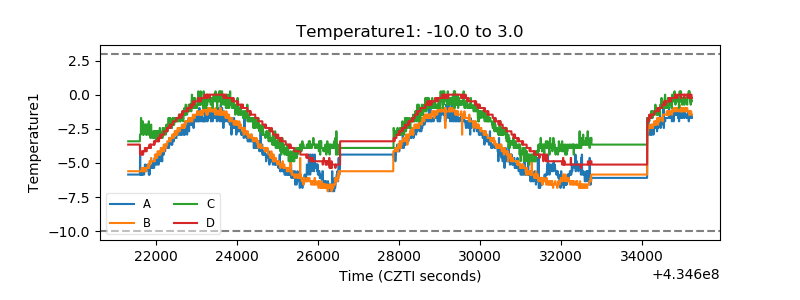 |
| Veto HV Monitor | 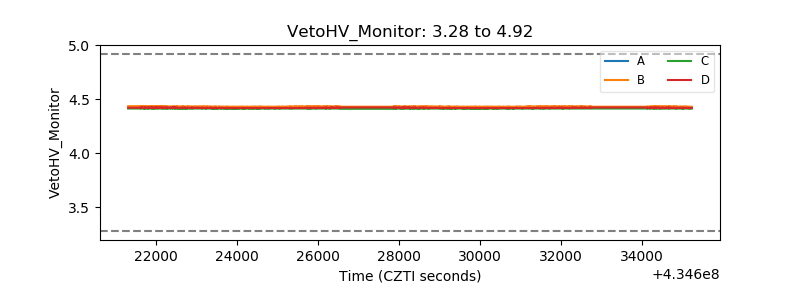 |
| Veto LLD | 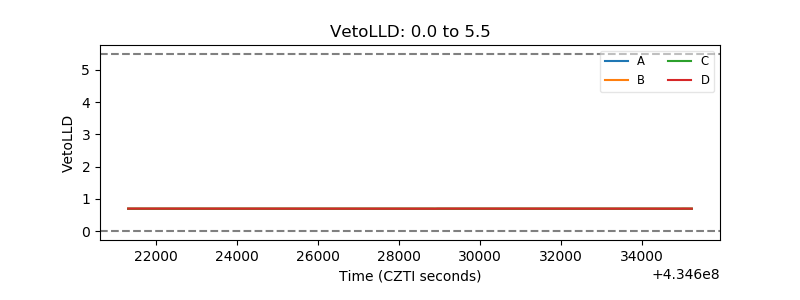 |
| Alpha Counter | 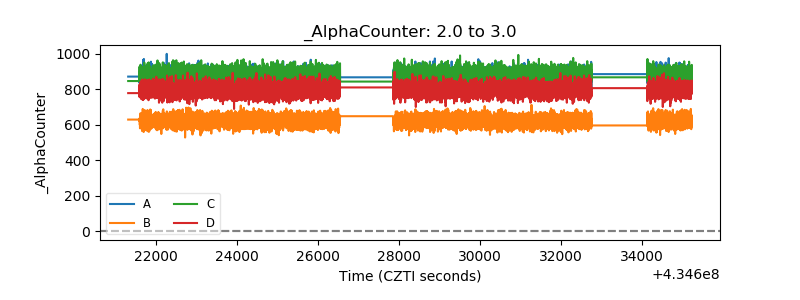 |
| _CPM_Rate | 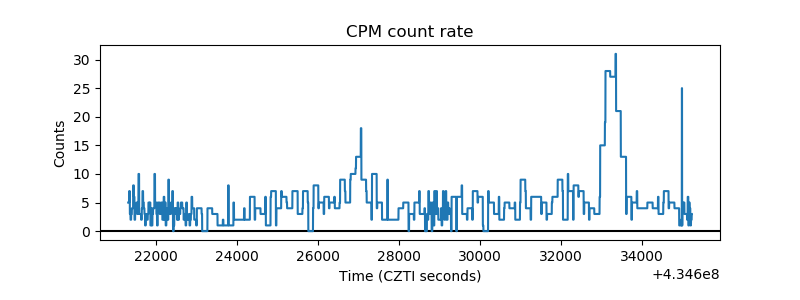 |
| CZT Counter | 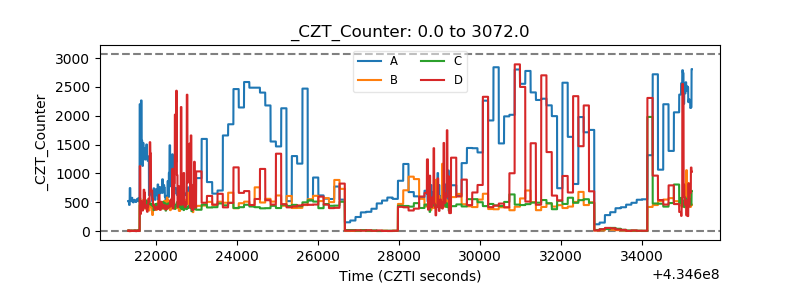 |
| +2.5 Volts monitor | 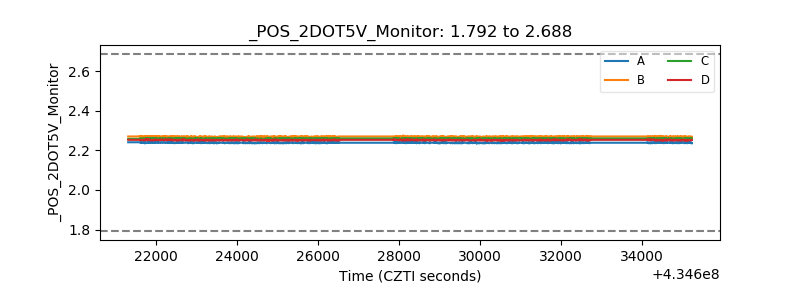 |
| +5 Volts monitor | 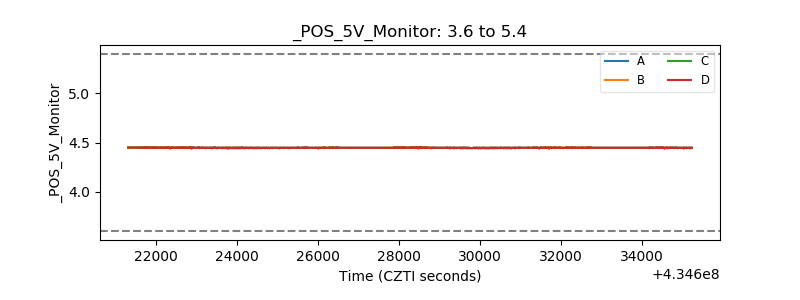 |
| _ROLL_ROT | 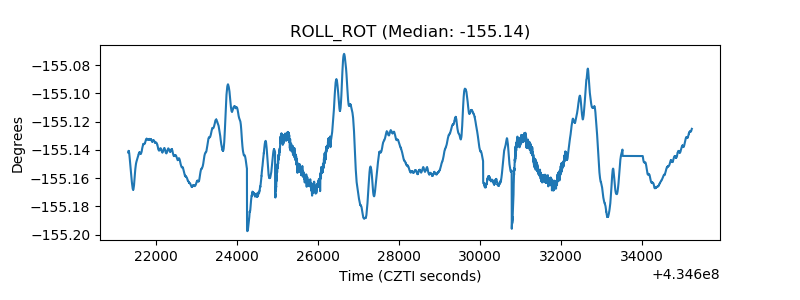 |
| _Roll_DEC | 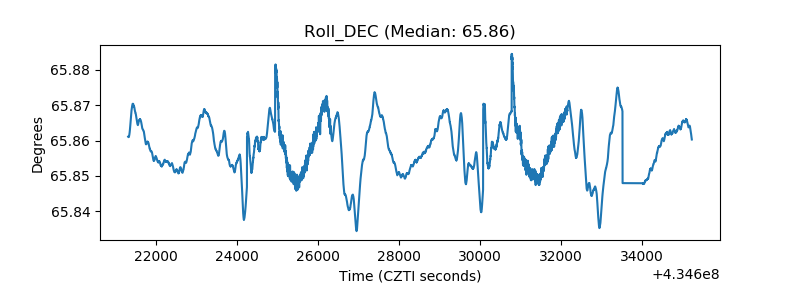 |
| _Roll_RA | 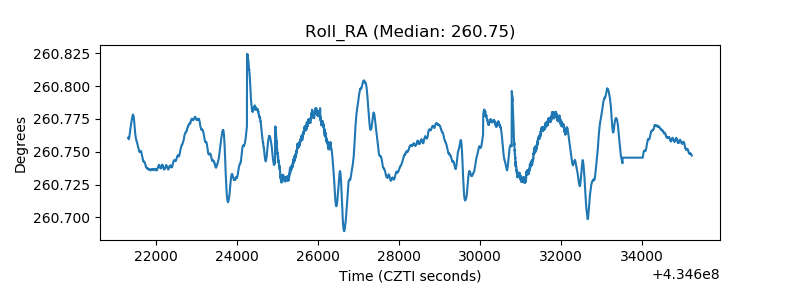 |
| Veto Counter | 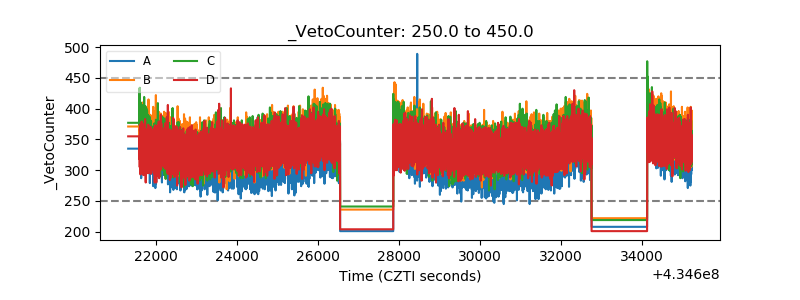 |