| Param | Original file | Final file |
|---|---|---|
| Filename | modeM0/AS1A12_018T01_9000005874_43440cztM0_level2.fits | modeM0/AS1A12_018T01_9000005874_43440cztM0_level2_quad_clean.evt |
| Size (bytes) | 992,499,840 | 136,612,800 |
| Size | 946.5 MB | 130.3 MB |
| Events in quadrant A | 17,690,158 | 505,058 |
| Events in quadrant B | 4,761,796 | 1,067,690 |
| Events in quadrant C | 4,677,270 | 1,006,296 |
| Events in quadrant D | 8,851,951 | 878,345 |
| Mode M0 | |||
|---|---|---|---|
| Quadrant | BADHDUFLAG | Total packets | Discarded packets |
| A | 0 | 59394 | 4 |
| B | 0 | 20748 | 2 |
| C | 0 | 20088 | 2 |
| D | 0 | 33074 | 2 |
| Mode M9 | |||
|---|---|---|---|
| Quadrant | BADHDUFLAG | Total packets | Discarded packets |
| A | 0 | 31 | 0 |
| B | 0 | 31 | 0 |
| C | 0 | 31 | 0 |
| D | 0 | 31 | 0 |
| Mode SS | |||
|---|---|---|---|
| Quadrant | BADHDUFLAG | Total packets | Discarded packets |
| A | 0 | 200 | 0 |
| B | 0 | 200 | 0 |
| C | 0 | 200 | 0 |
| D | 0 | 200 | 0 |
| Quadrant | Total seconds | Saturated seconds | Saturation percentage |
|---|---|---|---|
| A | 9784 | 5502 | 56.234669% |
| B | 9785 | 45 | 0.459888% |
| C | 9785 | 4 | 0.040879% |
| D | 9785 | 809 | 8.267757% |
Noise dominated data is calculated using 1-second bins in cleaned event files. If a bin has >2000 counts, and if more than 50% of those come from <1% of pixels, then it is considered to be noise-dominated and hence unusable.
| Quadrant | # 1 sec bins | Bins with >0 counts | Bins with >2000 counts | High rate bins dominated by noise | Noise dominated (total time) | Noise dominated (detector-on time) | Marked lightcurve |
|---|---|---|---|---|---|---|---|
| A | 12920 | 9785 | 5052 | 5052 | 39.10% | 51.63% | 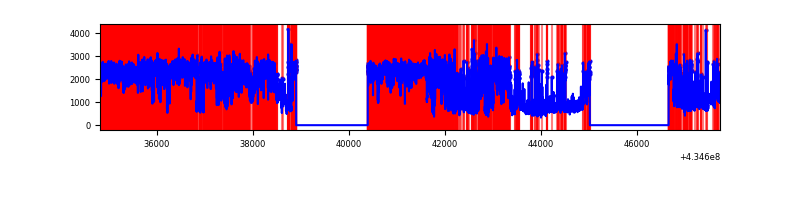 |
| B | 12921 | 9787 | 24 | 24 | 0.19% | 0.25% | 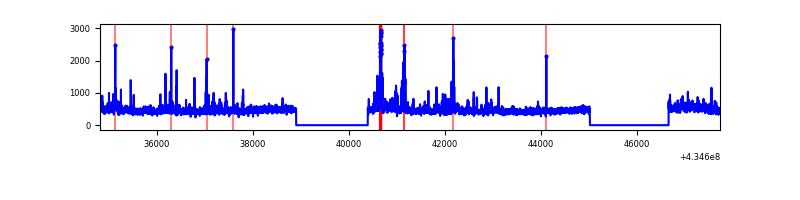 |
| C | 12921 | 9787 | 1 | 1 | 0.01% | 0.01% | 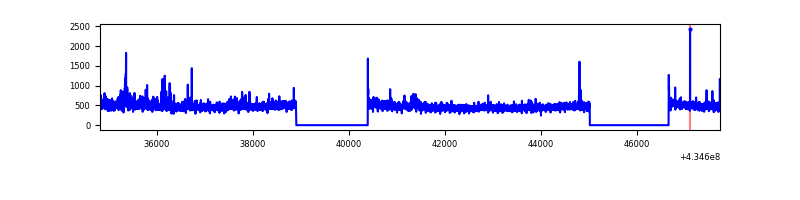 |
| D | 12921 | 9787 | 775 | 775 | 6.00% | 7.92% | 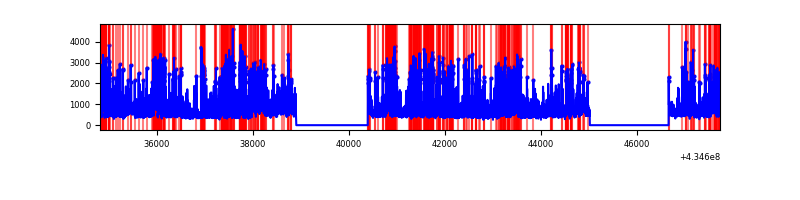 |
Top three noisy pixels from each quadrant. If the there are fewer than three noisy pixels in the level2.evt file, extra rows are filled as -1
| Pixel properties | Quadrant properties | ||||||
|---|---|---|---|---|---|---|---|
| Quadrant | DetID | PixID | Counts | Sigma | Mean | Median | Sigma |
| A | 15 | 222 | 13512914 | 87222.06 | 762 | 747 | 154.9 |
| A | 10 | 83 | 705588 | 4549.8 | 762 | 747 | 154.9 |
| A | 15 | 237 | 486702 | 3136.88 | 762 | 747 | 154.9 |
| B | 0 | 189 | 199333 | 996.22 | 1039 | 1010 | 199.1 |
| B | 0 | 199 | 165215 | 824.84 | 1039 | 1010 | 199.1 |
| B | 15 | 85 | 84222 | 417.99 | 1039 | 1010 | 199.1 |
| C | 15 | 214 | 401657 | 1705.68 | 1019 | 1022 | 234.9 |
| C | 3 | 233 | 274232 | 1163.18 | 1019 | 1022 | 234.9 |
| C | 15 | 159 | 15159 | 60.19 | 1019 | 1022 | 234.9 |
| D | 1 | 52 | 2912401 | 12135.02 | 987 | 959 | 239.9 |
| D | 2 | 16 | 592642 | 2466.16 | 987 | 959 | 239.9 |
| D | 13 | 249 | 413886 | 1721.1 | 987 | 959 | 239.9 |
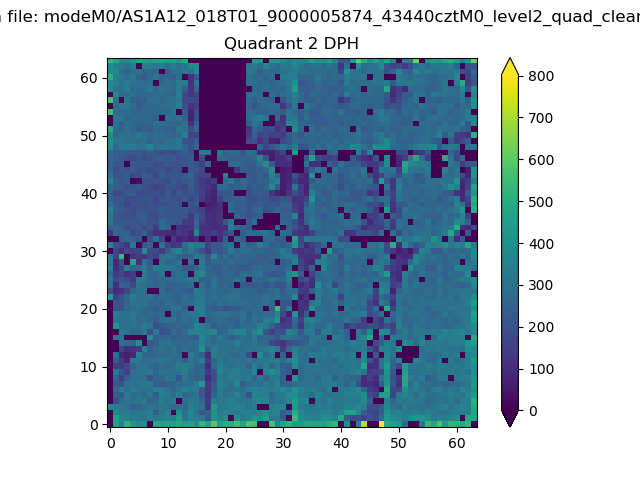
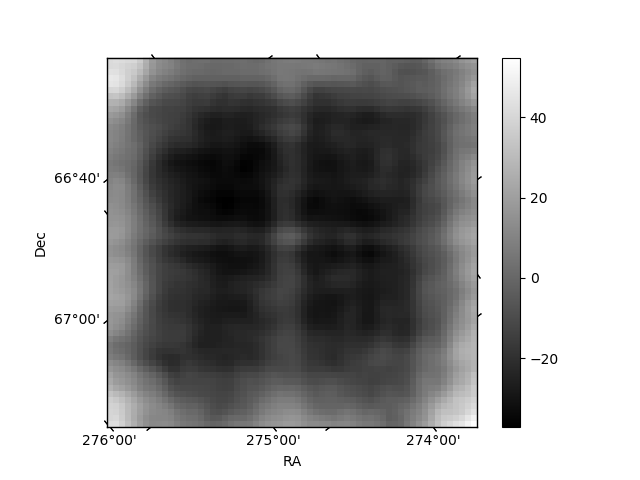
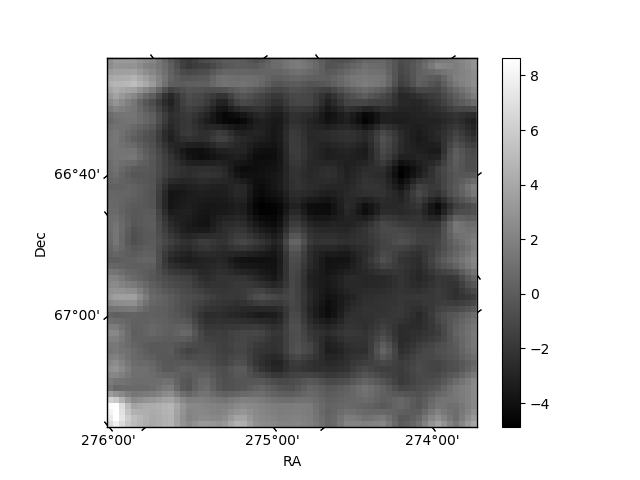
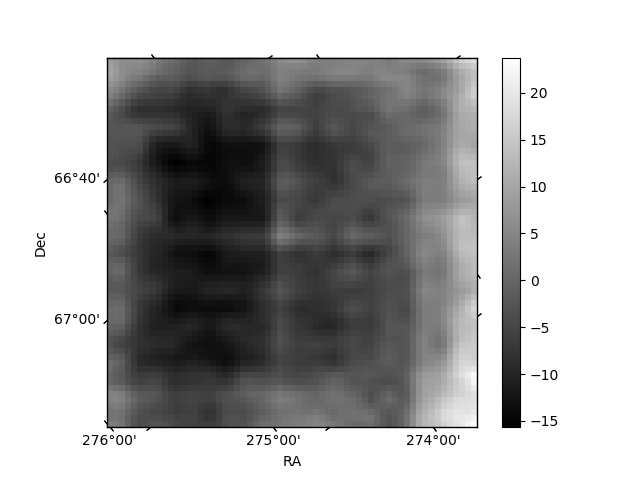
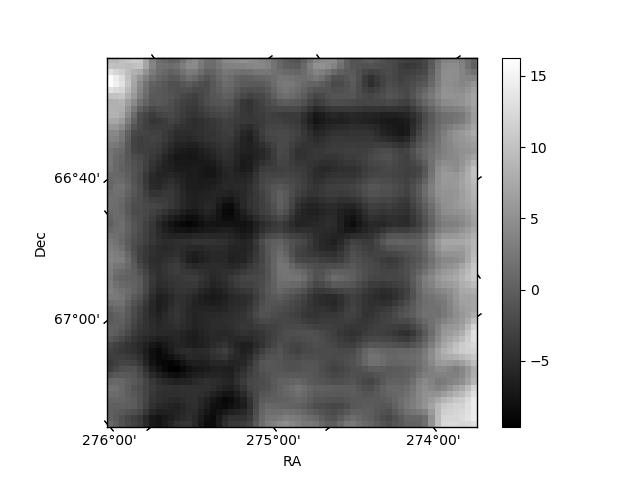
Histogram calculated using DETX and DETY for each event in the final _common_clean file
| Quadrant A | 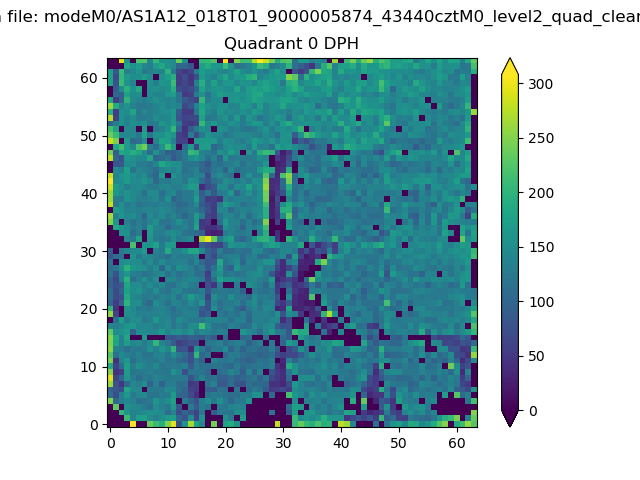 |
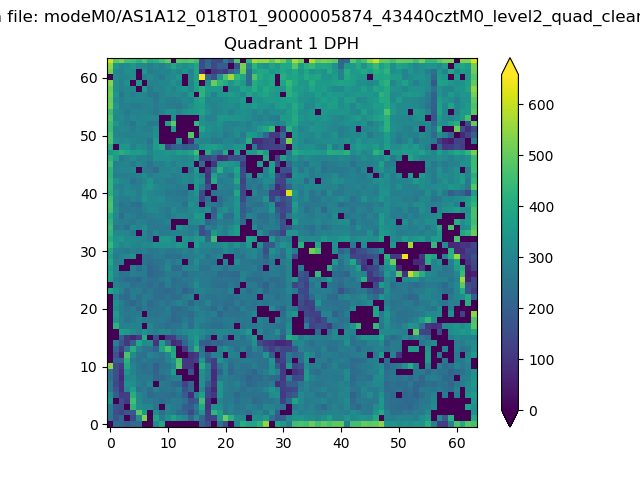 |
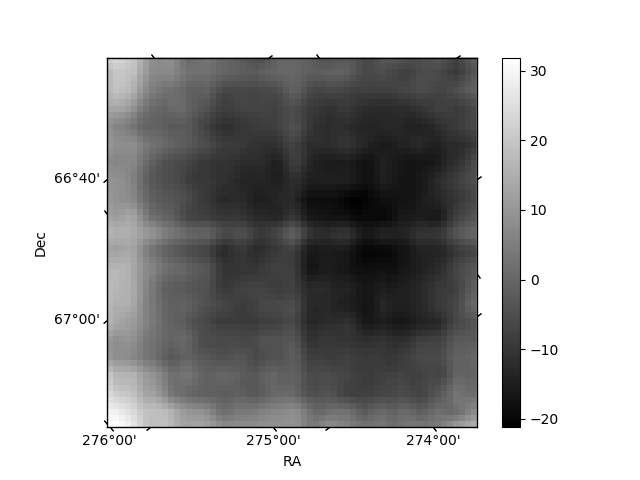
Quadrant B |
|---|---|---|---|
| Quadrant D | 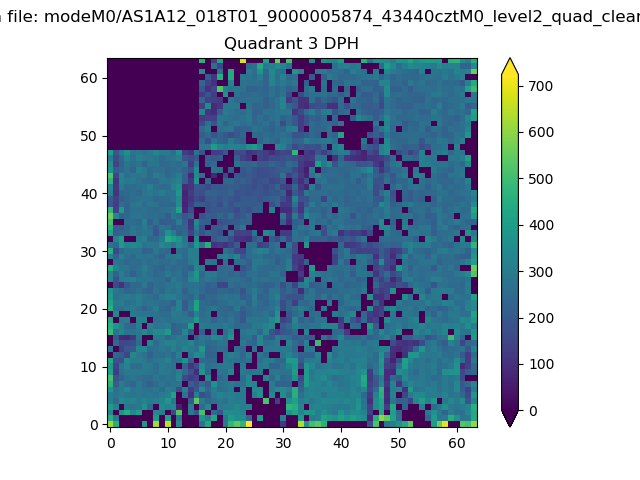 |
 |
Quadrant C |
| Plot type | Count rate plots | Images |
|---|---|---|
| Comparison with Poisson distribution Blue bars denote a histogram of data divided into 1 sec bins. Red curve is a Poisson curve with rate = median count rate of data. |
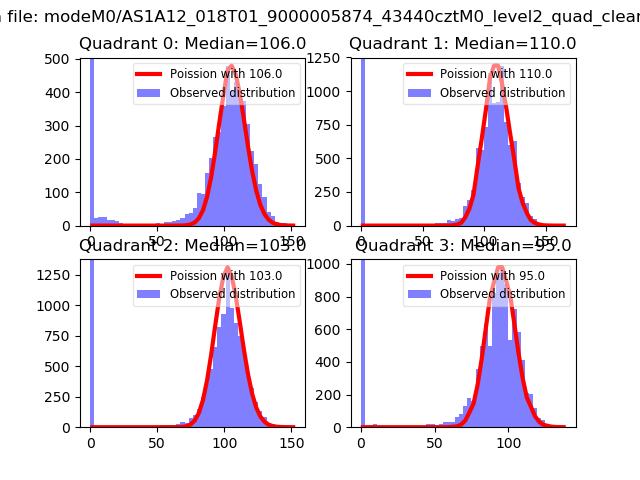 |
 |
| Quadrant-wise count rates Data is divided into 100 sec bins |
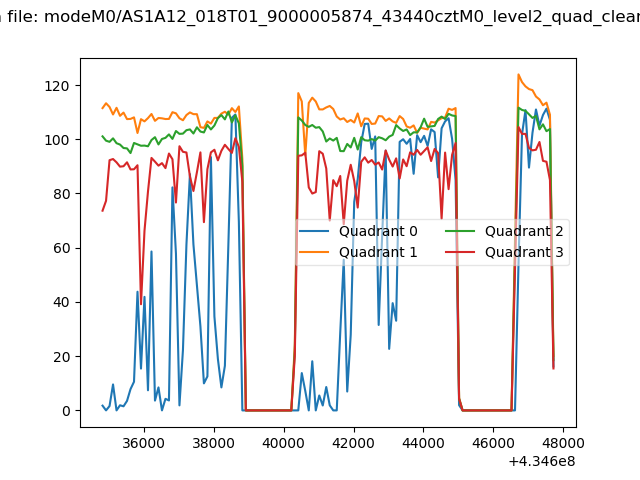 |
|
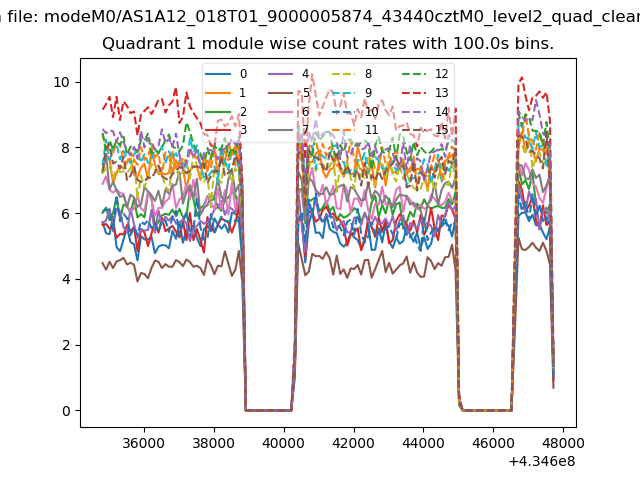
| Module-wise count rates for Quadrant A Data is divided into 100 sec bins |
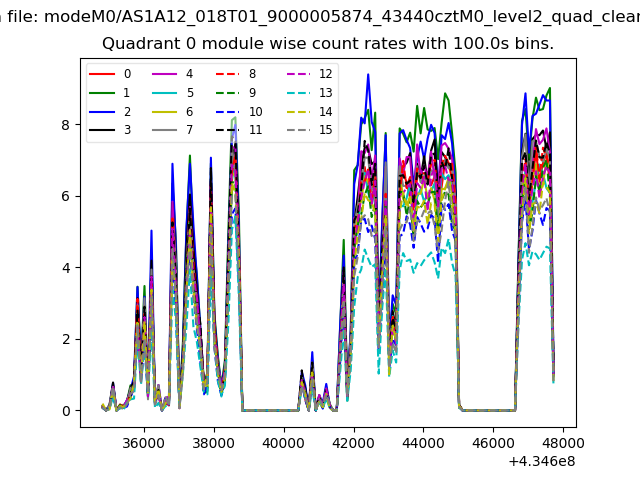 |
 |
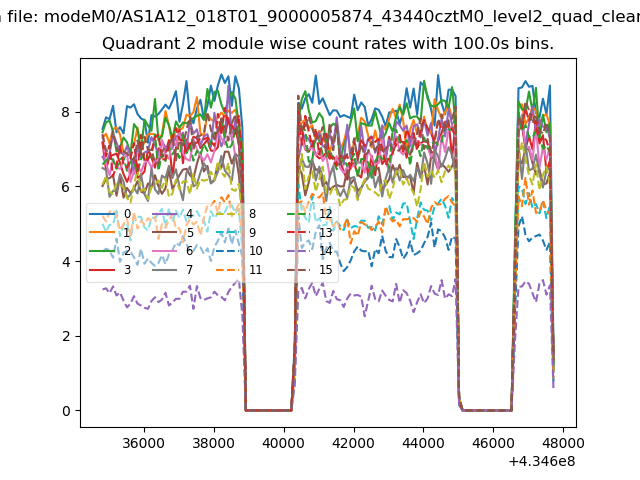
| Module-wise count rates for Quadrant B Data is divided into 100 sec bins |
 |
 |
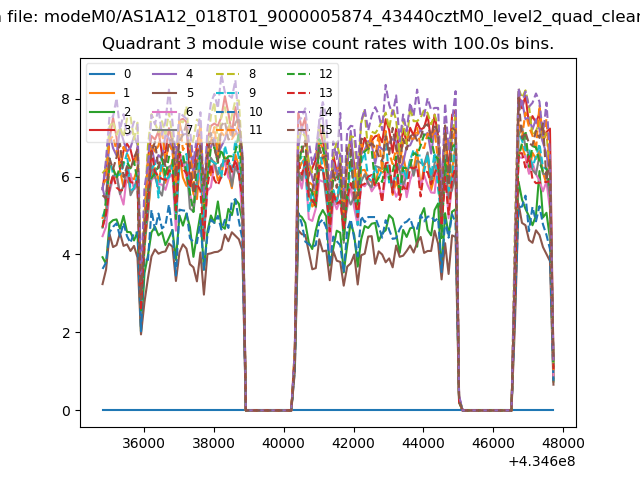
| Module-wise count rates for Quadrant C Data is divided into 100 sec bins |
 |
 |
| Module-wise count rates for Quadrant D Data is divided into 100 sec bins |
 |
 |
| Parameter | Plot |
|---|---|
| CZT HV Monitor |  |
| D_VDD | 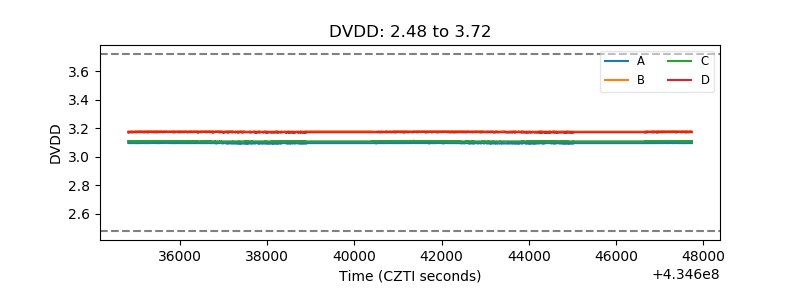 |
| Temperature 1 | 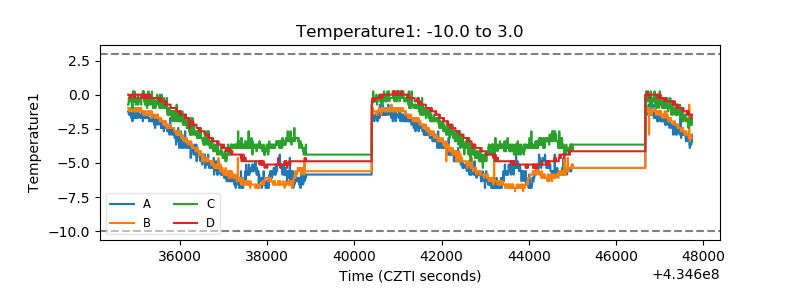 |
| Veto HV Monitor | 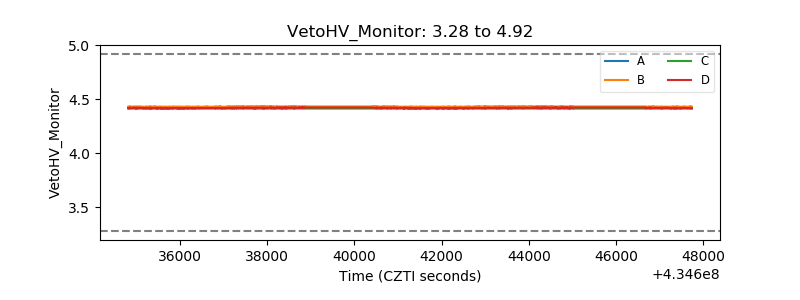 |
| Veto LLD | 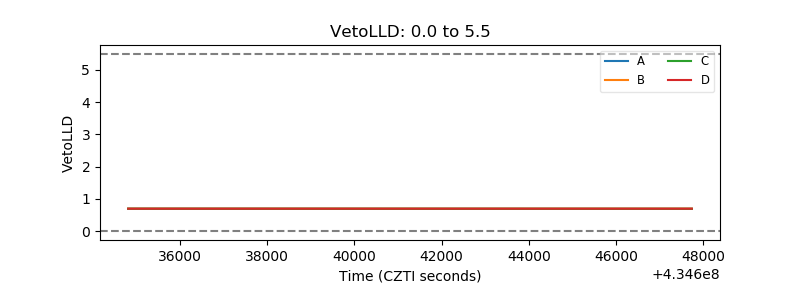 |
| Alpha Counter | 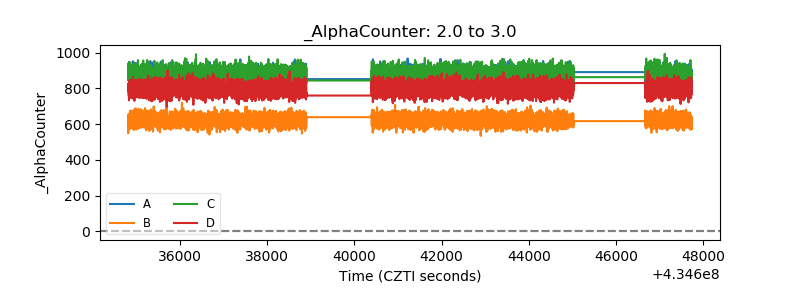 |
| _CPM_Rate | 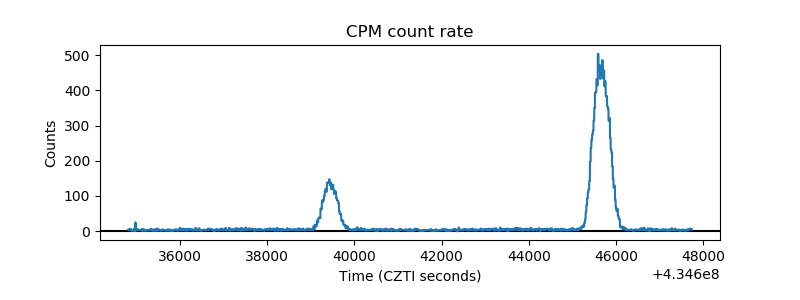 |
| CZT Counter | 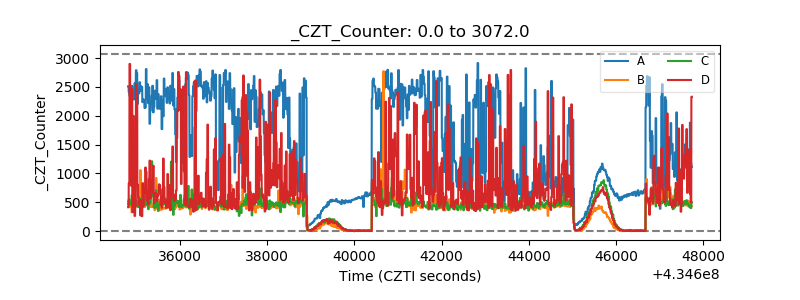 |
| +2.5 Volts monitor | 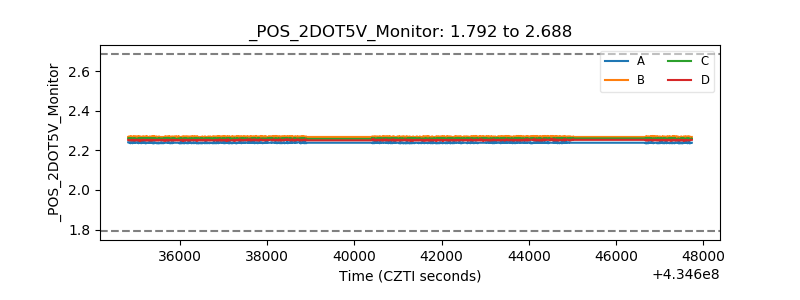 |
| +5 Volts monitor | 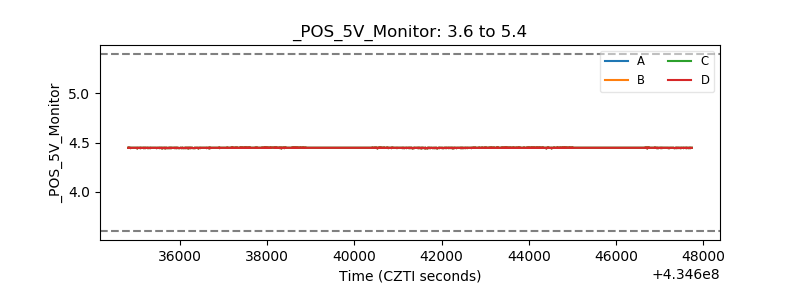 |
| _ROLL_ROT | 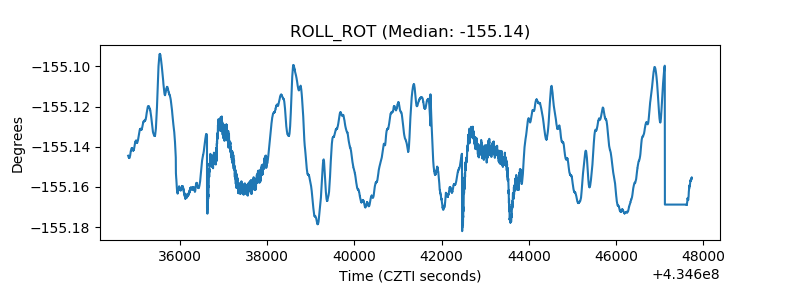 |
| _Roll_DEC | 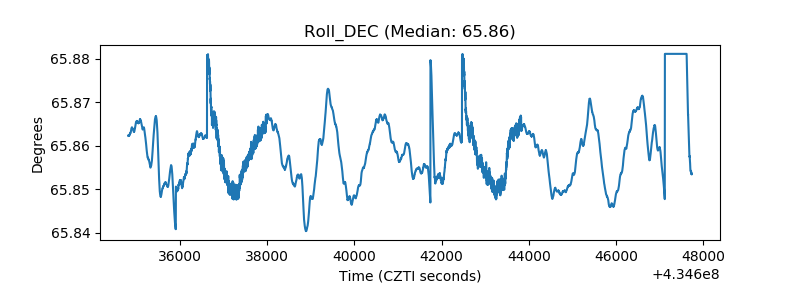 |
| _Roll_RA | 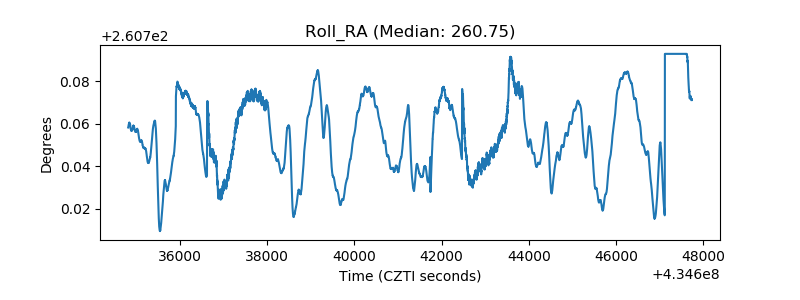 |
| Veto Counter |  |