| Param | Original file | Final file |
|---|---|---|
| Filename | modeM0/AS1A12_018T01_9000005874_43442cztM0_level2.fits | modeM0/AS1A12_018T01_9000005874_43442cztM0_level2_quad_clean.evt |
| Size (bytes) | 511,741,440 | 78,183,360 |
| Size | 488.0 MB | 74.6 MB |
| Events in quadrant A | 8,590,123 | 287,087 |
| Events in quadrant B | 2,685,670 | 611,597 |
| Events in quadrant C | 2,519,948 | 582,669 |
| Events in quadrant D | 4,726,985 | 508,014 |
| Mode M0 | |||
|---|---|---|---|
| Quadrant | BADHDUFLAG | Total packets | Discarded packets |
| A | 0 | 29275 | 1 |
| B | 0 | 11631 | 1 |
| C | 0 | 10985 | 1 |
| D | 0 | 17789 | 1 |
| Mode M9 | |||
|---|---|---|---|
| Quadrant | BADHDUFLAG | Total packets | Discarded packets |
| A | 0 | 17 | 0 |
| B | 0 | 17 | 0 |
| C | 0 | 17 | 0 |
| D | 0 | 17 | 0 |
| Mode SS | |||
|---|---|---|---|
| Quadrant | BADHDUFLAG | Total packets | Discarded packets |
| A | 0 | 110 | 0 |
| B | 0 | 110 | 0 |
| C | 0 | 110 | 0 |
| D | 0 | 110 | 0 |
| Quadrant | Total seconds | Saturated seconds | Saturation percentage |
|---|---|---|---|
| A | 5395 | 2942 | 54.531974% |
| B | 5395 | 25 | 0.463392% |
| C | 5395 | 5 | 0.092678% |
| D | 5396 | 420 | 7.783543% |
Noise dominated data is calculated using 1-second bins in cleaned event files. If a bin has >2000 counts, and if more than 50% of those come from <1% of pixels, then it is considered to be noise-dominated and hence unusable.
| Quadrant | # 1 sec bins | Bins with >0 counts | Bins with >2000 counts | High rate bins dominated by noise | Noise dominated (total time) | Noise dominated (detector-on time) | Marked lightcurve |
|---|---|---|---|---|---|---|---|
| A | 7127 | 5394 | 1848 | 1848 | 25.93% | 34.26% | 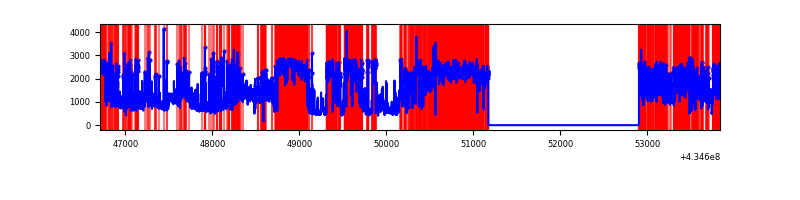 |
| B | 7128 | 5396 | 20 | 20 | 0.28% | 0.37% | 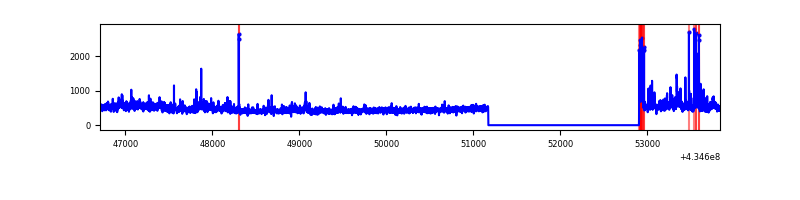 |
| C | 7128 | 5396 | 2 | 2 | 0.03% | 0.04% | 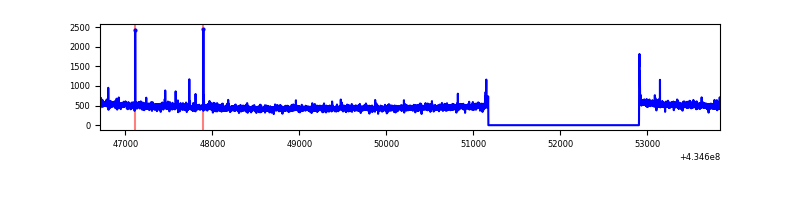 |
| D | 7129 | 5397 | 396 | 396 | 5.55% | 7.34% | 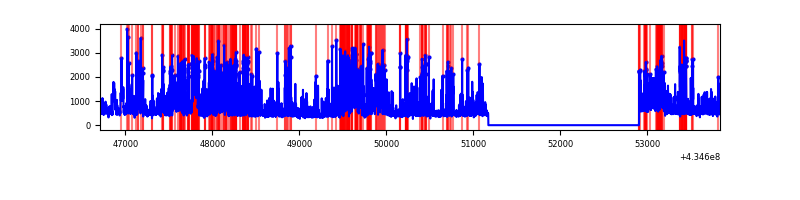 |
Top three noisy pixels from each quadrant. If the there are fewer than three noisy pixels in the level2.evt file, extra rows are filled as -1
| Pixel properties | Quadrant properties | ||||||
|---|---|---|---|---|---|---|---|
| Quadrant | DetID | PixID | Counts | Sigma | Mean | Median | Sigma |
| A | 15 | 222 | 6836046 | 105627.92 | 312 | 305 | 64.7 |
| A | 10 | 83 | 335208 | 5175.02 | 312 | 305 | 64.7 |
| A | 15 | 237 | 186471 | 2876.69 | 312 | 305 | 64.7 |
| B | 0 | 189 | 145675 | 1295.12 | 580 | 564 | 112.0 |
| B | 0 | 199 | 84641 | 750.39 | 580 | 564 | 112.0 |
| B | 0 | 190 | 70788 | 626.75 | 580 | 564 | 112.0 |
| C | 15 | 214 | 223479 | 1684.25 | 571 | 576 | 132.3 |
| C | 3 | 233 | 50496 | 377.19 | 571 | 576 | 132.3 |
| C | 15 | 159 | 10849 | 77.62 | 571 | 576 | 132.3 |
| D | 1 | 52 | 1202551 | 8994.32 | 553 | 536 | 133.6 |
| D | 2 | 16 | 258369 | 1929.29 | 553 | 536 | 133.6 |
| D | 2 | 249 | 222805 | 1663.17 | 553 | 536 | 133.6 |
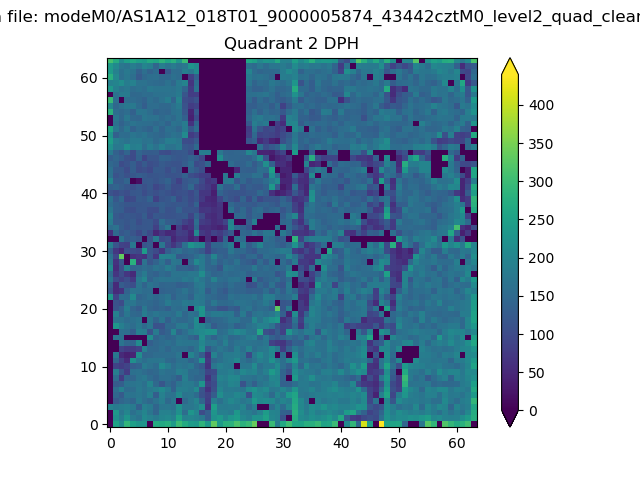
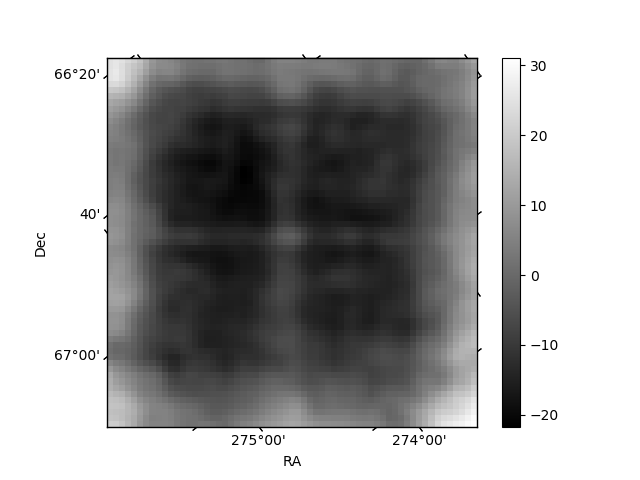
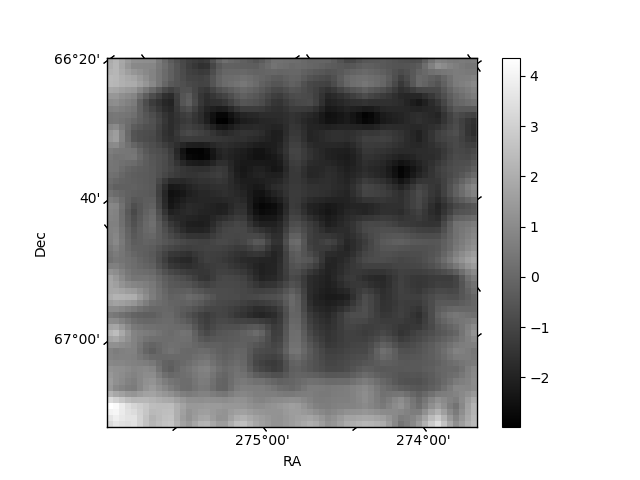
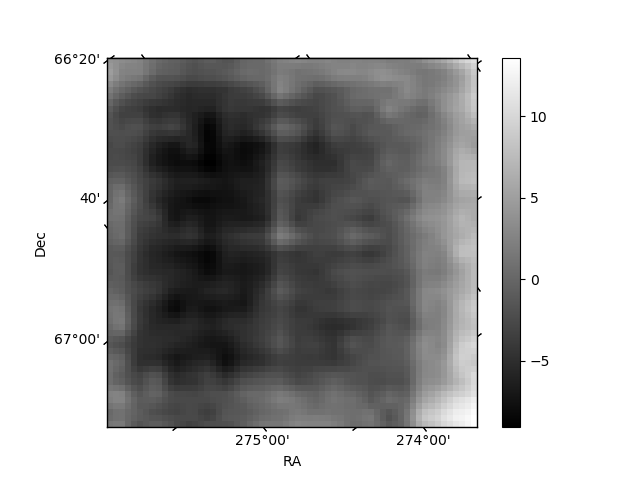
Histogram calculated using DETX and DETY for each event in the final _common_clean file
| Quadrant A | 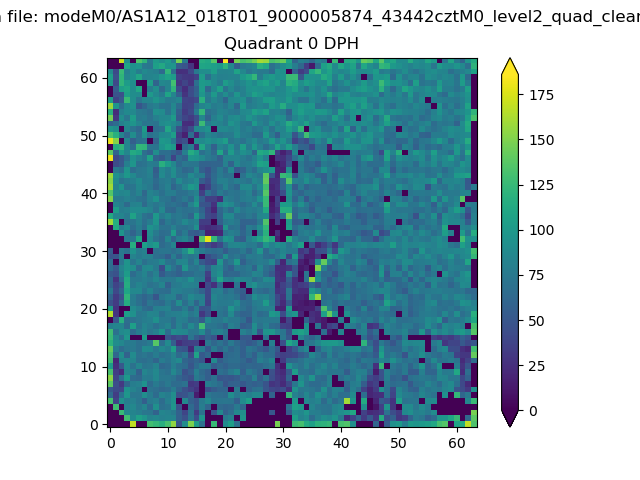 |
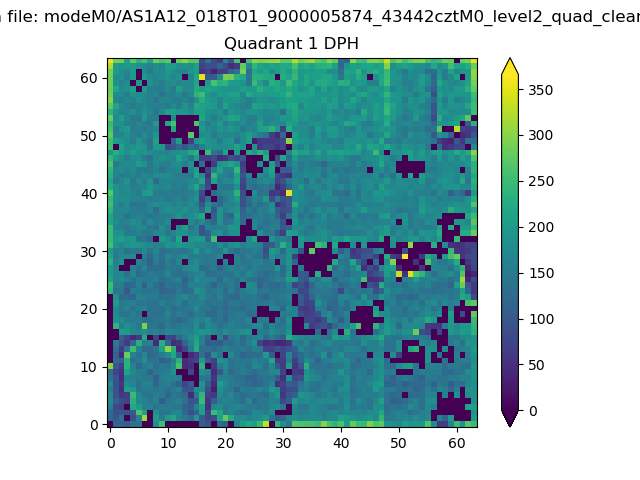 |
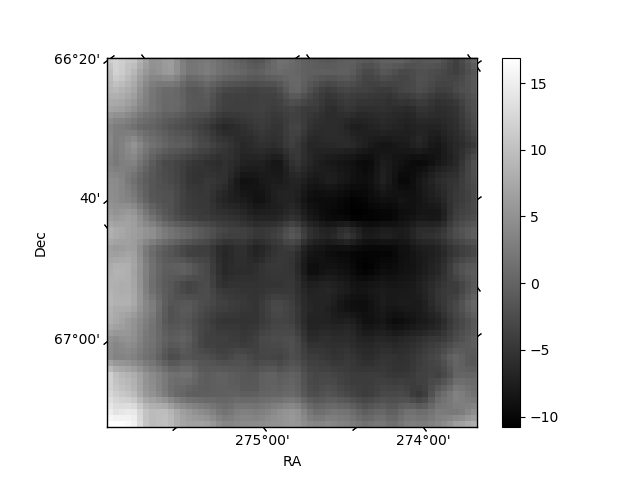
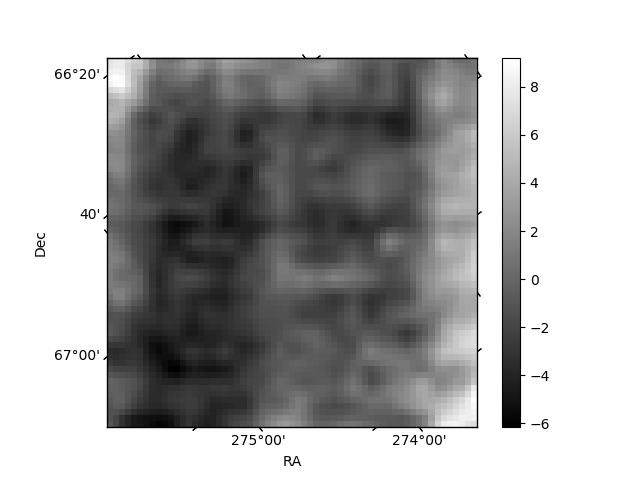
Quadrant B |
|---|---|---|---|
| Quadrant D | 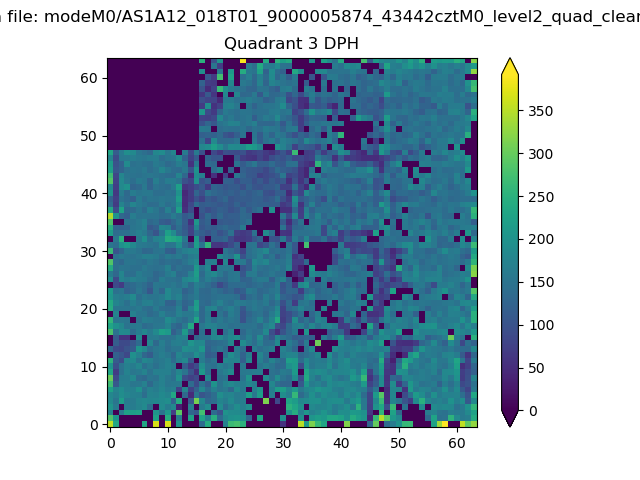 |
 |
Quadrant C |
| Plot type | Count rate plots | Images |
|---|---|---|
| Comparison with Poisson distribution Blue bars denote a histogram of data divided into 1 sec bins. Red curve is a Poisson curve with rate = median count rate of data. |
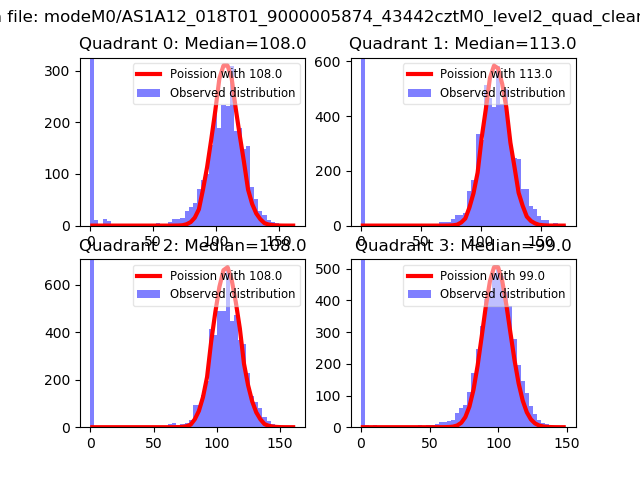 |
 |
| Quadrant-wise count rates Data is divided into 100 sec bins |
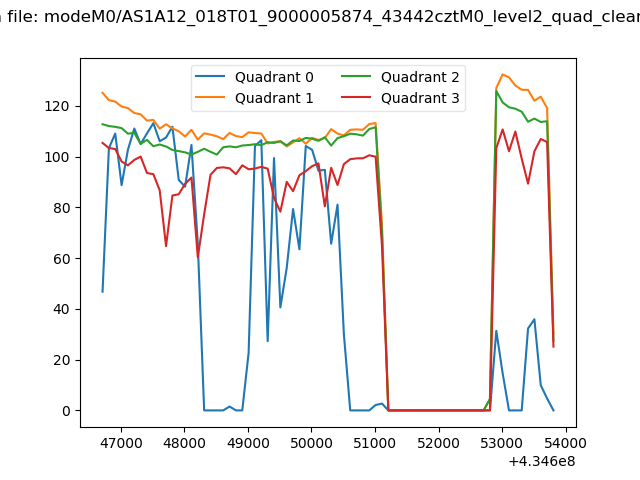 |
|
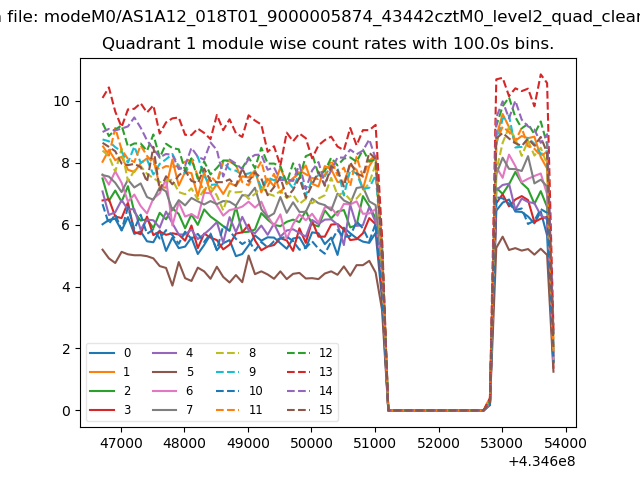
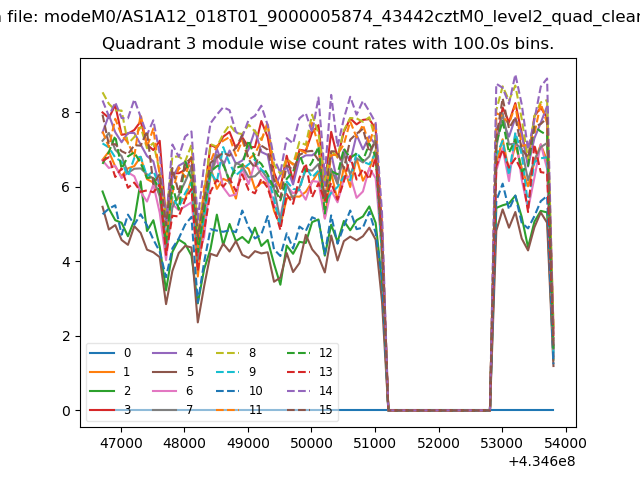
| Module-wise count rates for Quadrant A Data is divided into 100 sec bins |
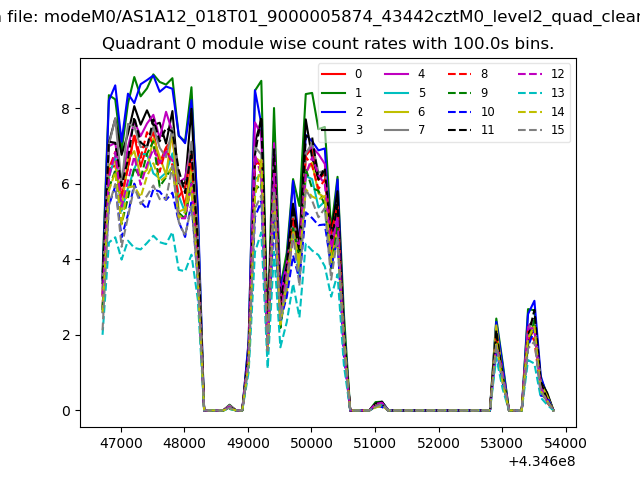 |
 |
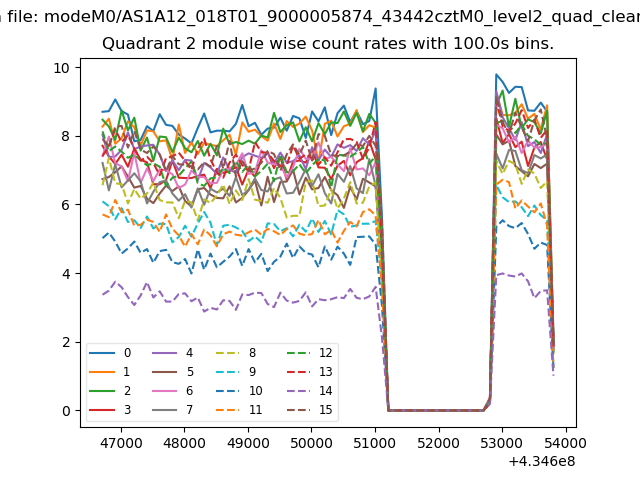
| Module-wise count rates for Quadrant B Data is divided into 100 sec bins |
 |
 |
| Module-wise count rates for Quadrant C Data is divided into 100 sec bins |
 |
 |
| Module-wise count rates for Quadrant D Data is divided into 100 sec bins |
 |
 |
| Parameter | Plot |
|---|---|
| CZT HV Monitor |  |
| D_VDD | 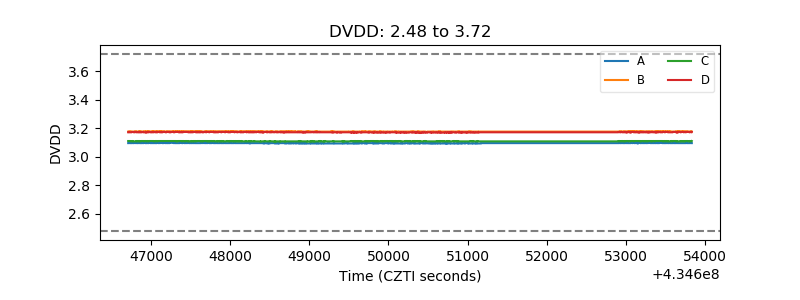 |
| Temperature 1 | 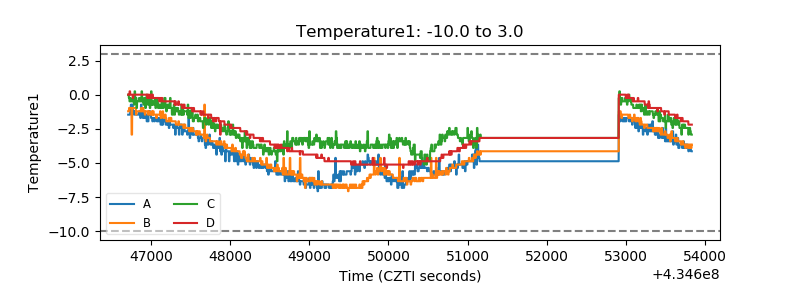 |
| Veto HV Monitor | 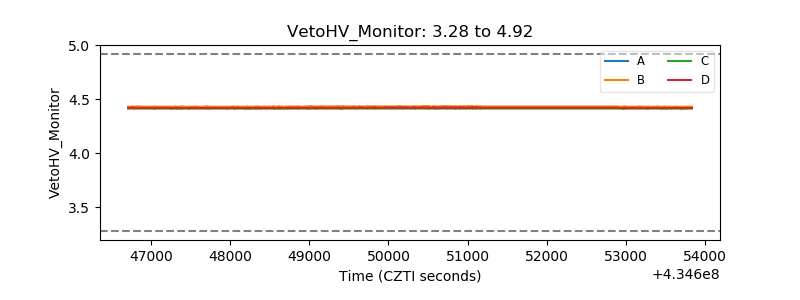 |
| Veto LLD | 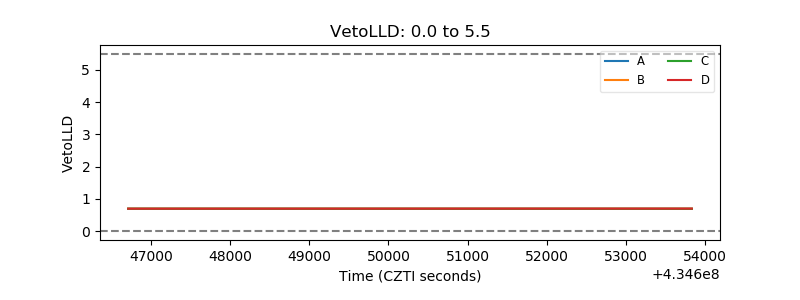 |
| Alpha Counter | 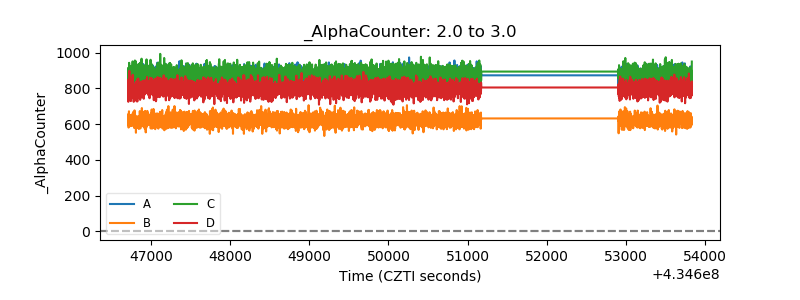 |
| _CPM_Rate | 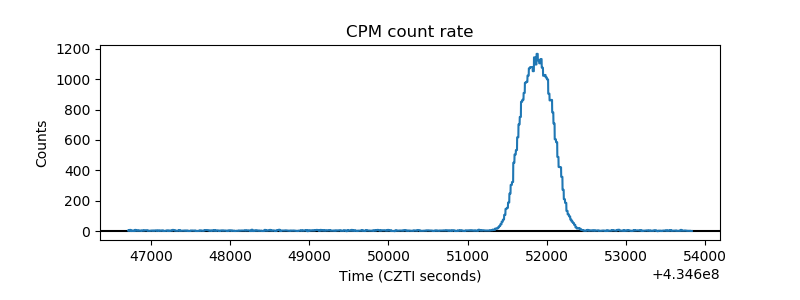 |
| CZT Counter | 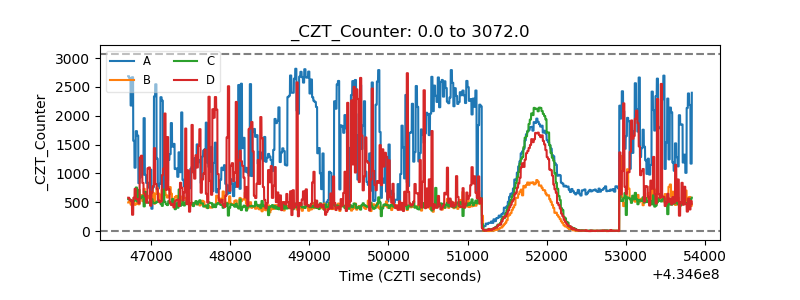 |
| +2.5 Volts monitor | 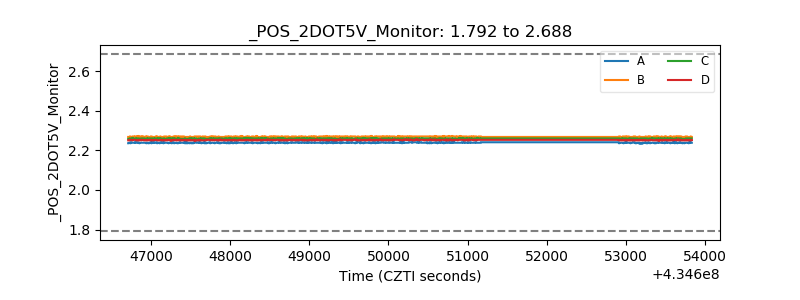 |
| +5 Volts monitor |  |
| _ROLL_ROT | 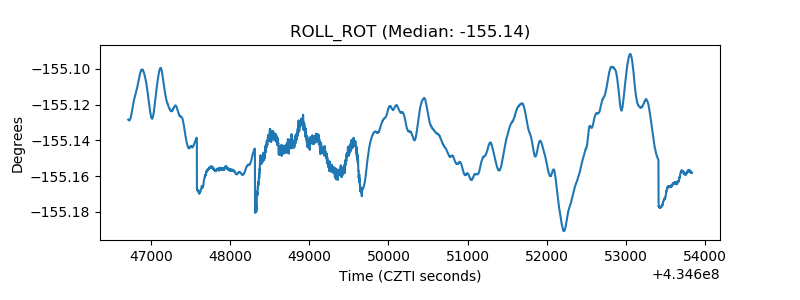 |
| _Roll_DEC | 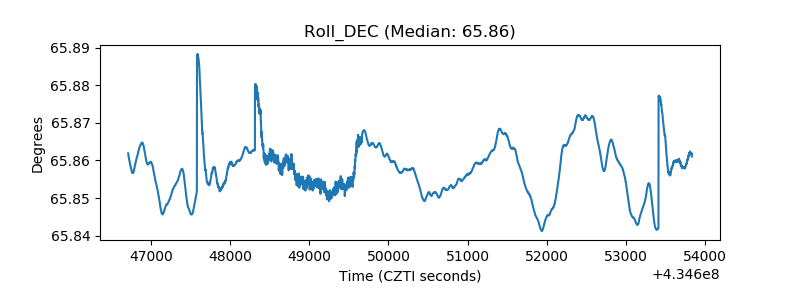 |
| _Roll_RA | 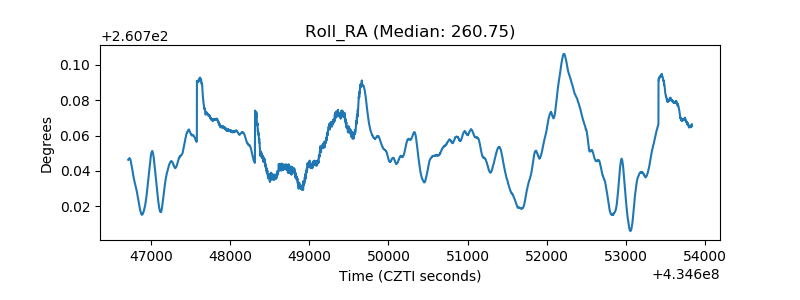 |
| Veto Counter | 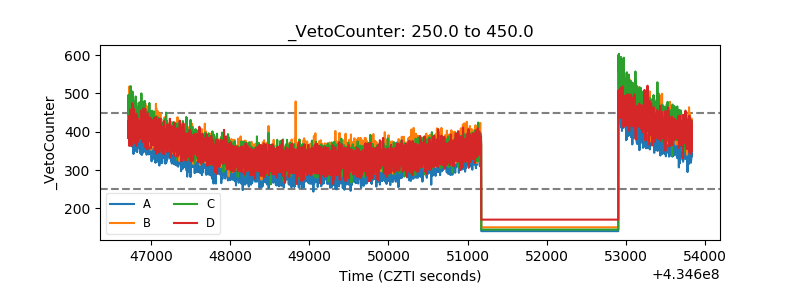 |