| Param | Original file | Final file |
|---|---|---|
| Filename | modeM0/AS1A12_018T01_9000005874_43443cztM0_level2.fits | modeM0/AS1A12_018T01_9000005874_43443cztM0_level2_quad_clean.evt |
| Size (bytes) | 477,210,240 | 79,096,320 |
| Size | 455.1 MB | 75.4 MB |
| Events in quadrant A | 8,015,050 | 298,441 |
| Events in quadrant B | 3,073,187 | 604,352 |
| Events in quadrant C | 2,498,729 | 590,467 |
| Events in quadrant D | 3,669,358 | 534,415 |
| Mode M0 | |||
|---|---|---|---|
| Quadrant | BADHDUFLAG | Total packets | Discarded packets |
| A | 0 | 27312 | 2 |
| B | 0 | 12674 | 2 |
| C | 0 | 10756 | 2 |
| D | 0 | 14574 | 3 |
| Mode M9 | |||
|---|---|---|---|
| Quadrant | BADHDUFLAG | Total packets | Discarded packets |
| A | 0 | 24 | 0 |
| B | 0 | 25 | 0 |
| C | 0 | 25 | 0 |
| D | 0 | 25 | 0 |
| Mode SS | |||
|---|---|---|---|
| Quadrant | BADHDUFLAG | Total packets | Discarded packets |
| A | 0 | 108 | 0 |
| B | 0 | 108 | 0 |
| C | 0 | 108 | 0 |
| D | 0 | 108 | 0 |
| Quadrant | Total seconds | Saturated seconds | Saturation percentage |
|---|---|---|---|
| A | 5241 | 2650 | 50.562870% |
| B | 5241 | 164 | 3.129174% |
| C | 5241 | 4 | 0.076321% |
| D | 5240 | 137 | 2.614504% |
Noise dominated data is calculated using 1-second bins in cleaned event files. If a bin has >2000 counts, and if more than 50% of those come from <1% of pixels, then it is considered to be noise-dominated and hence unusable.
| Quadrant | # 1 sec bins | Bins with >0 counts | Bins with >2000 counts | High rate bins dominated by noise | Noise dominated (total time) | Noise dominated (detector-on time) | Marked lightcurve |
|---|---|---|---|---|---|---|---|
| A | 7124 | 5242 | 2051 | 2051 | 28.79% | 39.13% | 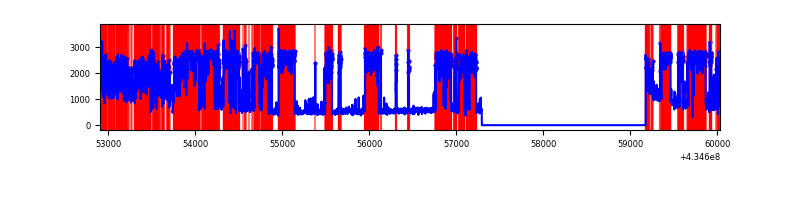 |
| B | 7124 | 5242 | 147 | 147 | 2.06% | 2.80% | 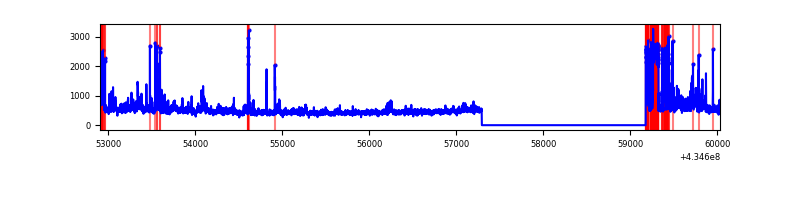 |
| C | 7124 | 5242 | 2 | 2 | 0.03% | 0.04% | 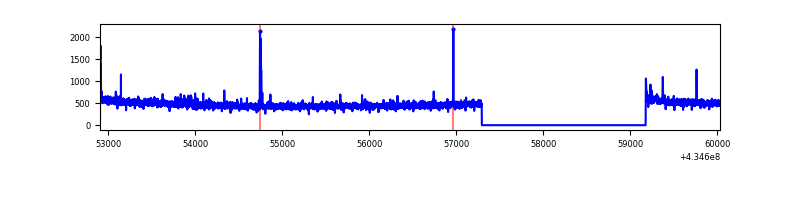 |
| D | 7123 | 5241 | 131 | 131 | 1.84% | 2.50% | 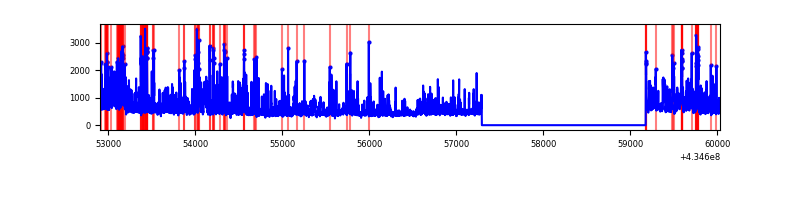 |
Top three noisy pixels from each quadrant. If the there are fewer than three noisy pixels in the level2.evt file, extra rows are filled as -1
| Pixel properties | Quadrant properties | ||||||
|---|---|---|---|---|---|---|---|
| Quadrant | DetID | PixID | Counts | Sigma | Mean | Median | Sigma |
| A | 15 | 222 | 5992569 | 83109.11 | 349 | 342 | 72.1 |
| A | 10 | 83 | 377040 | 5224.61 | 349 | 342 | 72.1 |
| A | 15 | 237 | 270547 | 3747.6 | 349 | 342 | 72.1 |
| B | 4 | 36 | 314117 | 2902.94 | 566 | 550 | 108.0 |
| B | 0 | 189 | 221340 | 2044.03 | 566 | 550 | 108.0 |
| B | 0 | 190 | 118572 | 1092.62 | 566 | 550 | 108.0 |
| C | 15 | 214 | 215962 | 1634.12 | 567 | 569 | 131.8 |
| C | 3 | 233 | 42161 | 315.55 | 567 | 569 | 131.8 |
| C | 14 | 254 | 14804 | 108.0 | 567 | 569 | 131.8 |
| D | 1 | 52 | 688567 | 5070.43 | 557 | 542 | 135.7 |
| D | 2 | 16 | 285915 | 2103.07 | 557 | 542 | 135.7 |
| D | 13 | 249 | 180860 | 1328.86 | 557 | 542 | 135.7 |
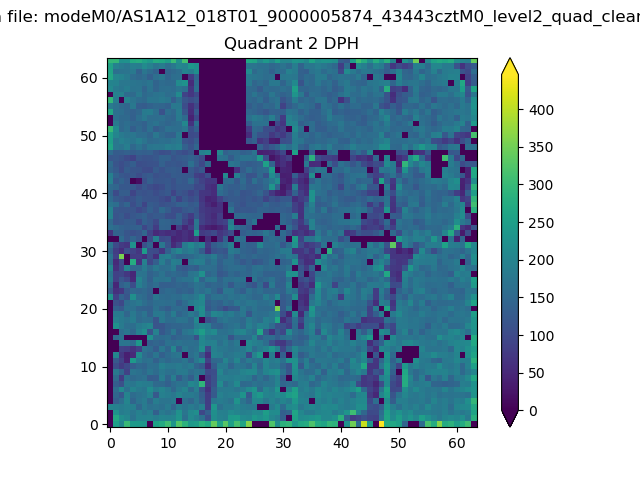
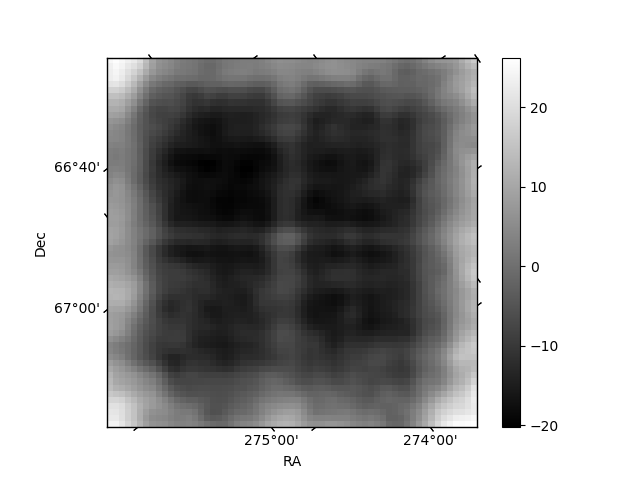
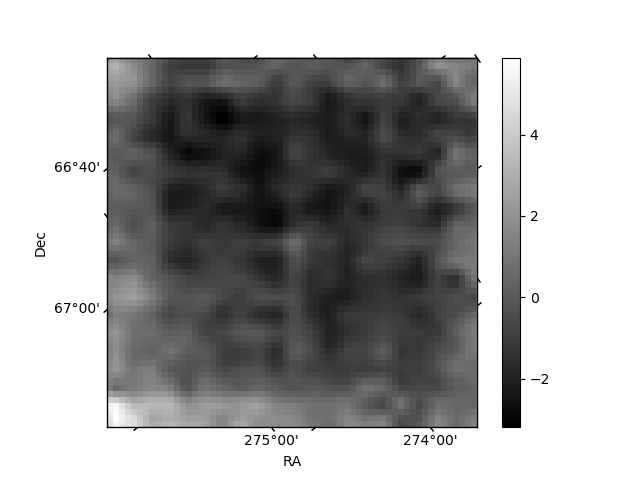
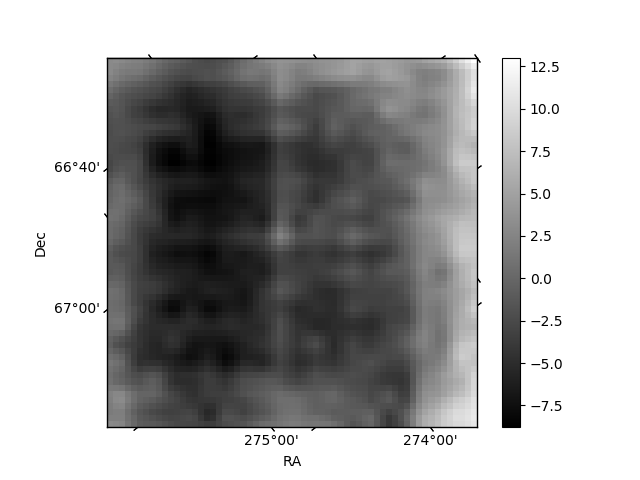
Histogram calculated using DETX and DETY for each event in the final _common_clean file
| Quadrant A | 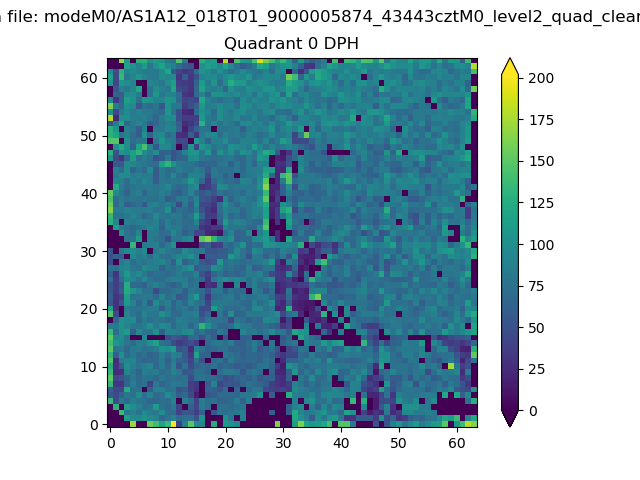 |
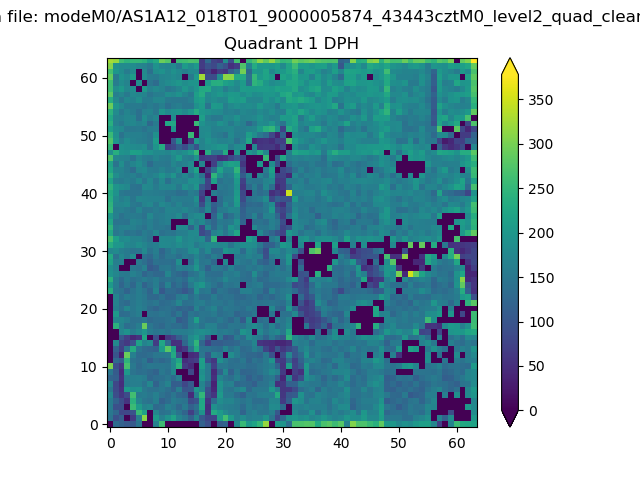 |
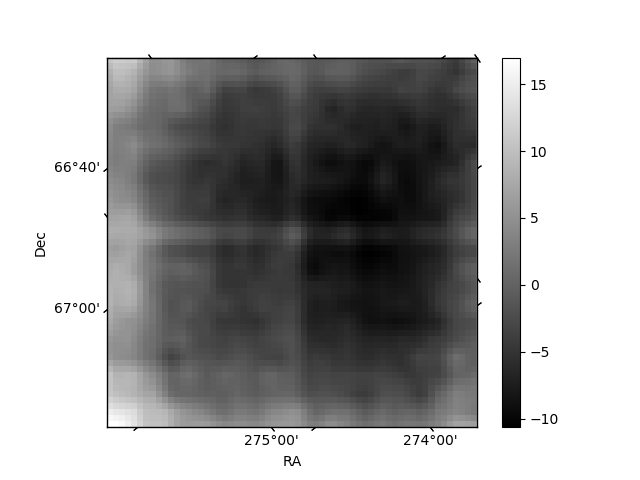
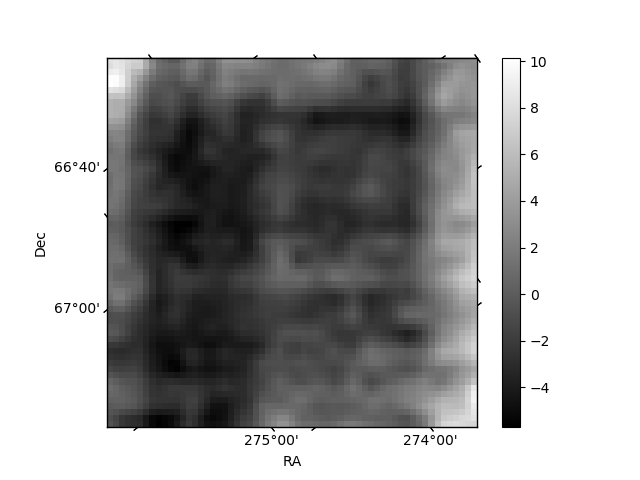
Quadrant B |
|---|---|---|---|
| Quadrant D | 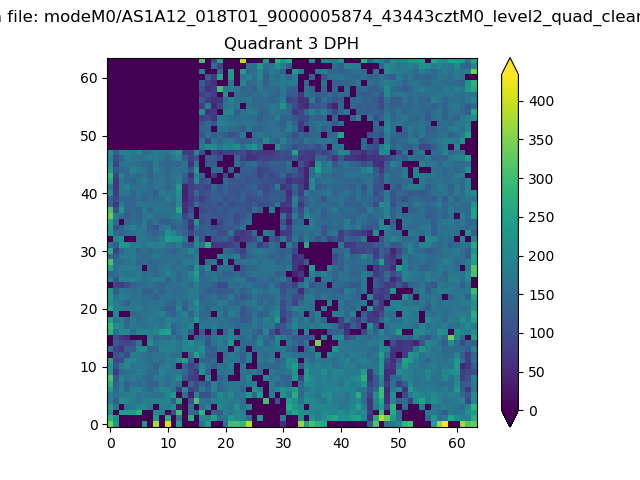 |
 |
Quadrant C |
| Plot type | Count rate plots | Images |
|---|---|---|
| Comparison with Poisson distribution Blue bars denote a histogram of data divided into 1 sec bins. Red curve is a Poisson curve with rate = median count rate of data. |
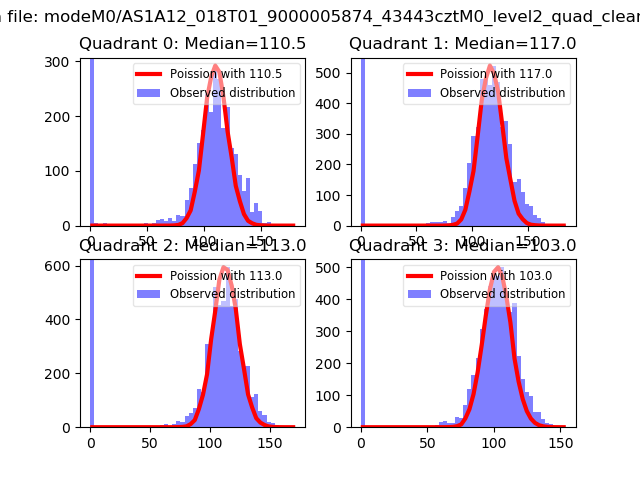 |
 |
| Quadrant-wise count rates Data is divided into 100 sec bins |
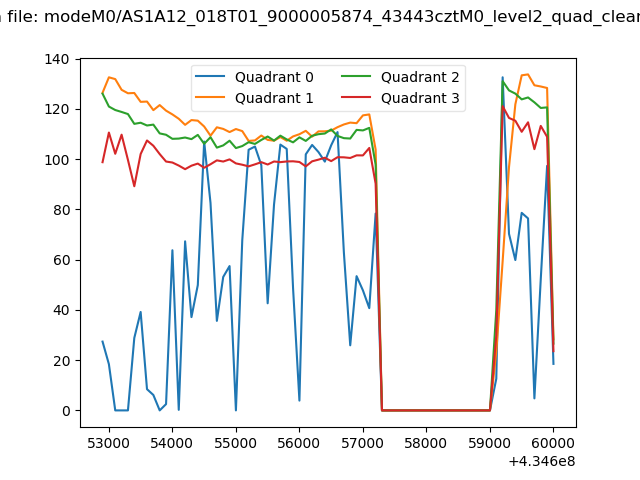 |
|
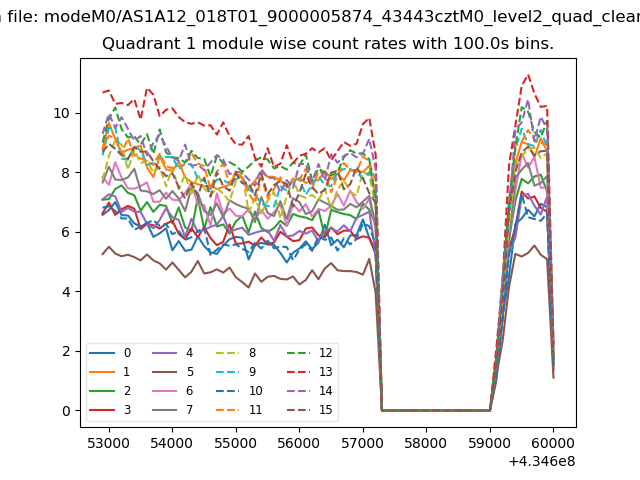
| Module-wise count rates for Quadrant A Data is divided into 100 sec bins |
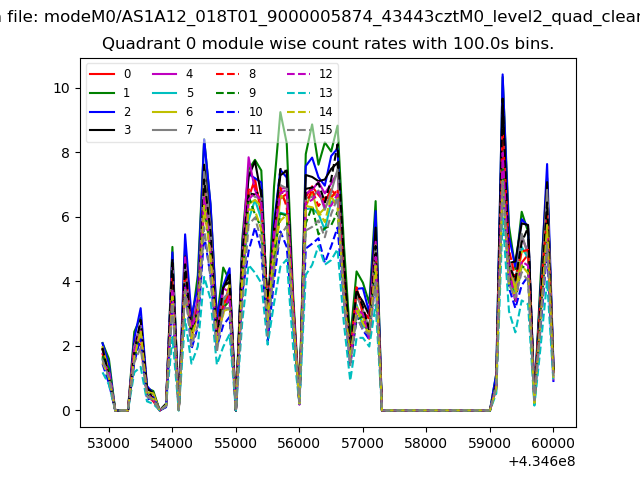 |
 |
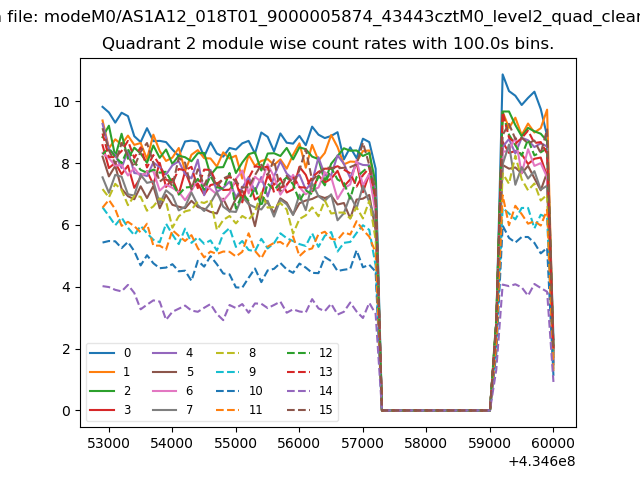
| Module-wise count rates for Quadrant B Data is divided into 100 sec bins |
 |
 |
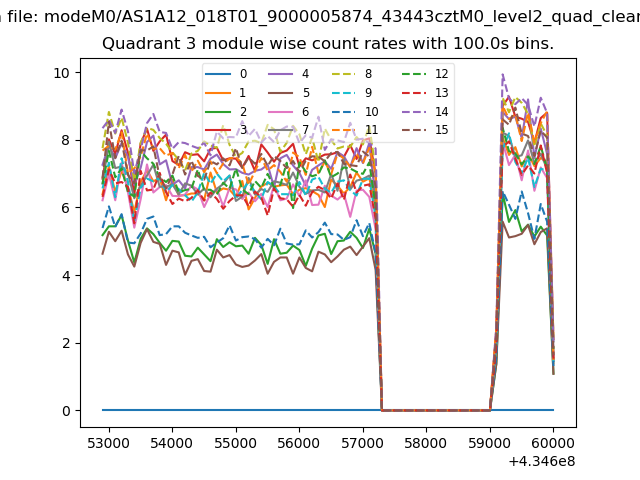
| Module-wise count rates for Quadrant C Data is divided into 100 sec bins |
 |
 |
| Module-wise count rates for Quadrant D Data is divided into 100 sec bins |
 |
 |
| Parameter | Plot |
|---|---|
| CZT HV Monitor | 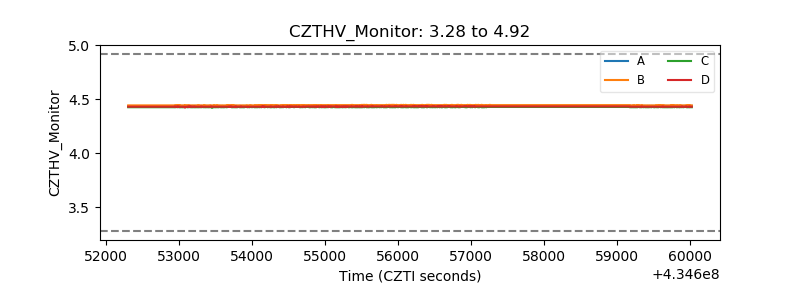 |
| D_VDD | 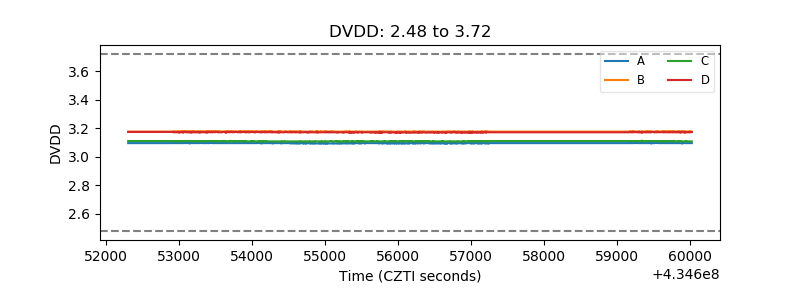 |
| Temperature 1 | 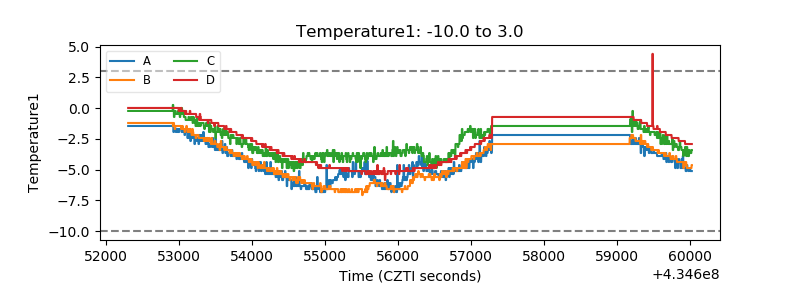 |
| Veto HV Monitor | 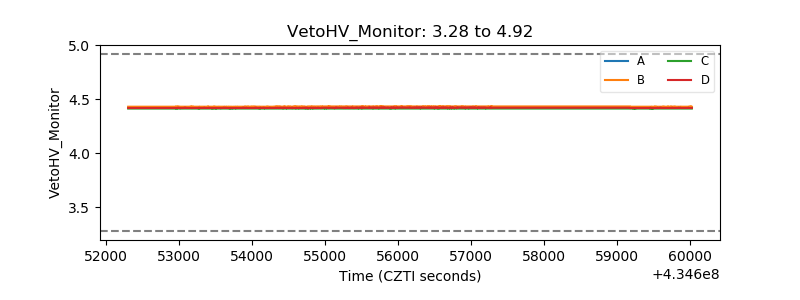 |
| Veto LLD | 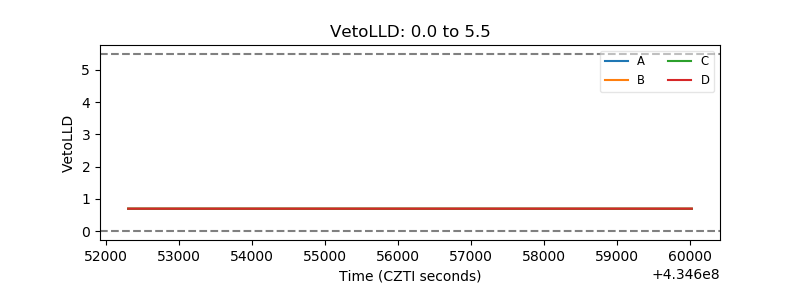 |
| Alpha Counter | 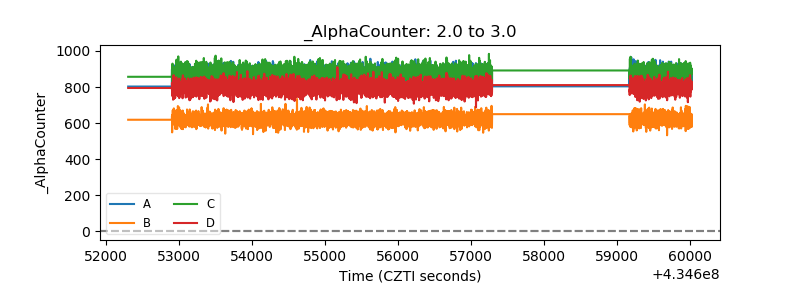 |
| _CPM_Rate | 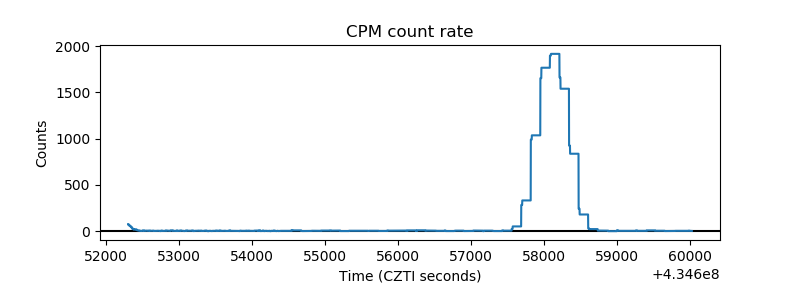 |
| CZT Counter | 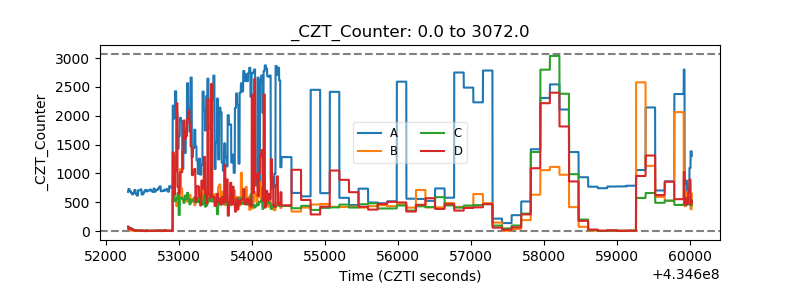 |
| +2.5 Volts monitor | 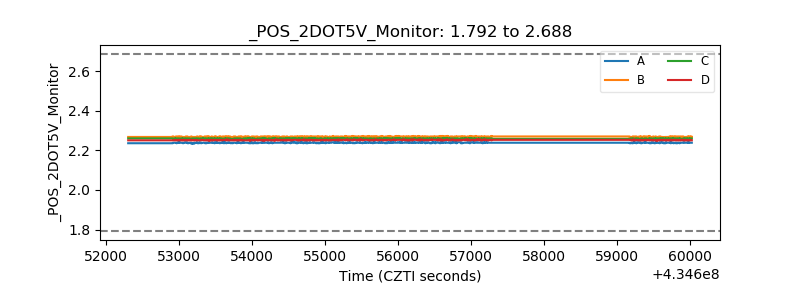 |
| +5 Volts monitor |  |
| _ROLL_ROT | 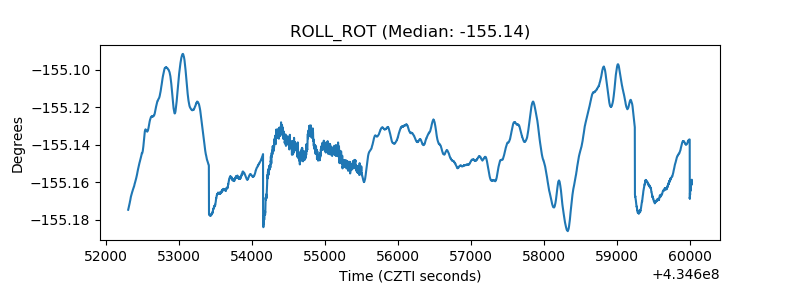 |
| _Roll_DEC | 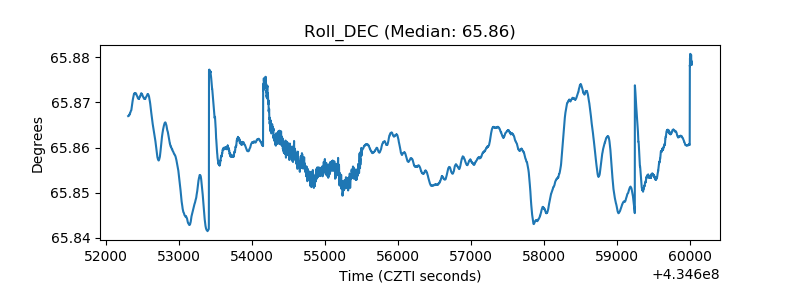 |
| _Roll_RA | 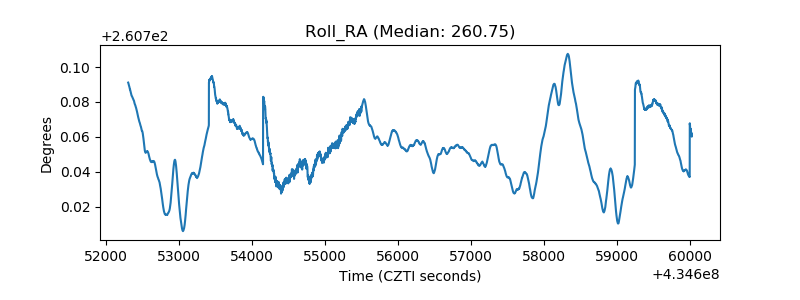 |
| Veto Counter |  |