| Param | Original file | Final file |
|---|---|---|
| Filename | modeM0/AS1A12_018T01_9000005874_43445cztM0_level2.fits | modeM0/AS1A12_018T01_9000005874_43445cztM0_level2_quad_clean.evt |
| Size (bytes) | 540,576,000 | 72,446,400 |
| Size | 515.5 MB | 69.1 MB |
| Events in quadrant A | 9,243,139 | 200,807 |
| Events in quadrant B | 2,687,227 | 606,473 |
| Events in quadrant C | 2,360,980 | 581,943 |
| Events in quadrant D | 5,333,917 | 457,502 |
| Mode M0 | |||
|---|---|---|---|
| Quadrant | BADHDUFLAG | Total packets | Discarded packets |
| A | 0 | 30843 | 2 |
| B | 0 | 11251 | 2 |
| C | 0 | 10090 | 2 |
| D | 0 | 19303 | 2 |
| Mode M9 | |||
|---|---|---|---|
| Quadrant | BADHDUFLAG | Total packets | Discarded packets |
| A | 0 | 29 | 0 |
| B | 0 | 30 | 0 |
| C | 0 | 30 | 0 |
| D | 0 | 30 | 0 |
| Mode SS | |||
|---|---|---|---|
| Quadrant | BADHDUFLAG | Total packets | Discarded packets |
| A | 0 | 100 | 0 |
| B | 0 | 100 | 0 |
| C | 0 | 100 | 0 |
| D | 0 | 100 | 0 |
| Quadrant | Total seconds | Saturated seconds | Saturation percentage |
|---|---|---|---|
| A | 4948 | 3238 | 65.440582% |
| B | 4948 | 34 | 0.687146% |
| C | 4948 | 8 | 0.161681% |
| D | 4948 | 822 | 16.612773% |
Noise dominated data is calculated using 1-second bins in cleaned event files. If a bin has >2000 counts, and if more than 50% of those come from <1% of pixels, then it is considered to be noise-dominated and hence unusable.
| Quadrant | # 1 sec bins | Bins with >0 counts | Bins with >2000 counts | High rate bins dominated by noise | Noise dominated (total time) | Noise dominated (detector-on time) | Marked lightcurve |
|---|---|---|---|---|---|---|---|
| A | 7040 | 4947 | 2859 | 2859 | 40.61% | 57.79% | 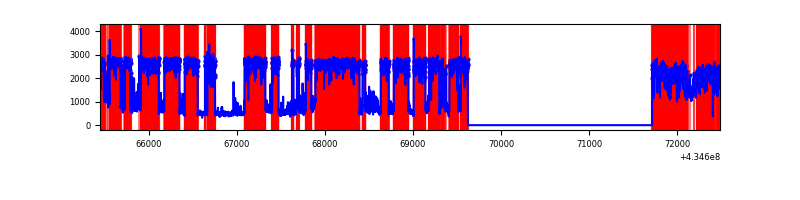 |
| B | 7041 | 4949 | 19 | 19 | 0.27% | 0.38% | 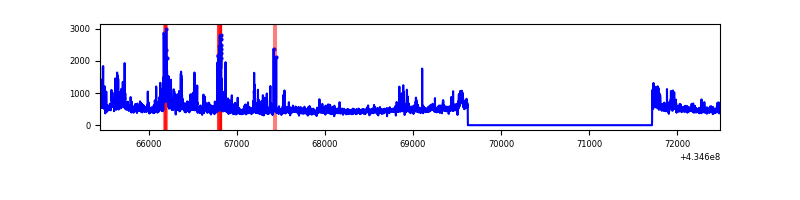 |
| C | 7041 | 4949 | 2 | 2 | 0.03% | 0.04% | 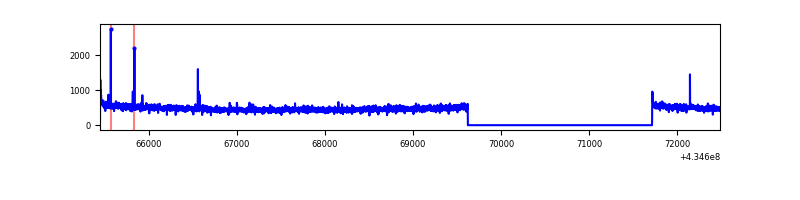 |
| D | 7041 | 4949 | 825 | 825 | 11.72% | 16.67% | 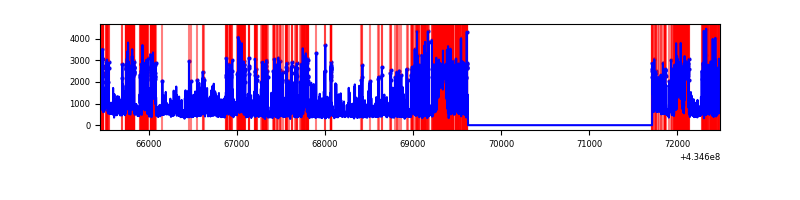 |
Top three noisy pixels from each quadrant. If the there are fewer than three noisy pixels in the level2.evt file, extra rows are filled as -1
| Pixel properties | Quadrant properties | ||||||
|---|---|---|---|---|---|---|---|
| Quadrant | DetID | PixID | Counts | Sigma | Mean | Median | Sigma |
| A | 15 | 222 | 7813287 | 140818.16 | 265 | 260 | 55.5 |
| A | 10 | 83 | 274929 | 4950.5 | 265 | 260 | 55.5 |
| A | 15 | 237 | 111397 | 2003.08 | 265 | 260 | 55.5 |
| B | 0 | 190 | 244139 | 2359.39 | 547 | 532 | 103.2 |
| B | 0 | 199 | 107192 | 1033.03 | 547 | 532 | 103.2 |
| B | 0 | 189 | 88636 | 853.31 | 547 | 532 | 103.2 |
| C | 15 | 214 | 204835 | 1644.64 | 539 | 543 | 124.2 |
| C | 3 | 233 | 31821 | 251.8 | 539 | 543 | 124.2 |
| C | 12 | 249 | 10125 | 77.14 | 539 | 543 | 124.2 |
| D | 1 | 52 | 1662580 | 13985.39 | 485 | 470 | 118.8 |
| D | 1 | 20 | 805303 | 6772.06 | 485 | 470 | 118.8 |
| D | 2 | 16 | 307303 | 2581.77 | 485 | 470 | 118.8 |
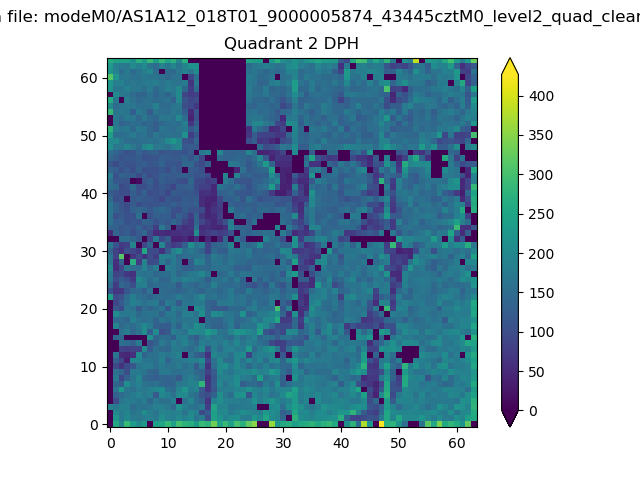
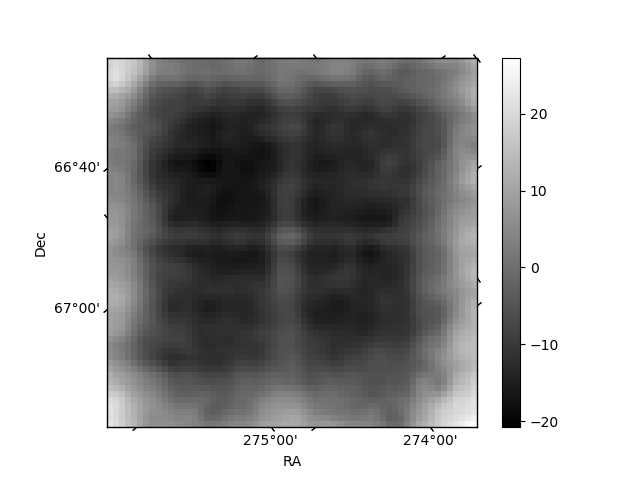
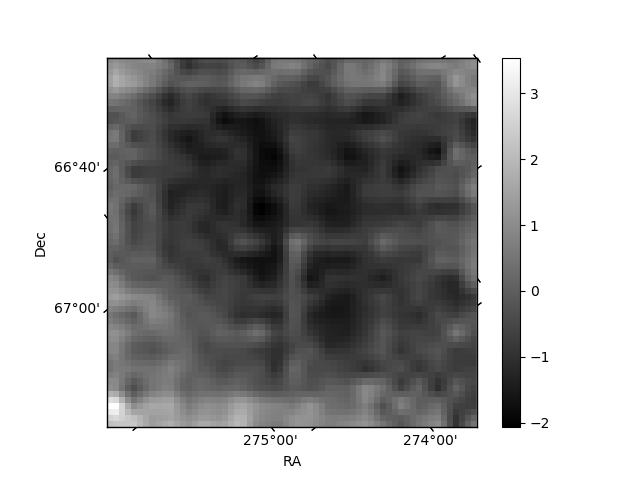
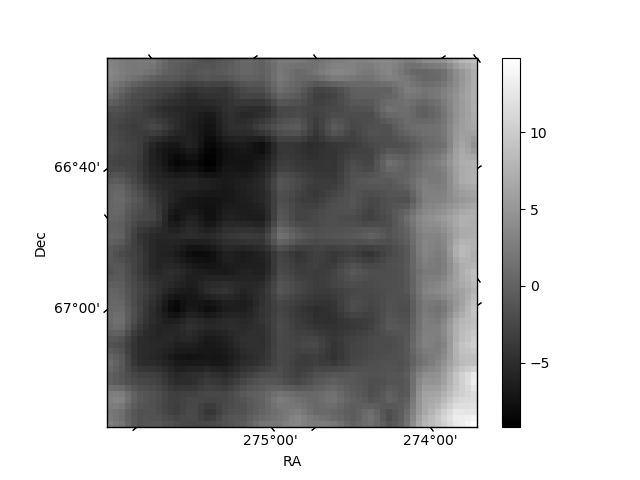
Histogram calculated using DETX and DETY for each event in the final _common_clean file
| Quadrant A | 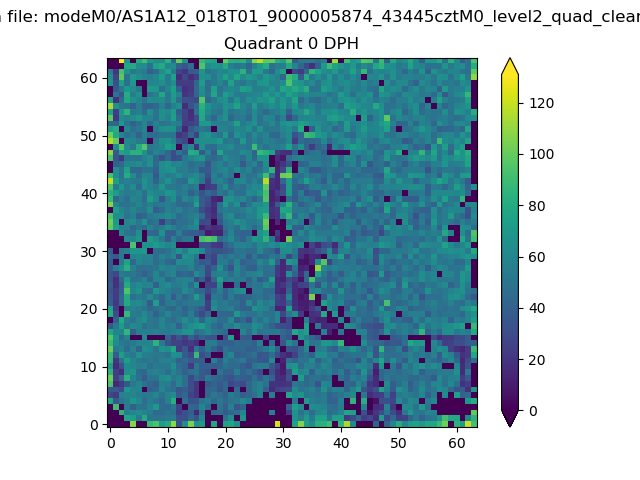 |
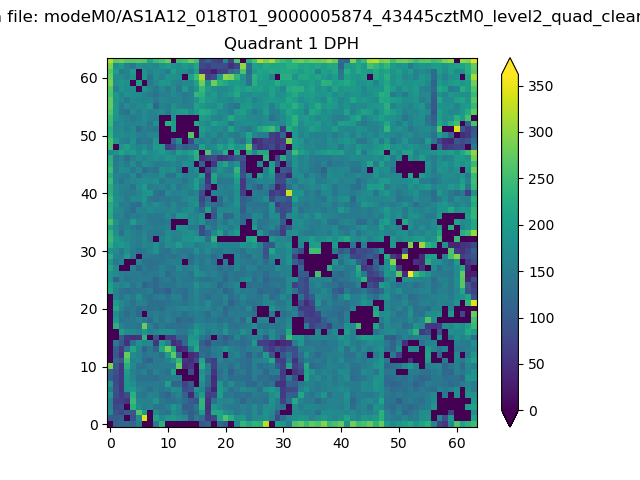 |
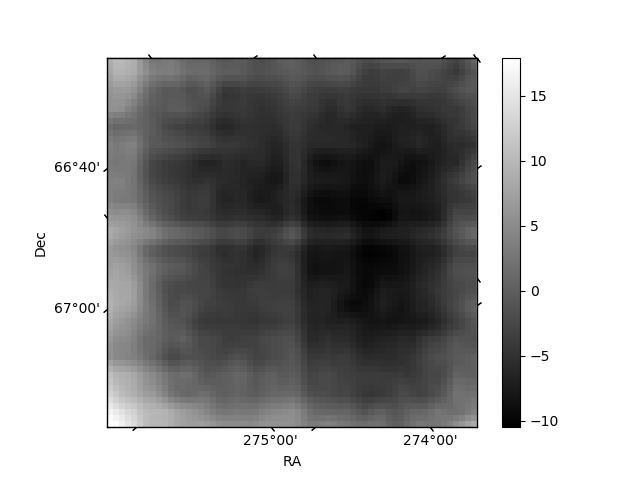
Quadrant B |
|---|---|---|---|
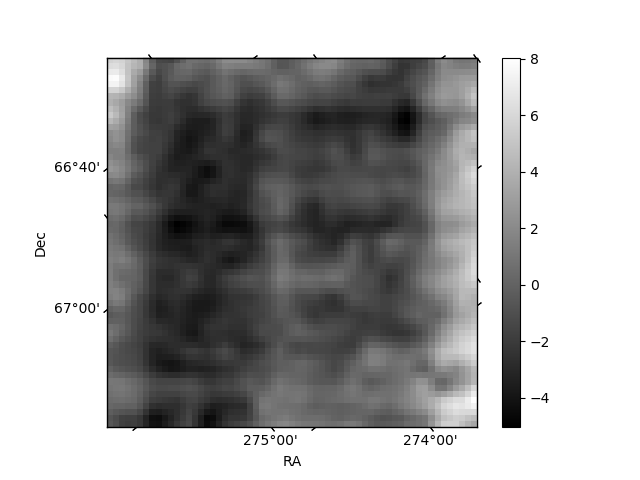
| Quadrant D | 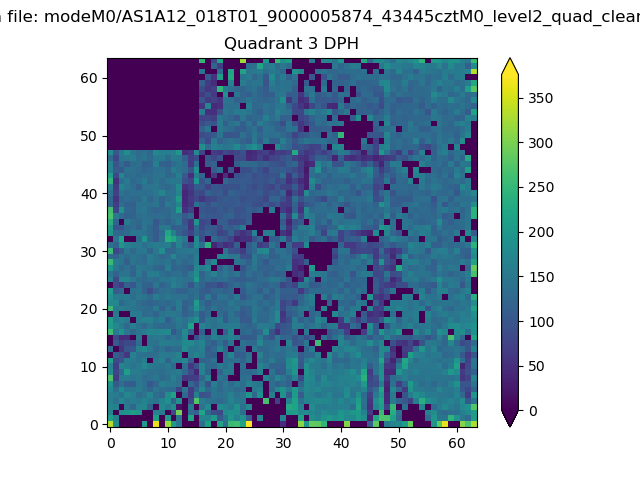 |
 |
Quadrant C |
| Plot type | Count rate plots | Images |
|---|---|---|
| Comparison with Poisson distribution Blue bars denote a histogram of data divided into 1 sec bins. Red curve is a Poisson curve with rate = median count rate of data. |
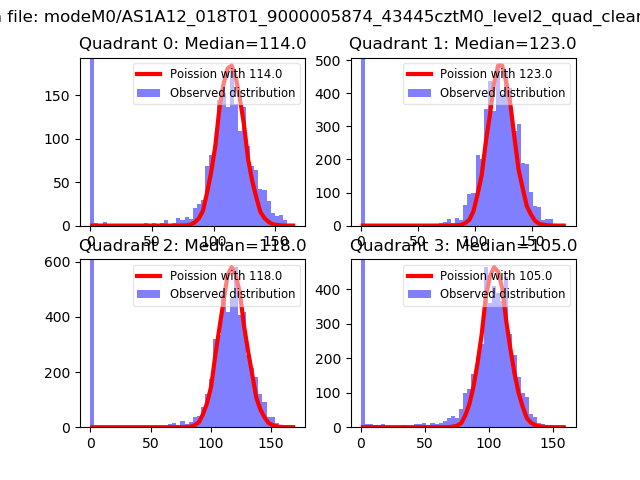 |
 |
| Quadrant-wise count rates Data is divided into 100 sec bins |
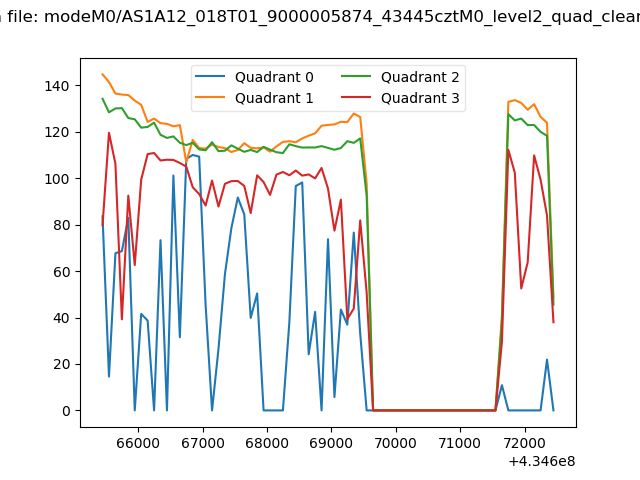 |
|
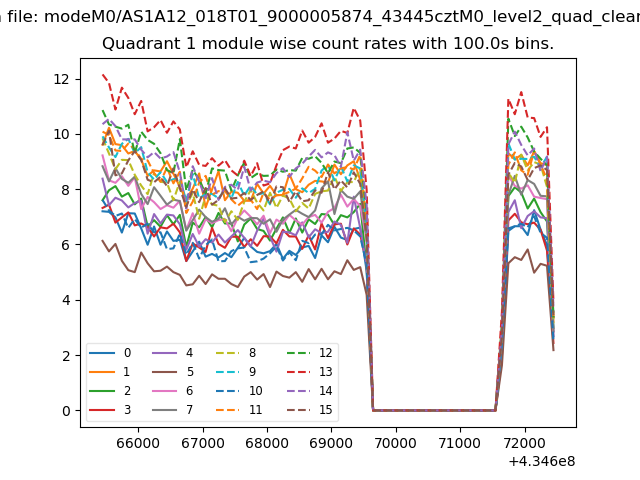
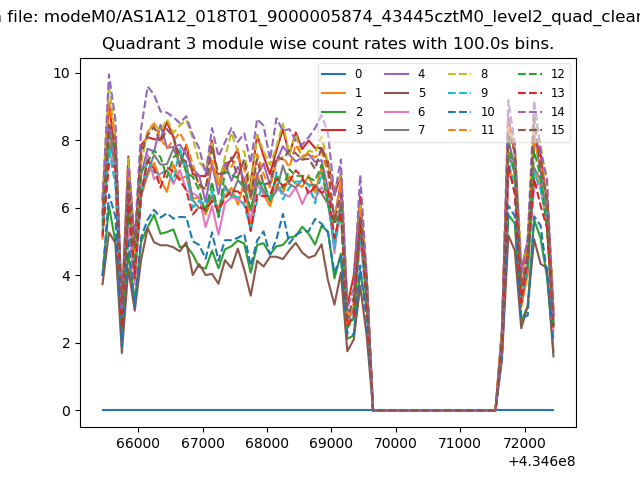
| Module-wise count rates for Quadrant A Data is divided into 100 sec bins |
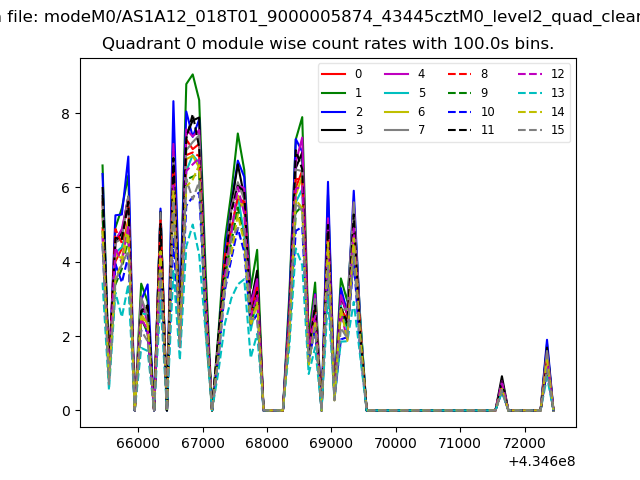 |
 |
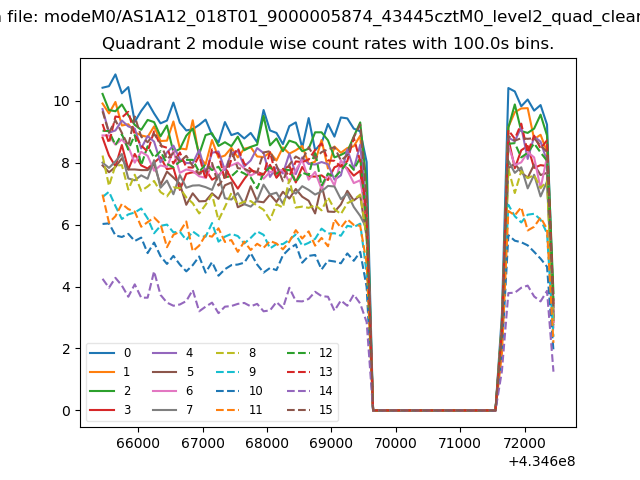
| Module-wise count rates for Quadrant B Data is divided into 100 sec bins |
 |
 |
| Module-wise count rates for Quadrant C Data is divided into 100 sec bins |
 |
 |
| Module-wise count rates for Quadrant D Data is divided into 100 sec bins |
 |
 |
| Parameter | Plot |
|---|---|
| CZT HV Monitor | 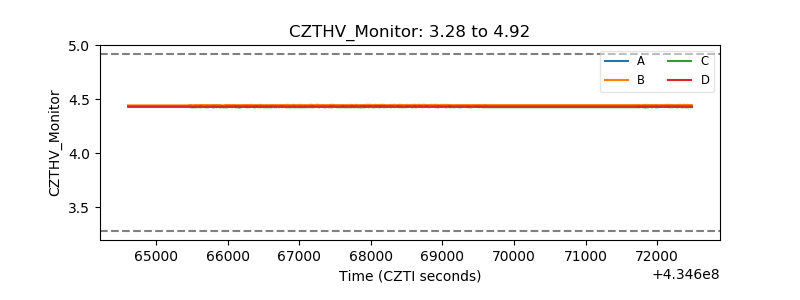 |
| D_VDD | 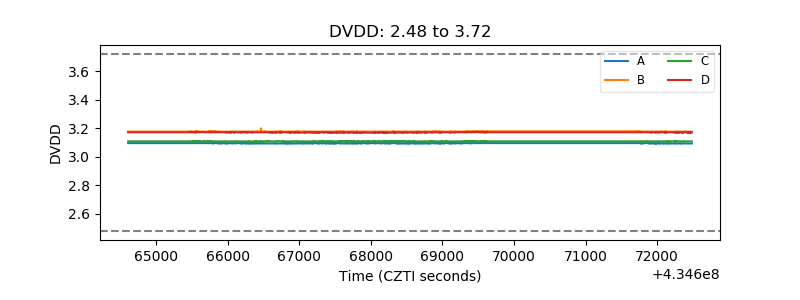 |
| Temperature 1 | 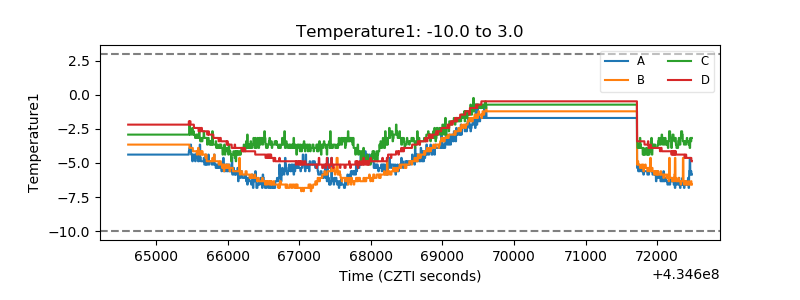 |
| Veto HV Monitor |  |
| Veto LLD | 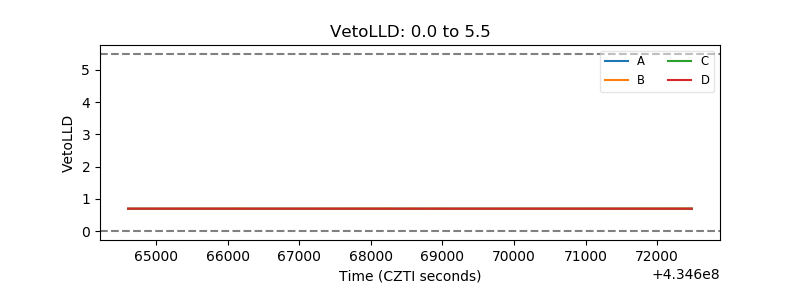 |
| Alpha Counter | 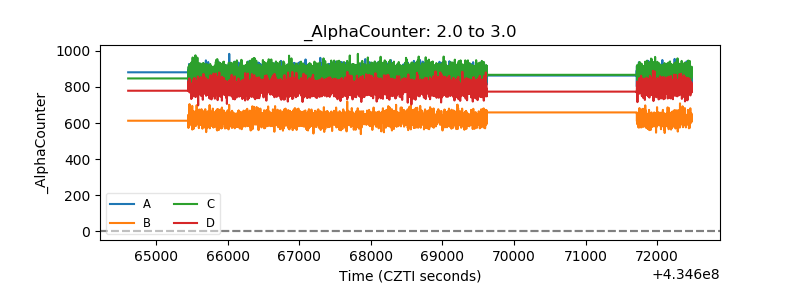 |
| _CPM_Rate | 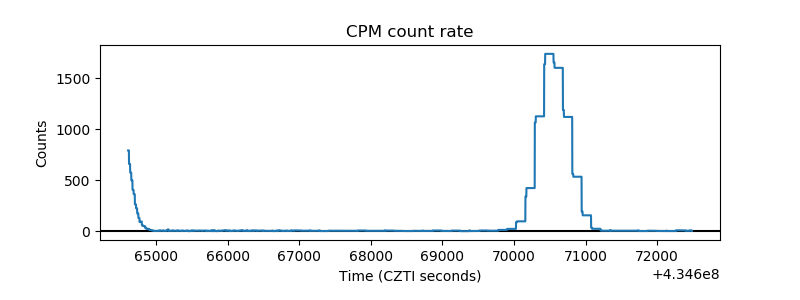 |
| CZT Counter | 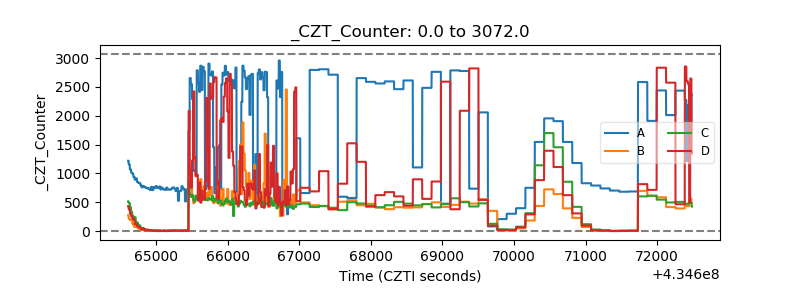 |
| +2.5 Volts monitor | 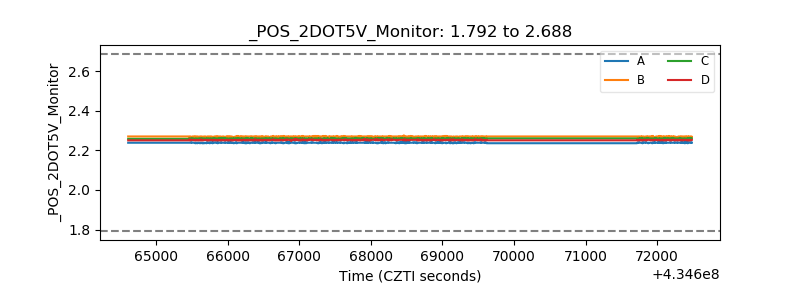 |
| +5 Volts monitor | 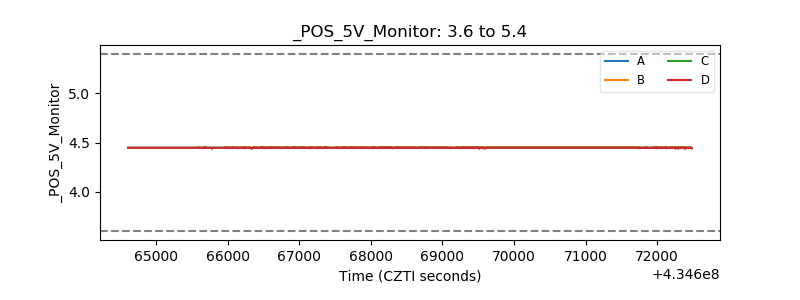 |
| _ROLL_ROT | 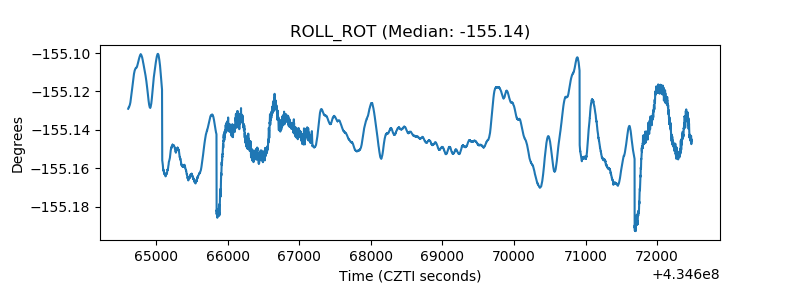 |
| _Roll_DEC |  |
| _Roll_RA | 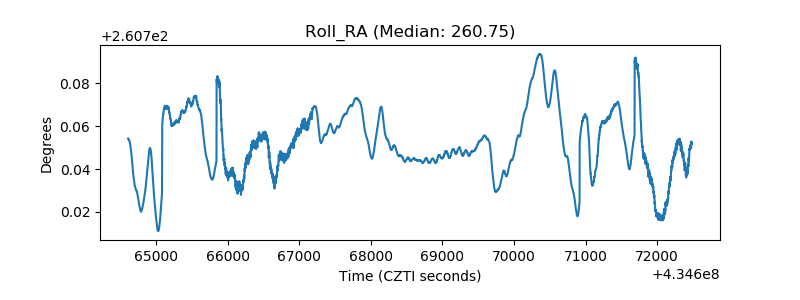 |
| Veto Counter | 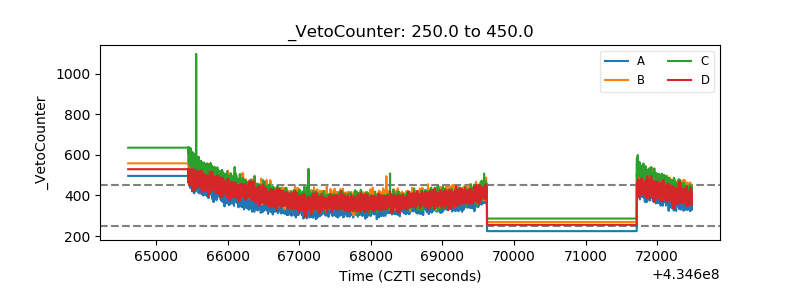 |