| Param | Original file | Final file |
|---|---|---|
| Filename | modeM0/AS1A12_018T01_9000005874_43446cztM0_level2.fits | modeM0/AS1A12_018T01_9000005874_43446cztM0_level2_quad_clean.evt |
| Size (bytes) | 571,078,080 | 72,097,920 |
| Size | 544.6 MB | 68.8 MB |
| Events in quadrant A | 10,466,319 | 126,683 |
| Events in quadrant B | 2,763,976 | 613,281 |
| Events in quadrant C | 2,497,174 | 589,593 |
| Events in quadrant D | 5,008,886 | 490,833 |
| Mode M0 | |||
|---|---|---|---|
| Quadrant | BADHDUFLAG | Total packets | Discarded packets |
| A | 0 | 34656 | 4 |
| B | 0 | 11678 | 2 |
| C | 0 | 10733 | 2 |
| D | 0 | 18500 | 2 |
| Mode M9 | |||
|---|---|---|---|
| Quadrant | BADHDUFLAG | Total packets | Discarded packets |
| A | 0 | 37 | 0 |
| B | 0 | 38 | 0 |
| C | 0 | 38 | 0 |
| D | 0 | 38 | 0 |
| Mode SS | |||
|---|---|---|---|
| Quadrant | BADHDUFLAG | Total packets | Discarded packets |
| A | 0 | 106 | 0 |
| B | 0 | 106 | 0 |
| C | 0 | 106 | 0 |
| D | 0 | 106 | 0 |
| Quadrant | Total seconds | Saturated seconds | Saturation percentage |
|---|---|---|---|
| A | 5174 | 4128 | 79.783533% |
| B | 5174 | 17 | 0.328566% |
| C | 5174 | 6 | 0.115964% |
| D | 5174 | 597 | 11.538462% |
Noise dominated data is calculated using 1-second bins in cleaned event files. If a bin has >2000 counts, and if more than 50% of those come from <1% of pixels, then it is considered to be noise-dominated and hence unusable.
| Quadrant | # 1 sec bins | Bins with >0 counts | Bins with >2000 counts | High rate bins dominated by noise | Noise dominated (total time) | Noise dominated (detector-on time) | Marked lightcurve |
|---|---|---|---|---|---|---|---|
| A | 7326 | 5173 | 3081 | 3081 | 42.06% | 59.56% | 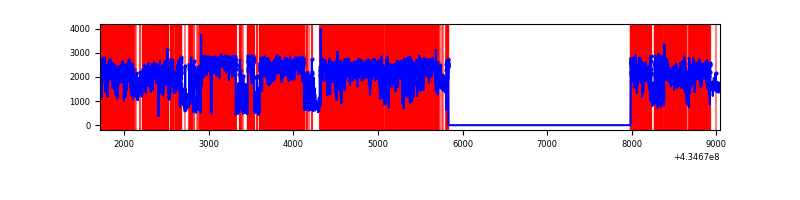 |
| B | 7327 | 5175 | 6 | 6 | 0.08% | 0.12% | 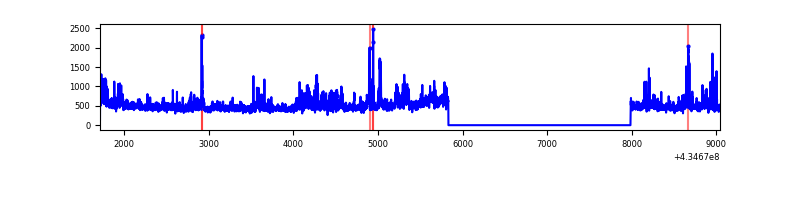 |
| C | 7327 | 5175 | 0 | 0 | 0.00% | 0.00% | 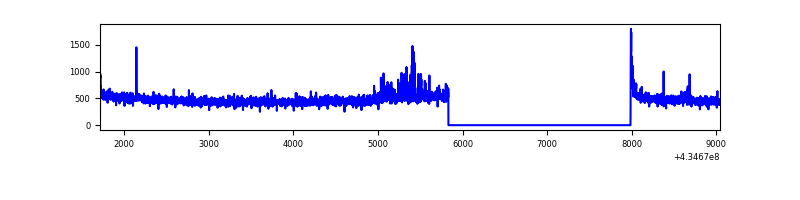 |
| D | 7327 | 5175 | 650 | 650 | 8.87% | 12.56% | 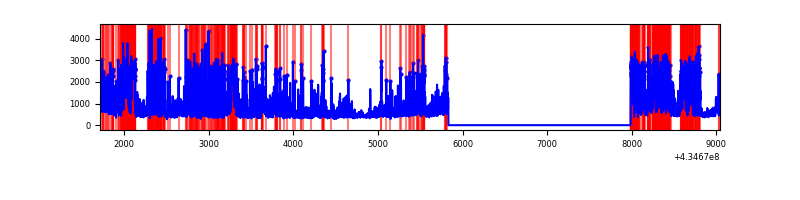 |
Top three noisy pixels from each quadrant. If the there are fewer than three noisy pixels in the level2.evt file, extra rows are filled as -1
| Pixel properties | Quadrant properties | ||||||
|---|---|---|---|---|---|---|---|
| Quadrant | DetID | PixID | Counts | Sigma | Mean | Median | Sigma |
| A | 15 | 222 | 9481572 | 245399.71 | 180 | 176 | 38.6 |
| A | 10 | 83 | 201907 | 5221.25 | 180 | 176 | 38.6 |
| A | 15 | 237 | 77552 | 2002.66 | 180 | 176 | 38.6 |
| B | 0 | 199 | 218957 | 2057.69 | 559 | 544 | 106.1 |
| B | 0 | 189 | 195190 | 1833.78 | 559 | 544 | 106.1 |
| B | 15 | 35 | 41470 | 385.57 | 559 | 544 | 106.1 |
| C | 15 | 214 | 215287 | 1694.94 | 547 | 551 | 126.7 |
| C | 3 | 233 | 140932 | 1108.05 | 547 | 551 | 126.7 |
| C | 13 | 61 | 3708 | 24.92 | 547 | 551 | 126.7 |
| D | 1 | 52 | 1616469 | 12886.4 | 513 | 499 | 125.4 |
| D | 1 | 20 | 512677 | 4084.31 | 513 | 499 | 125.4 |
| D | 12 | 6 | 382977 | 3050.03 | 513 | 499 | 125.4 |
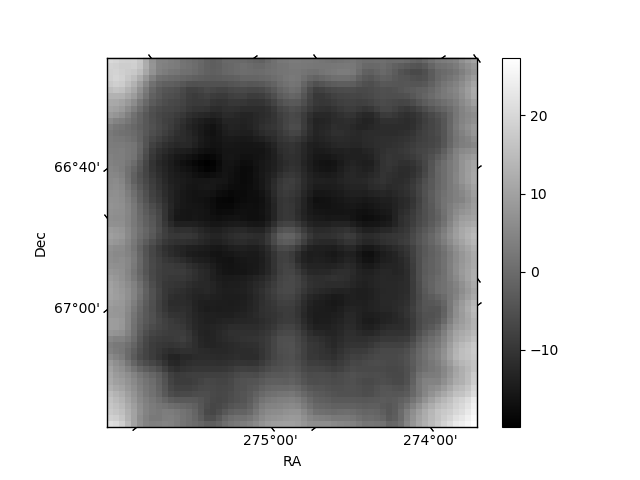
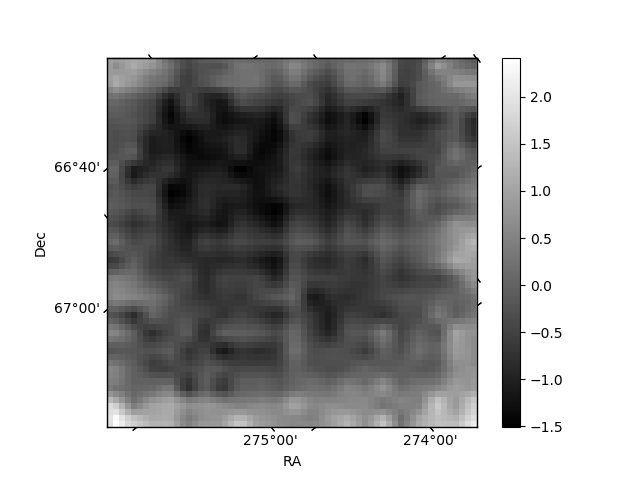
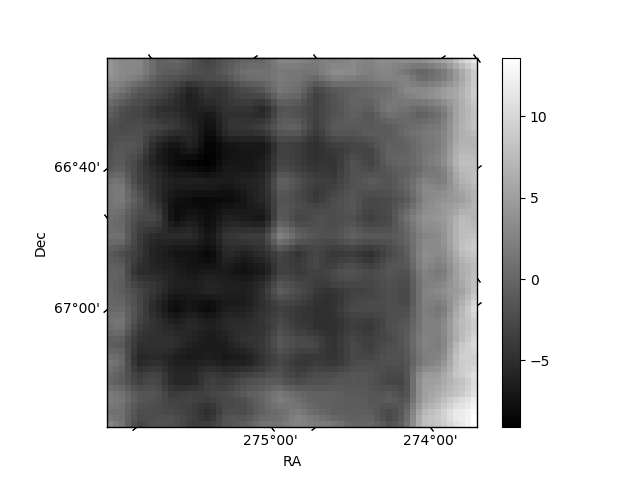
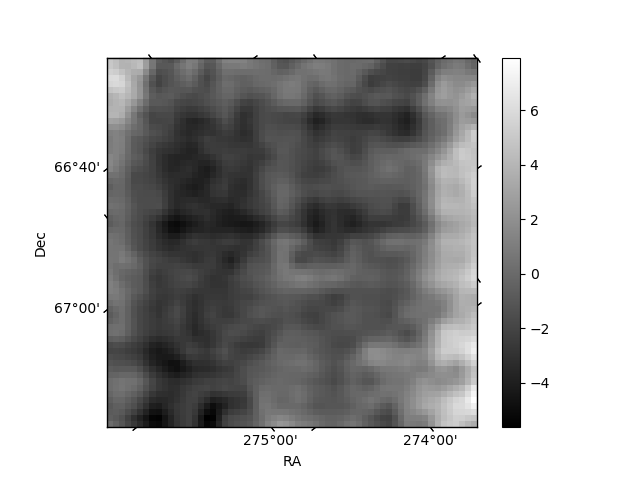
Histogram calculated using DETX and DETY for each event in the final _common_clean file
| Quadrant A | 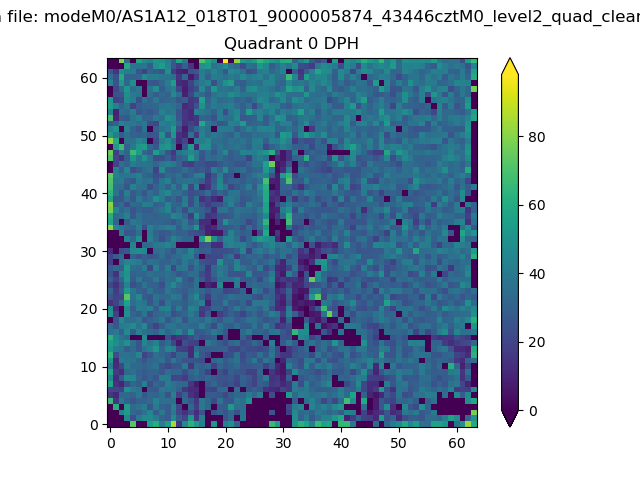 |
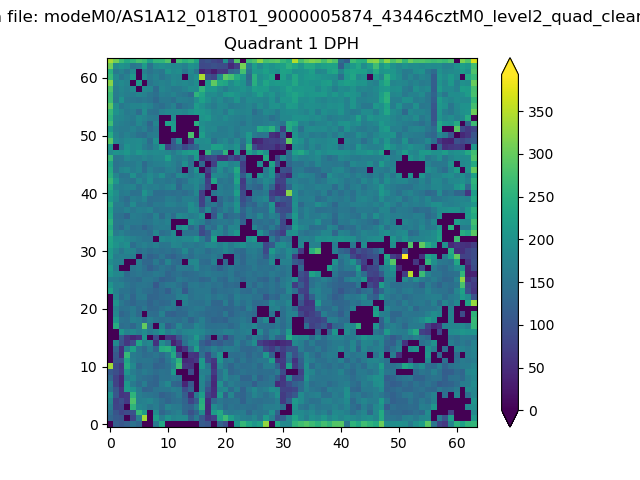 |
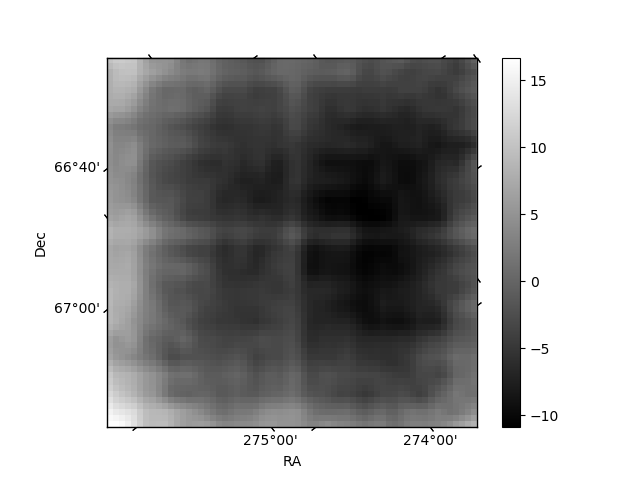
Quadrant B |
|---|---|---|---|
| Quadrant D | 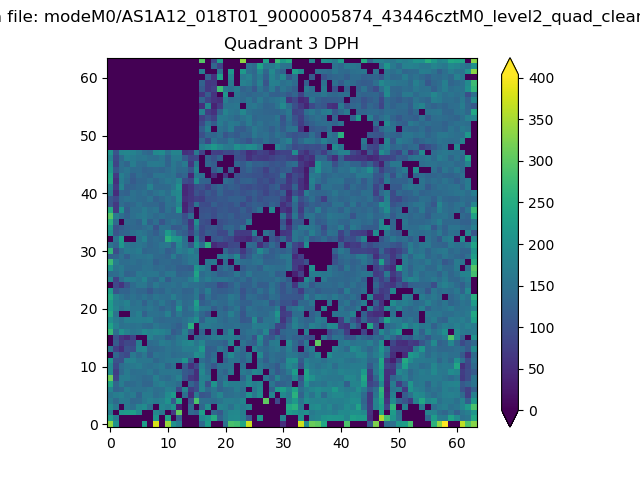 |
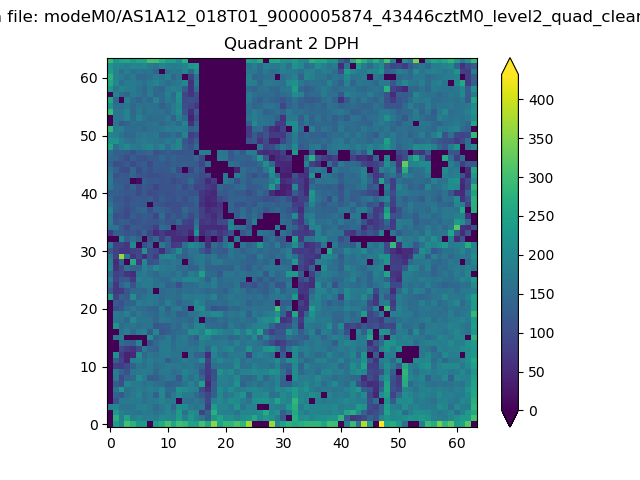 |
Quadrant C |
| Plot type | Count rate plots | Images |
|---|---|---|
| Comparison with Poisson distribution Blue bars denote a histogram of data divided into 1 sec bins. Red curve is a Poisson curve with rate = median count rate of data. |
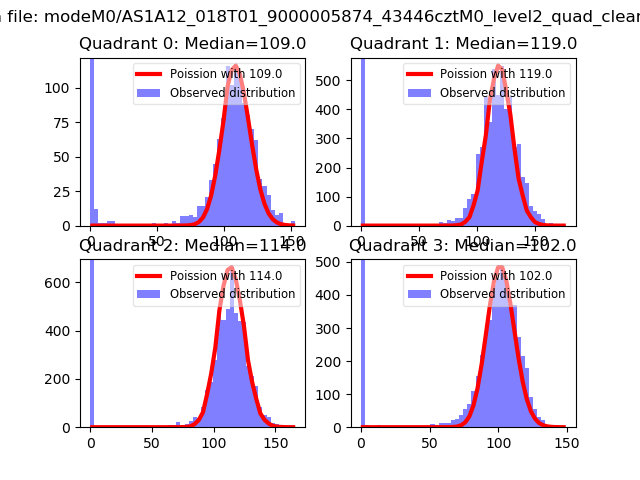 |
 |
| Quadrant-wise count rates Data is divided into 100 sec bins |
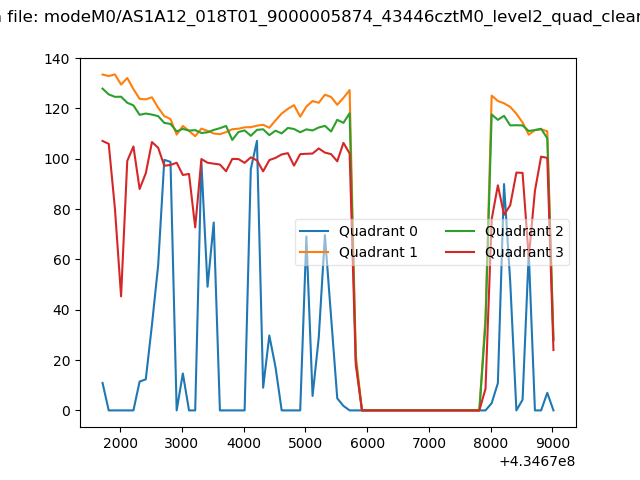 |
|
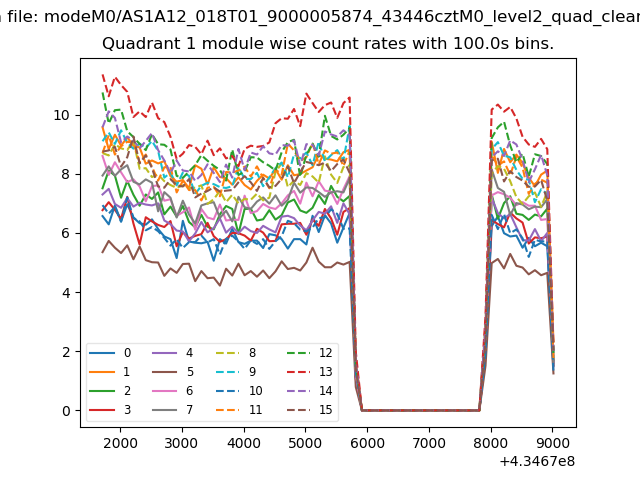
| Module-wise count rates for Quadrant A Data is divided into 100 sec bins |
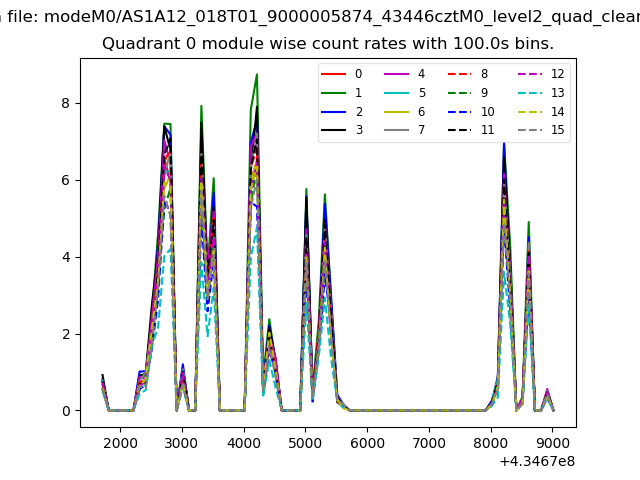 |
 |
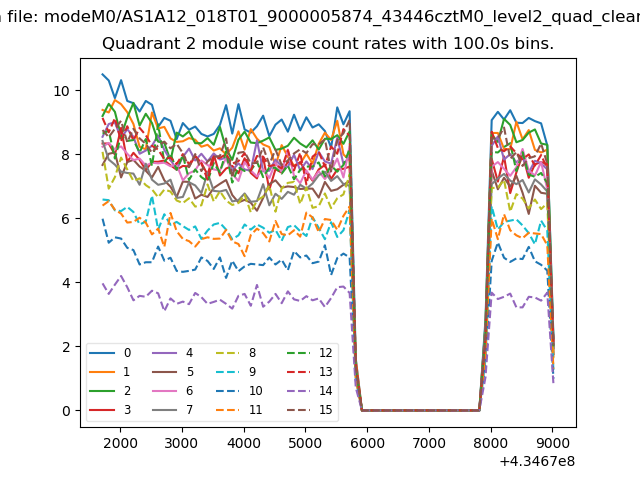
| Module-wise count rates for Quadrant B Data is divided into 100 sec bins |
 |
 |
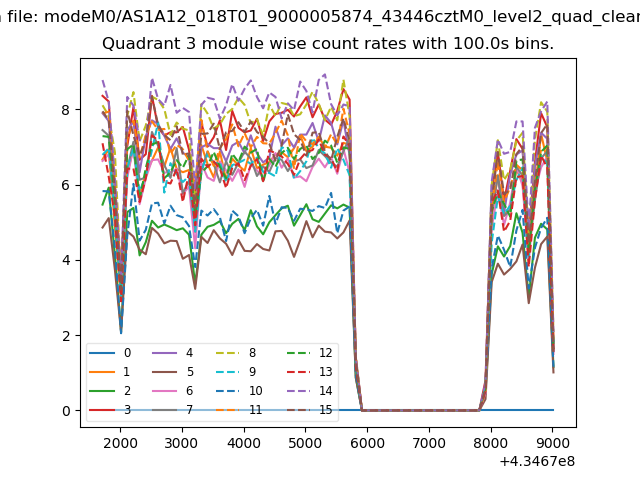
| Module-wise count rates for Quadrant C Data is divided into 100 sec bins |
 |
 |
| Module-wise count rates for Quadrant D Data is divided into 100 sec bins |
 |
 |
| Parameter | Plot |
|---|---|
| CZT HV Monitor | 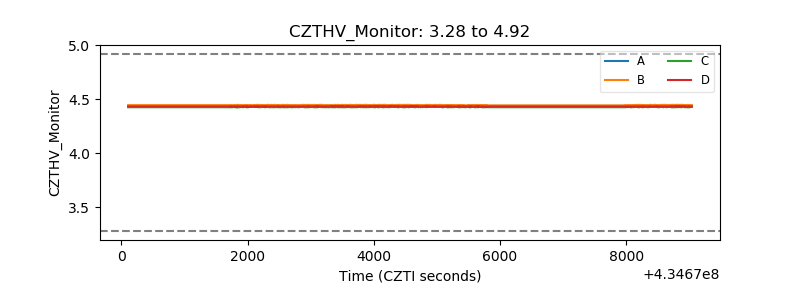 |
| D_VDD | 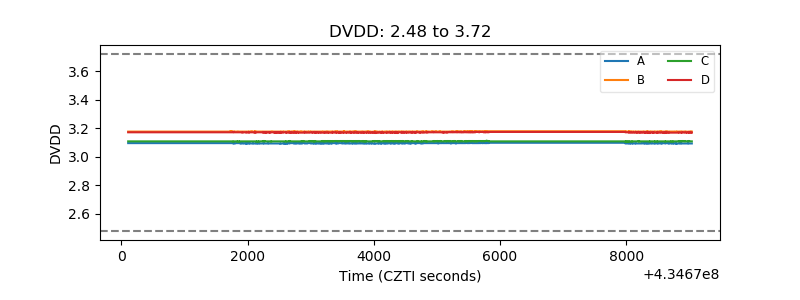 |
| Temperature 1 | 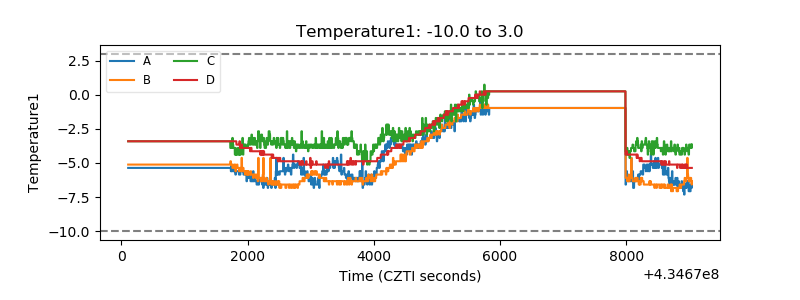 |
| Veto HV Monitor | 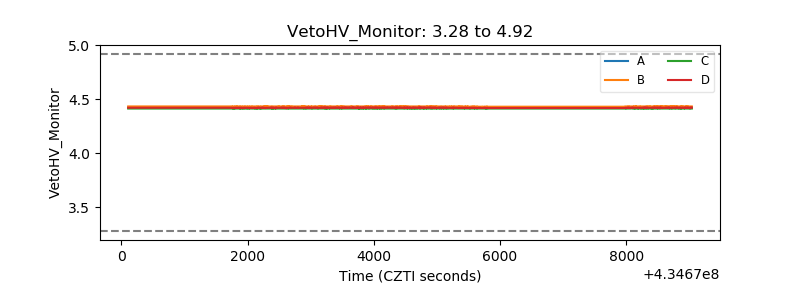 |
| Veto LLD | 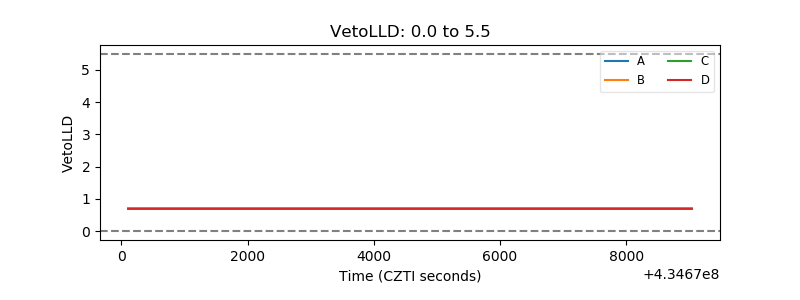 |
| Alpha Counter | 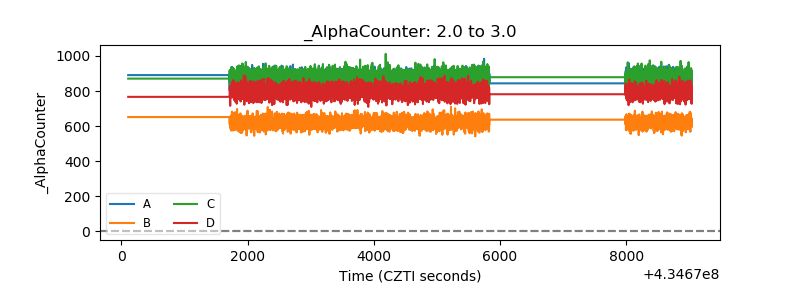 |
| _CPM_Rate | 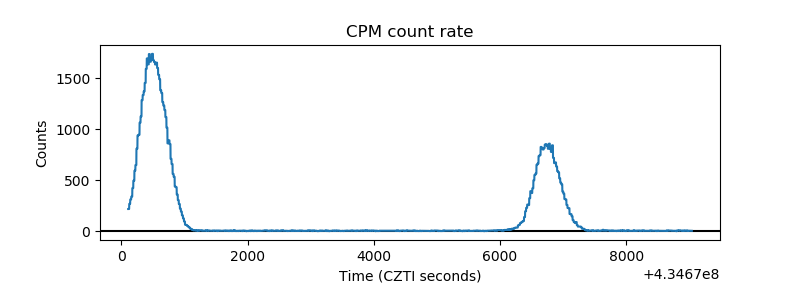 |
| CZT Counter | 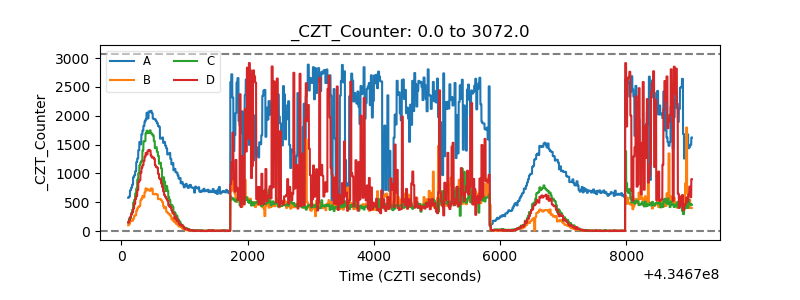 |
| +2.5 Volts monitor | 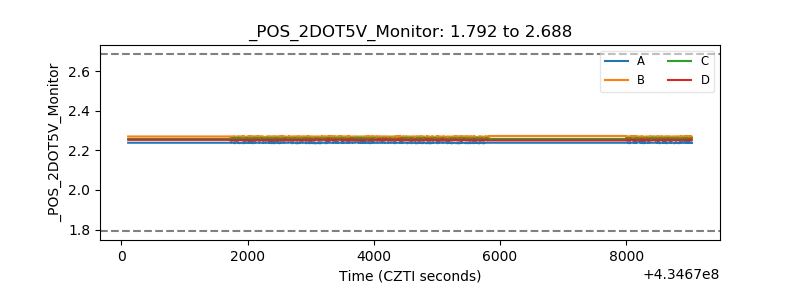 |
| +5 Volts monitor | 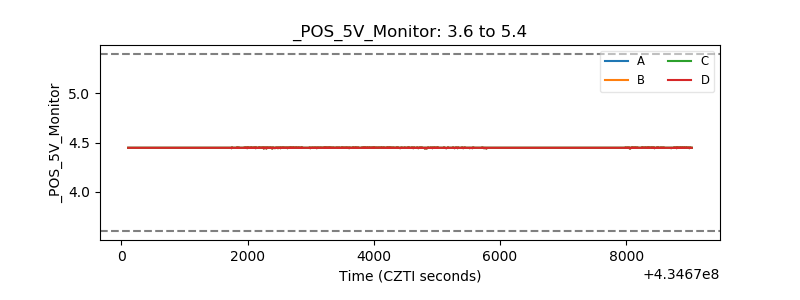 |
| _ROLL_ROT |  |
| _Roll_DEC | 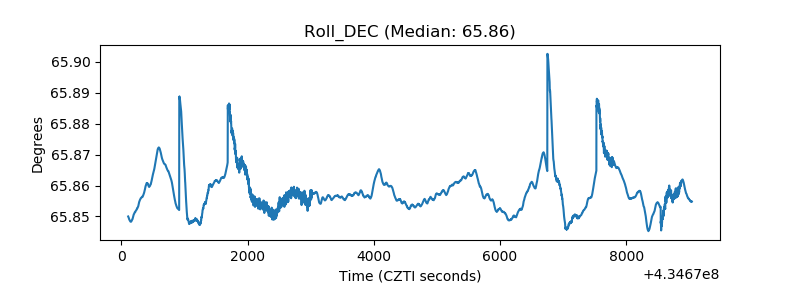 |
| _Roll_RA | 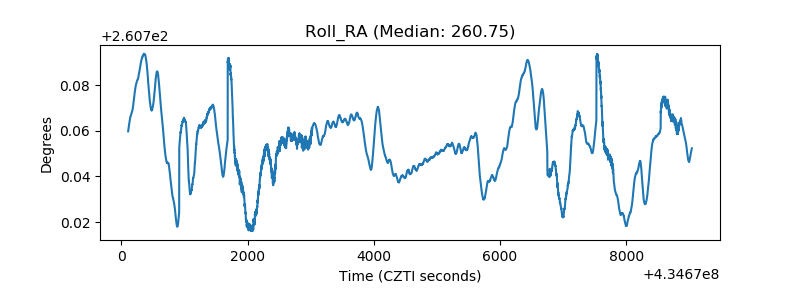 |
| Veto Counter | 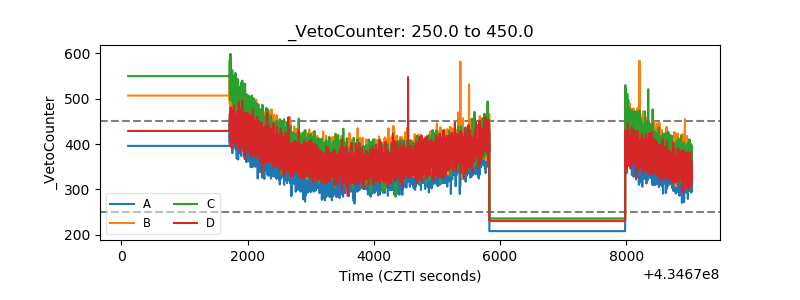 |