| Param | Original file | Final file |
|---|---|---|
| Filename | modeM0/AS1A12_018T01_9000005874_43447cztM0_level2.fits | modeM0/AS1A12_018T01_9000005874_43447cztM0_level2_quad_clean.evt |
| Size (bytes) | 632,255,040 | 69,174,720 |
| Size | 603.0 MB | 66.0 MB |
| Events in quadrant A | 10,082,556 | 177,082 |
| Events in quadrant B | 4,446,017 | 542,636 |
| Events in quadrant C | 2,373,901 | 565,944 |
| Events in quadrant D | 6,099,480 | 445,877 |
| Mode M0 | |||
|---|---|---|---|
| Quadrant | BADHDUFLAG | Total packets | Discarded packets |
| A | 0 | 33529 | 5 |
| B | 0 | 16682 | 2 |
| C | 0 | 10484 | 2 |
| D | 0 | 21804 | 2 |
| Mode M9 | |||
|---|---|---|---|
| Quadrant | BADHDUFLAG | Total packets | Discarded packets |
| A | 0 | 34 | 0 |
| B | 0 | 35 | 0 |
| C | 0 | 35 | 0 |
| D | 0 | 35 | 0 |
| Mode SS | |||
|---|---|---|---|
| Quadrant | BADHDUFLAG | Total packets | Discarded packets |
| A | 0 | 106 | 0 |
| B | 0 | 106 | 0 |
| C | 0 | 106 | 0 |
| D | 0 | 106 | 0 |
| Quadrant | Total seconds | Saturated seconds | Saturation percentage |
|---|---|---|---|
| A | 5176 | 3705 | 71.580371% |
| B | 5176 | 527 | 10.181607% |
| C | 5176 | 7 | 0.135240% |
| D | 5176 | 963 | 18.605100% |
Noise dominated data is calculated using 1-second bins in cleaned event files. If a bin has >2000 counts, and if more than 50% of those come from <1% of pixels, then it is considered to be noise-dominated and hence unusable.
| Quadrant | # 1 sec bins | Bins with >0 counts | Bins with >2000 counts | High rate bins dominated by noise | Noise dominated (total time) | Noise dominated (detector-on time) | Marked lightcurve |
|---|---|---|---|---|---|---|---|
| A | 7269 | 5176 | 2798 | 2798 | 38.49% | 54.06% | 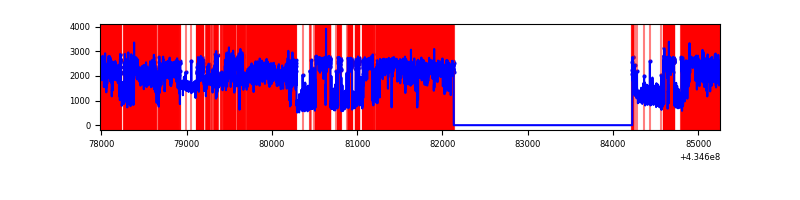 |
| B | 7269 | 5177 | 395 | 395 | 5.43% | 7.63% | 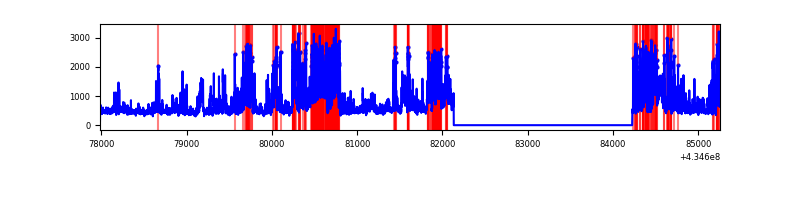 |
| C | 7269 | 5177 | 0 | 0 | 0.00% | 0.00% | 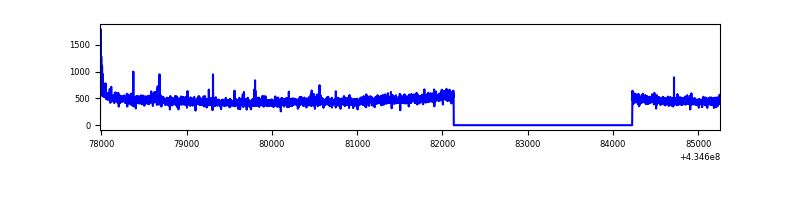 |
| D | 7269 | 5177 | 963 | 963 | 13.25% | 18.60% | 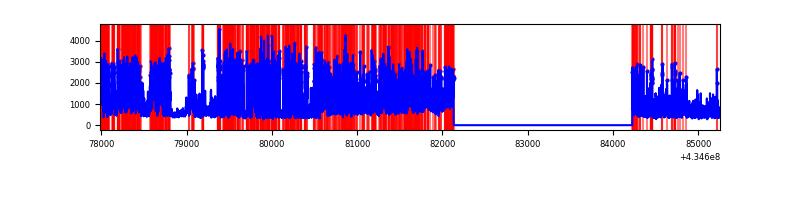 |
Top three noisy pixels from each quadrant. If the there are fewer than three noisy pixels in the level2.evt file, extra rows are filled as -1
| Pixel properties | Quadrant properties | ||||||
|---|---|---|---|---|---|---|---|
| Quadrant | DetID | PixID | Counts | Sigma | Mean | Median | Sigma |
| A | 15 | 222 | 8294160 | 164768.09 | 239 | 235 | 50.3 |
| A | 15 | 237 | 557127 | 11063.28 | 239 | 235 | 50.3 |
| A | 10 | 83 | 293723 | 5830.47 | 239 | 235 | 50.3 |
| B | 0 | 190 | 2010466 | 19753.48 | 531 | 516 | 101.8 |
| B | 0 | 199 | 162275 | 1589.74 | 531 | 516 | 101.8 |
| B | 0 | 189 | 68575 | 668.87 | 531 | 516 | 101.8 |
| C | 15 | 214 | 216889 | 1724.01 | 537 | 540 | 125.5 |
| C | 3 | 233 | 57032 | 450.17 | 537 | 540 | 125.5 |
| C | 7 | 220 | 3837 | 26.27 | 537 | 540 | 125.5 |
| D | 1 | 52 | 3638079 | 30193.22 | 487 | 471 | 120.5 |
| D | 2 | 16 | 275061 | 2279.18 | 487 | 471 | 120.5 |
| D | 13 | 249 | 162748 | 1346.95 | 487 | 471 | 120.5 |
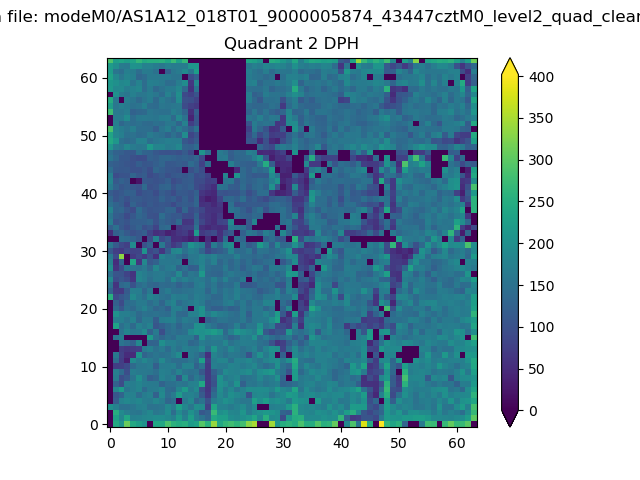
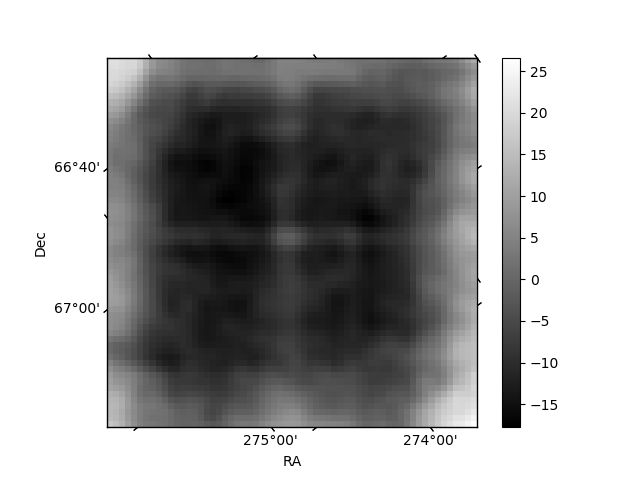
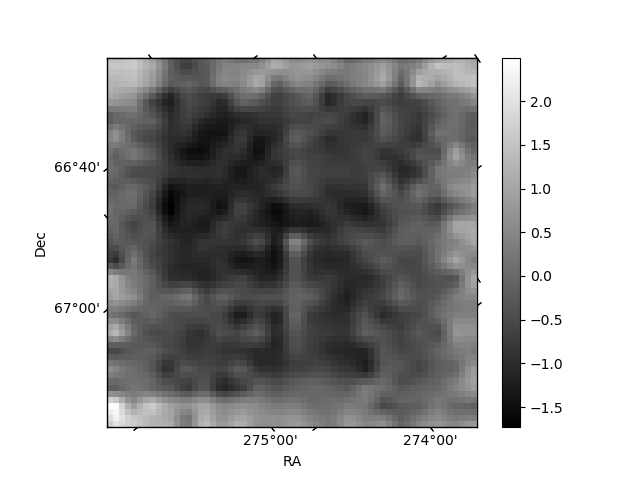
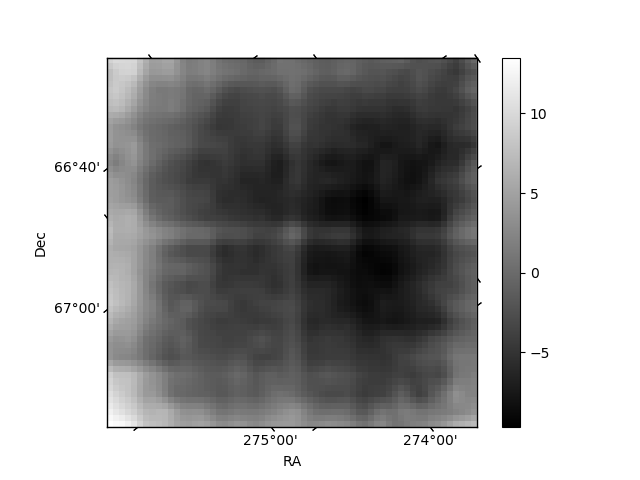
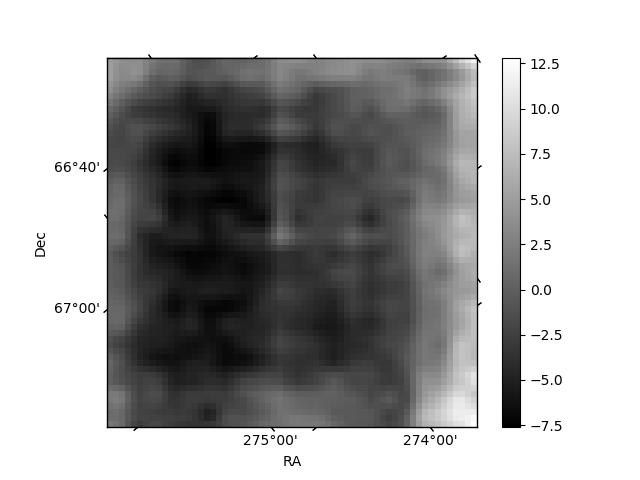
Histogram calculated using DETX and DETY for each event in the final _common_clean file
| Quadrant A | 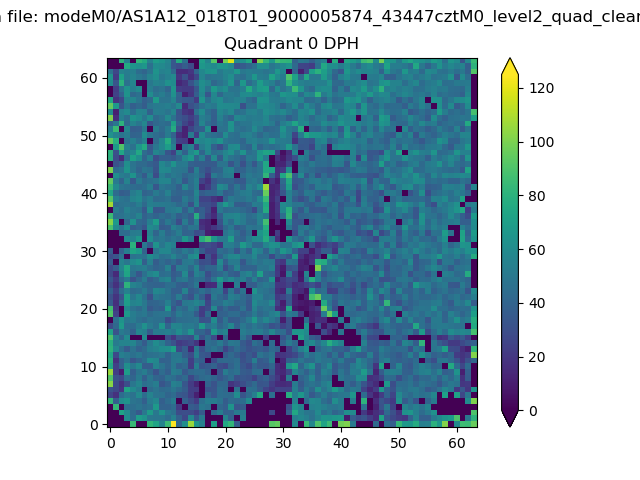 |
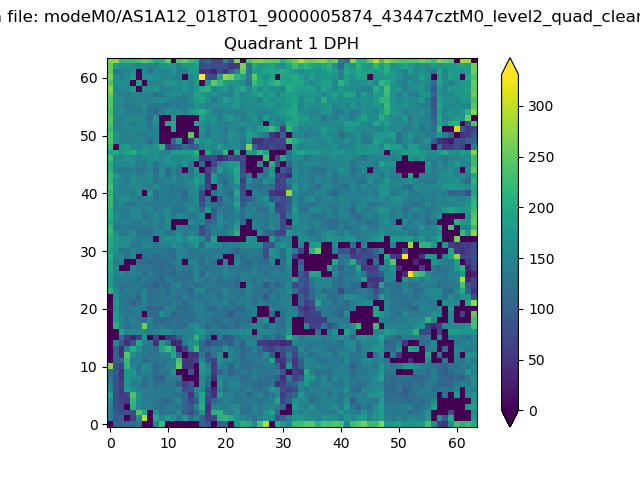 |
Quadrant B |
|---|---|---|---|
| Quadrant D | 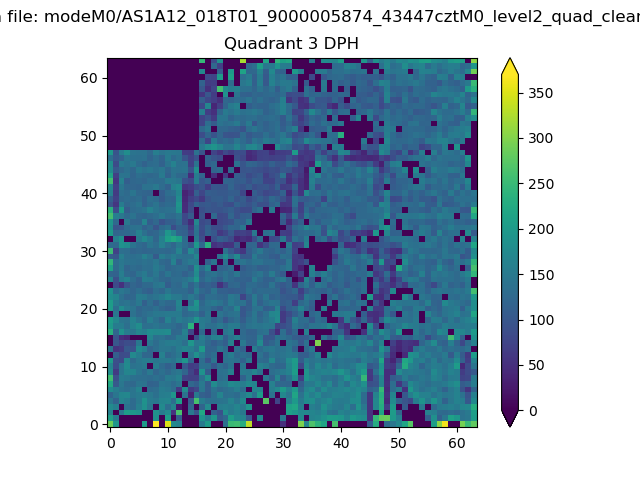 |
 |
Quadrant C |
| Plot type | Count rate plots | Images |
|---|---|---|
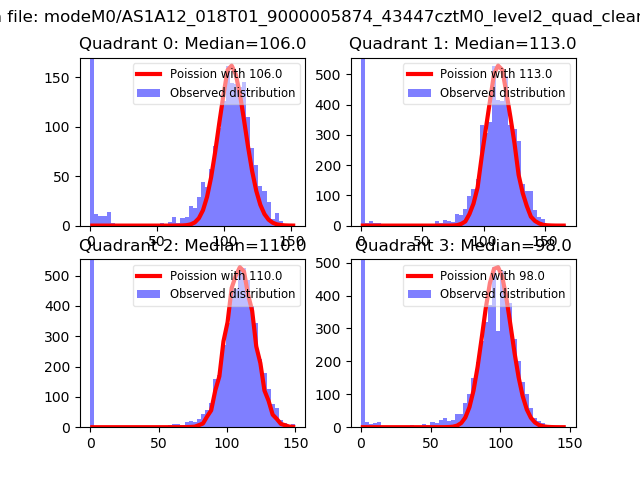
| Comparison with Poisson distribution Blue bars denote a histogram of data divided into 1 sec bins. Red curve is a Poisson curve with rate = median count rate of data. |
 |
 |
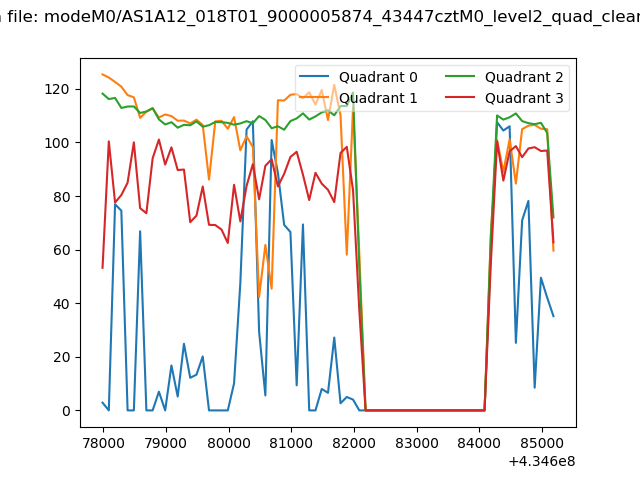
| Quadrant-wise count rates Data is divided into 100 sec bins |
 |
|
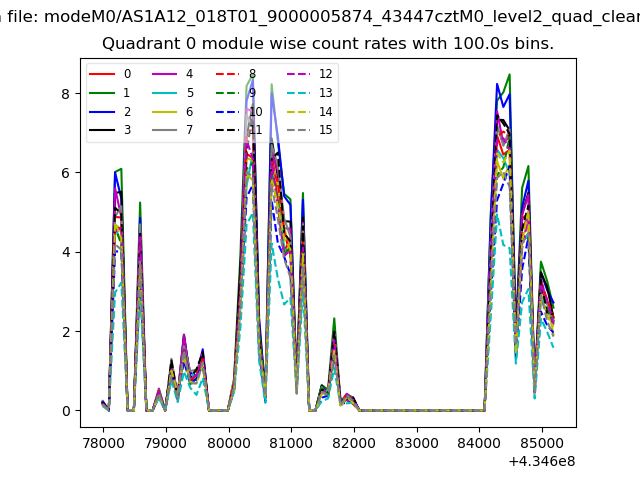
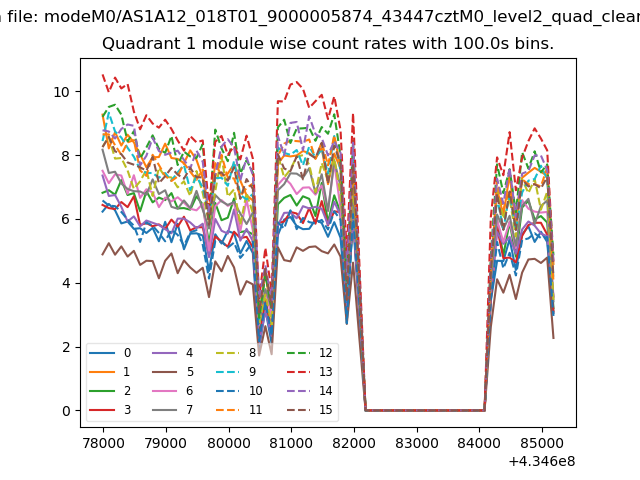
| Module-wise count rates for Quadrant A Data is divided into 100 sec bins |
 |
 |
| Module-wise count rates for Quadrant B Data is divided into 100 sec bins |
 |
 |
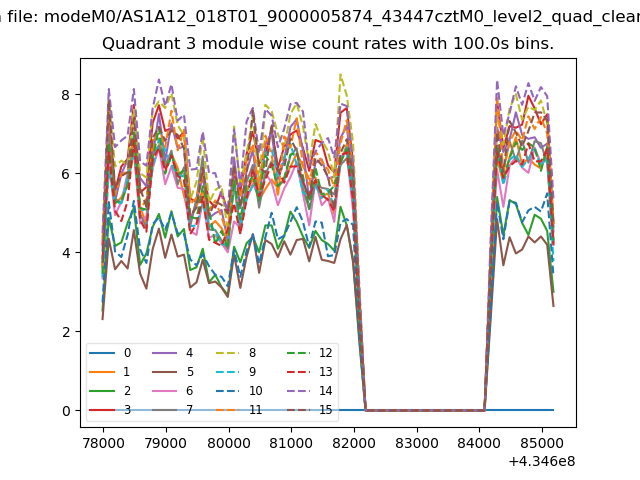
| Module-wise count rates for Quadrant C Data is divided into 100 sec bins |
 |
 |
| Module-wise count rates for Quadrant D Data is divided into 100 sec bins |
 |
 |
| Parameter | Plot |
|---|---|
| CZT HV Monitor | 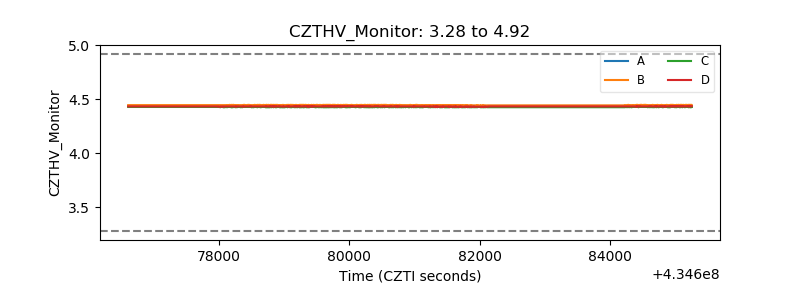 |
| D_VDD | 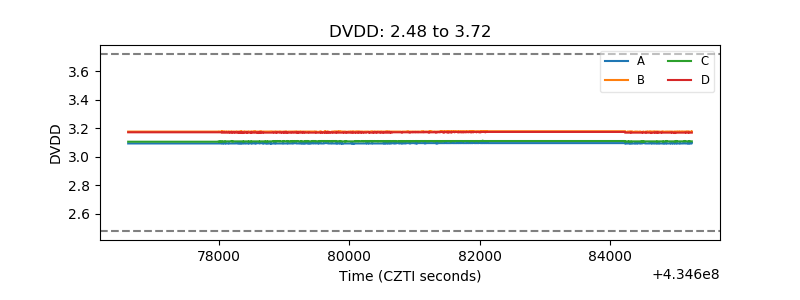 |
| Temperature 1 | 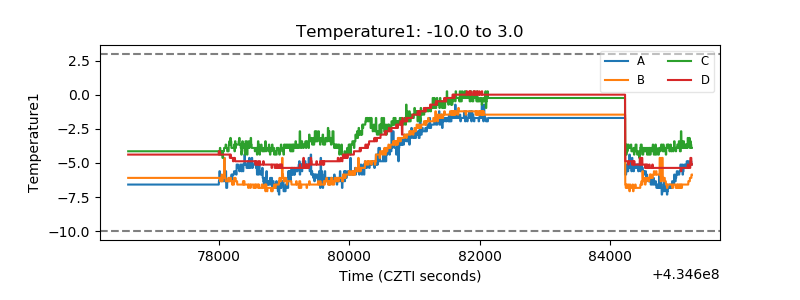 |
| Veto HV Monitor |  |
| Veto LLD | 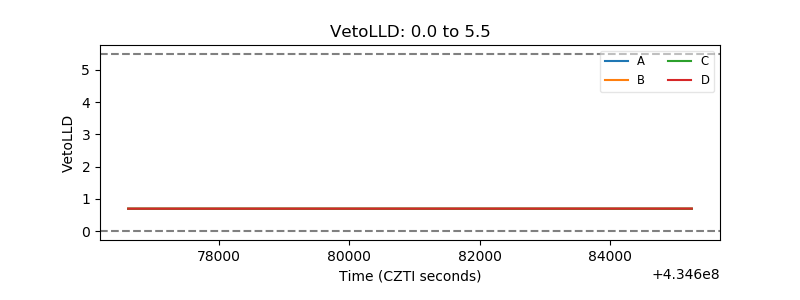 |
| Alpha Counter | 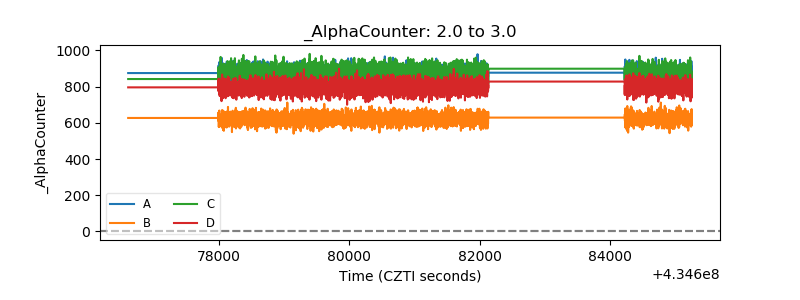 |
| _CPM_Rate | 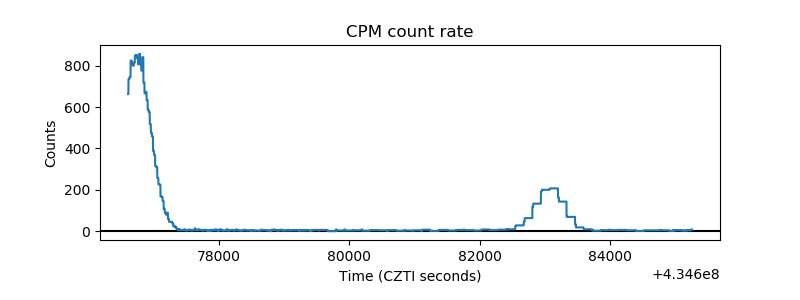 |
| CZT Counter | 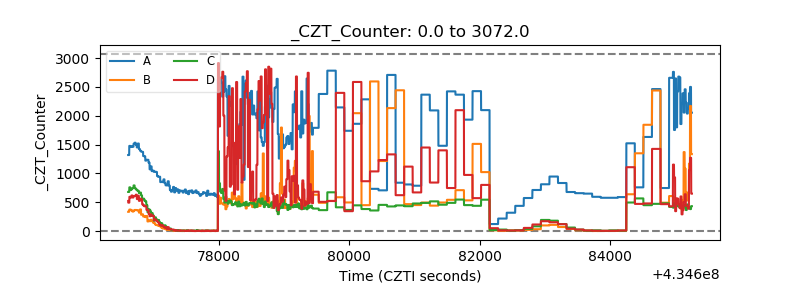 |
| +2.5 Volts monitor | 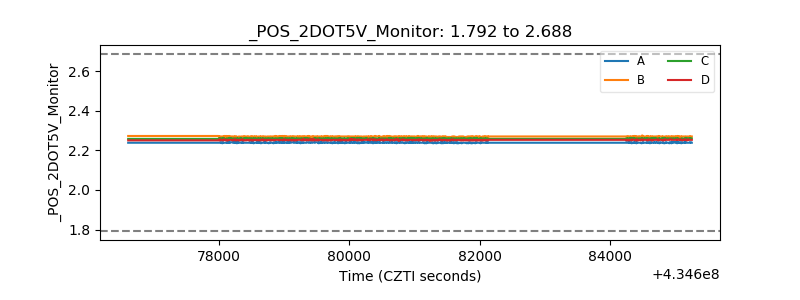 |
| +5 Volts monitor | 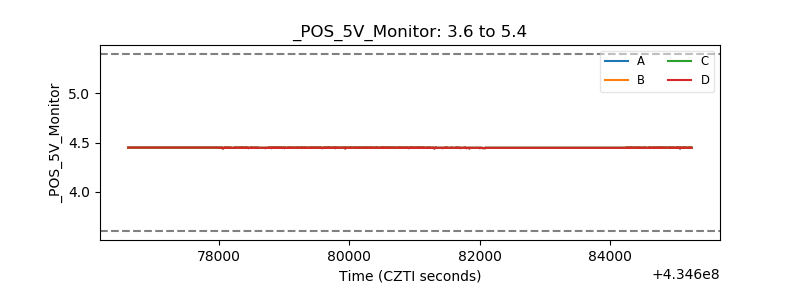 |
| _ROLL_ROT | 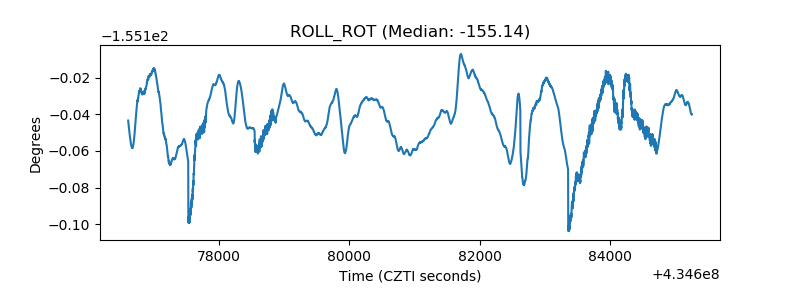 |
| _Roll_DEC | 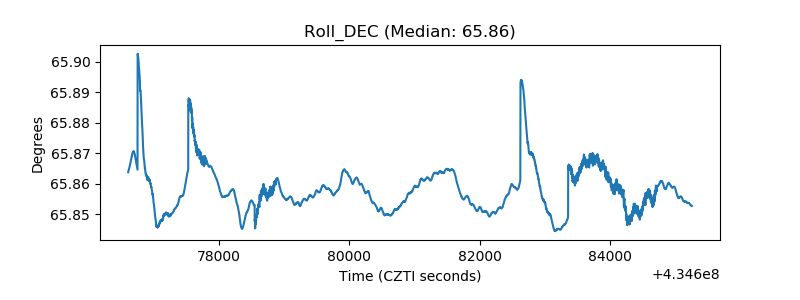 |
| _Roll_RA | 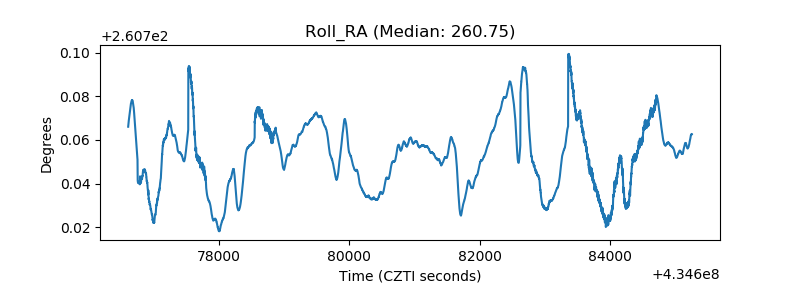 |
| Veto Counter | 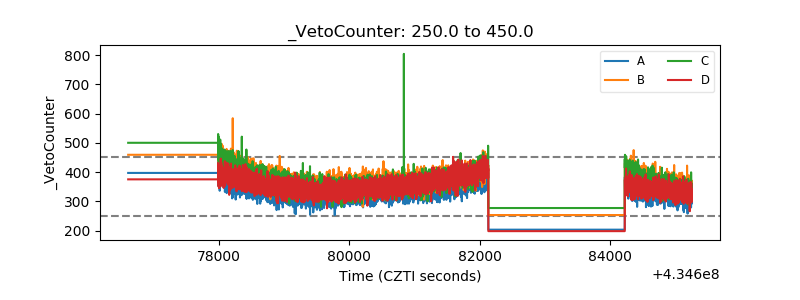 |