| Param | Original file | Final file |
|---|---|---|
| Filename | modeM0/AS1A12_018T01_9000005874_43448cztM0_level2.fits | modeM0/AS1A12_018T01_9000005874_43448cztM0_level2_quad_clean.evt |
| Size (bytes) | 636,583,680 | 69,336,000 |
| Size | 607.1 MB | 66.1 MB |
| Events in quadrant A | 12,502,987 | 100,018 |
| Events in quadrant B | 3,550,746 | 574,673 |
| Events in quadrant C | 2,378,621 | 563,059 |
| Events in quadrant D | 4,718,875 | 489,152 |
| Mode M0 | |||
|---|---|---|---|
| Quadrant | BADHDUFLAG | Total packets | Discarded packets |
| A | 0 | 40796 | 2 |
| B | 0 | 14293 | 2 |
| C | 0 | 10693 | 2 |
| D | 0 | 17797 | 2 |
| Mode M9 | |||
|---|---|---|---|
| Quadrant | BADHDUFLAG | Total packets | Discarded packets |
| A | 0 | 31 | 0 |
| B | 0 | 32 | 0 |
| C | 0 | 32 | 0 |
| D | 0 | 32 | 0 |
| Mode SS | |||
|---|---|---|---|
| Quadrant | BADHDUFLAG | Total packets | Discarded packets |
| A | 0 | 110 | 0 |
| B | 0 | 110 | 0 |
| C | 0 | 110 | 0 |
| D | 0 | 110 | 0 |
| Quadrant | Total seconds | Saturated seconds | Saturation percentage |
|---|---|---|---|
| A | 5313 | 4460 | 83.945040% |
| B | 5313 | 171 | 3.218521% |
| C | 5313 | 3 | 0.056465% |
| D | 5313 | 385 | 7.246377% |
Noise dominated data is calculated using 1-second bins in cleaned event files. If a bin has >2000 counts, and if more than 50% of those come from <1% of pixels, then it is considered to be noise-dominated and hence unusable.
| Quadrant | # 1 sec bins | Bins with >0 counts | Bins with >2000 counts | High rate bins dominated by noise | Noise dominated (total time) | Noise dominated (detector-on time) | Marked lightcurve |
|---|---|---|---|---|---|---|---|
| A | 7195 | 5312 | 4418 | 4418 | 61.40% | 83.17% | 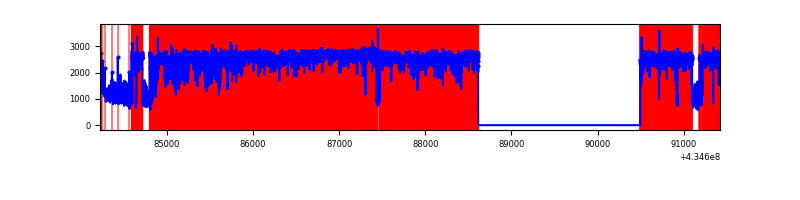 |
| B | 7196 | 5314 | 105 | 105 | 1.46% | 1.98% | 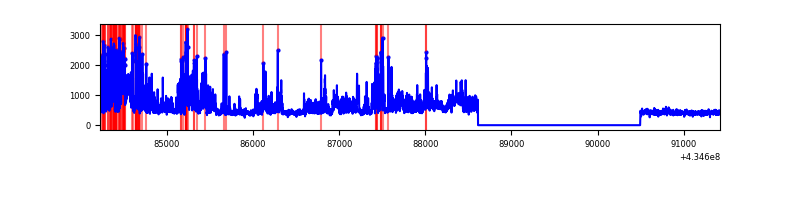 |
| C | 7196 | 5314 | 0 | 0 | 0.00% | 0.00% | 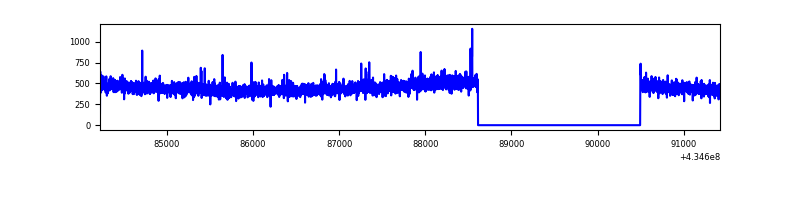 |
| D | 7196 | 5314 | 419 | 419 | 5.82% | 7.88% | 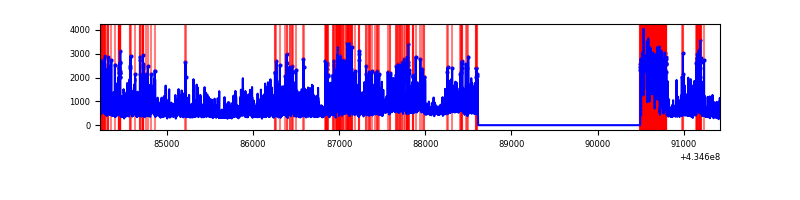 |
Top three noisy pixels from each quadrant. If the there are fewer than three noisy pixels in the level2.evt file, extra rows are filled as -1
| Pixel properties | Quadrant properties | ||||||
|---|---|---|---|---|---|---|---|
| Quadrant | DetID | PixID | Counts | Sigma | Mean | Median | Sigma |
| A | 15 | 222 | 8135931 | 143199.61 | 270 | 264 | 56.8 |
| A | 15 | 237 | 2966338 | 52207.23 | 270 | 264 | 56.8 |
| A | 10 | 83 | 342130 | 6017.34 | 270 | 264 | 56.8 |
| B | 0 | 190 | 854746 | 8005.41 | 553 | 539 | 106.7 |
| B | 0 | 199 | 243713 | 2278.97 | 553 | 539 | 106.7 |
| B | 0 | 189 | 74256 | 690.86 | 553 | 539 | 106.7 |
| C | 15 | 214 | 221338 | 1733.96 | 545 | 550 | 127.3 |
| C | 3 | 233 | 31578 | 243.68 | 545 | 550 | 127.3 |
| C | 13 | 61 | 3749 | 25.12 | 545 | 550 | 127.3 |
| D | 1 | 52 | 1803256 | 13994.28 | 524 | 507 | 128.8 |
| D | 2 | 16 | 683953 | 5305.41 | 524 | 507 | 128.8 |
| D | 13 | 249 | 82564 | 636.98 | 524 | 507 | 128.8 |
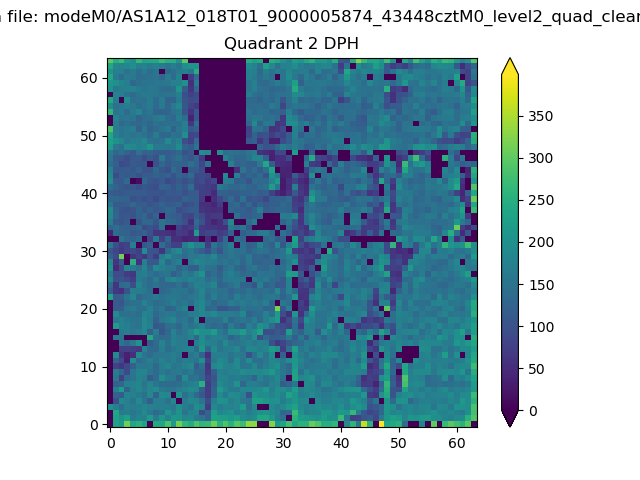
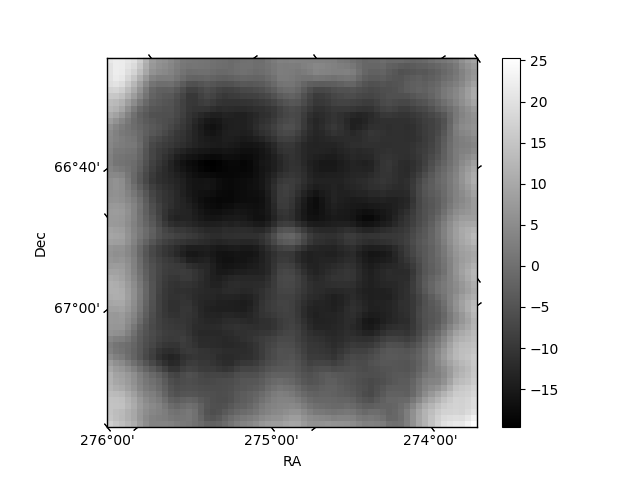
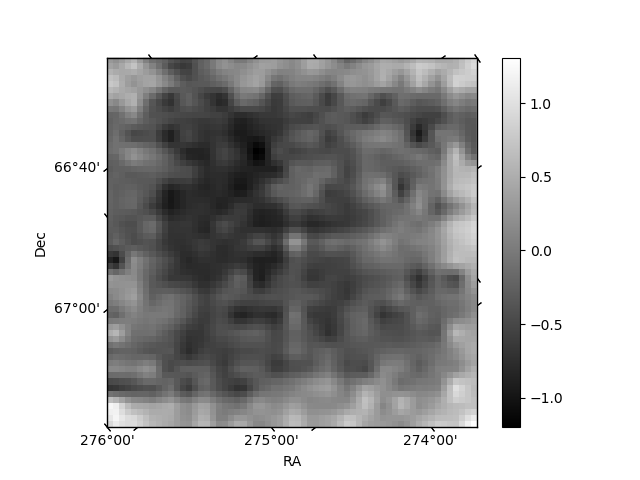
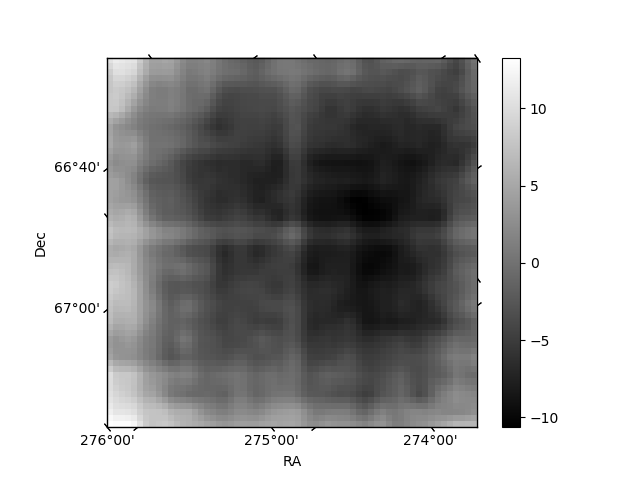
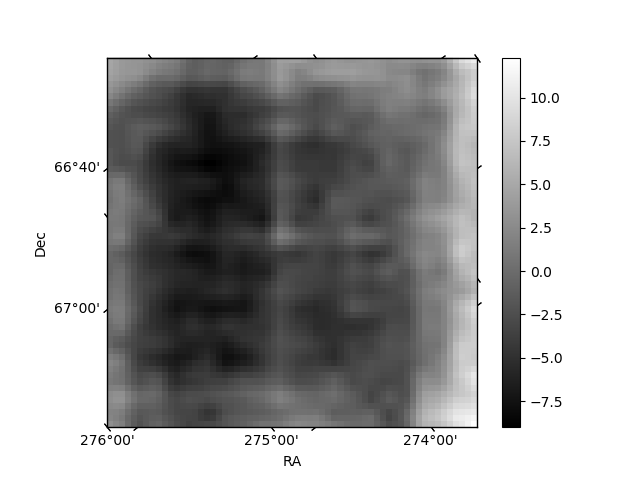
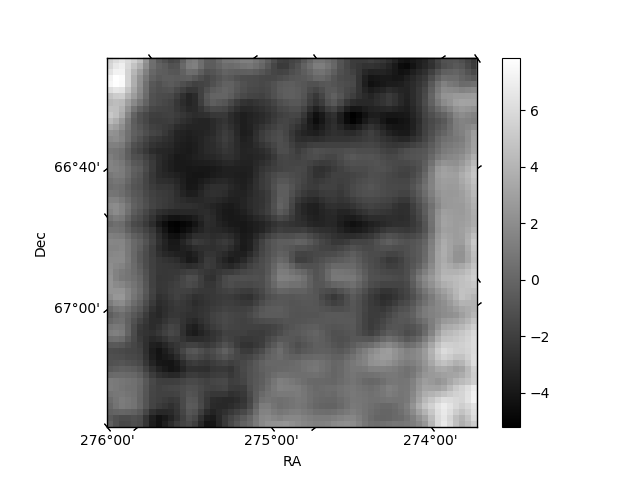
Histogram calculated using DETX and DETY for each event in the final _common_clean file
| Quadrant A | 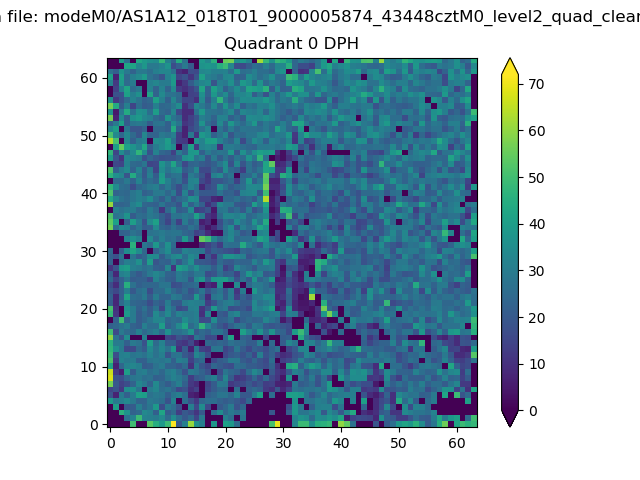 |
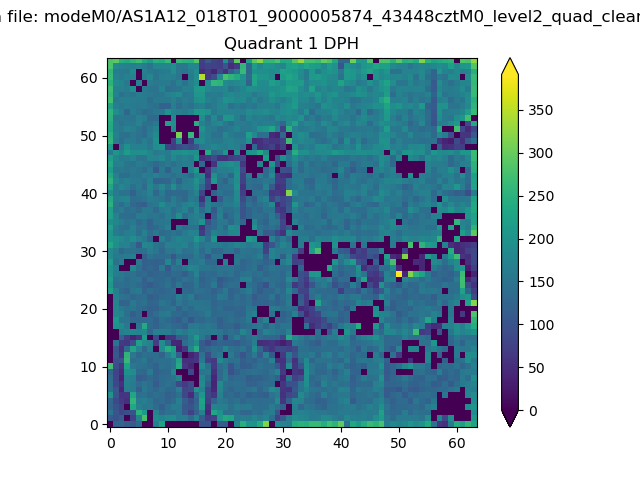 |
Quadrant B |
|---|---|---|---|
| Quadrant D | 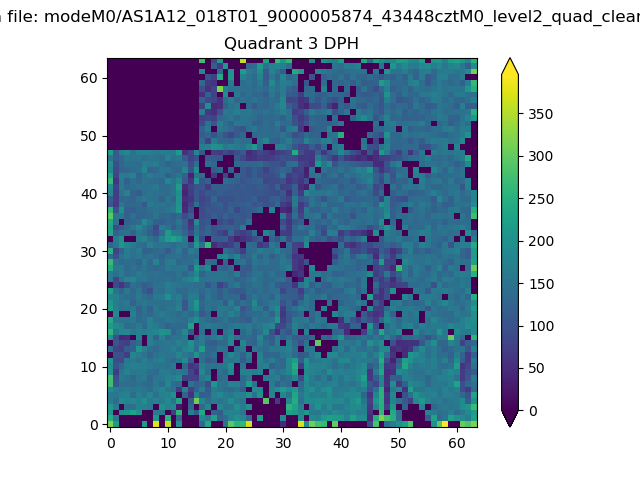 |
 |
Quadrant C |
| Plot type | Count rate plots | Images |
|---|---|---|
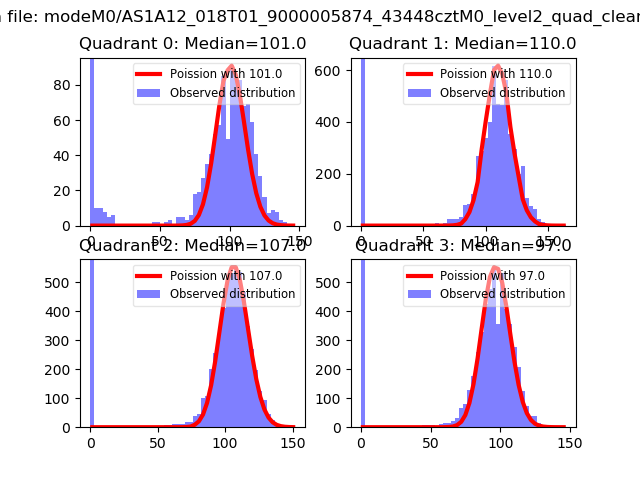
| Comparison with Poisson distribution Blue bars denote a histogram of data divided into 1 sec bins. Red curve is a Poisson curve with rate = median count rate of data. |
 |
 |
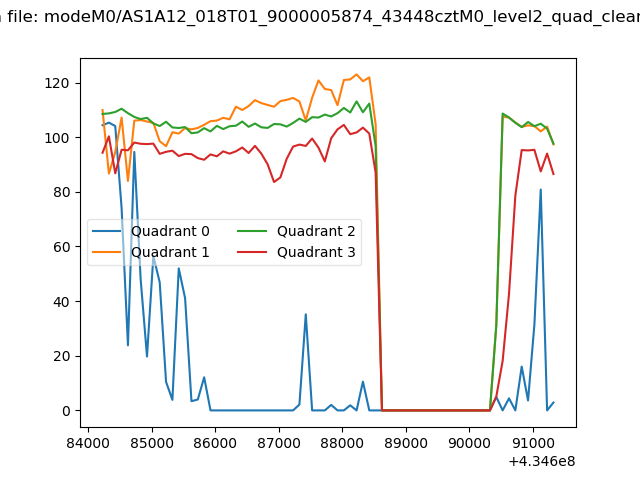
| Quadrant-wise count rates Data is divided into 100 sec bins |
 |
|
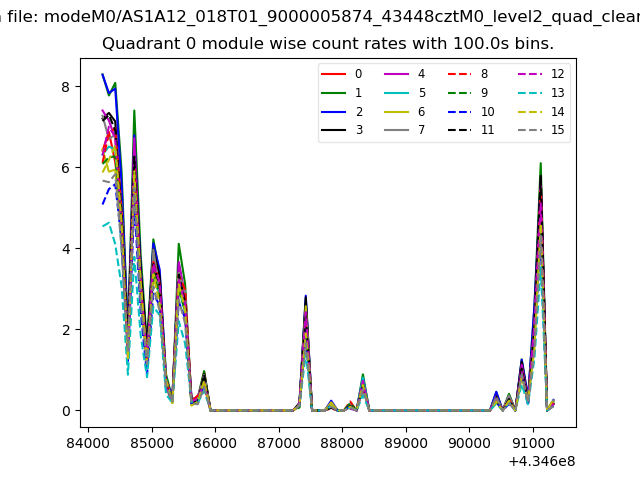
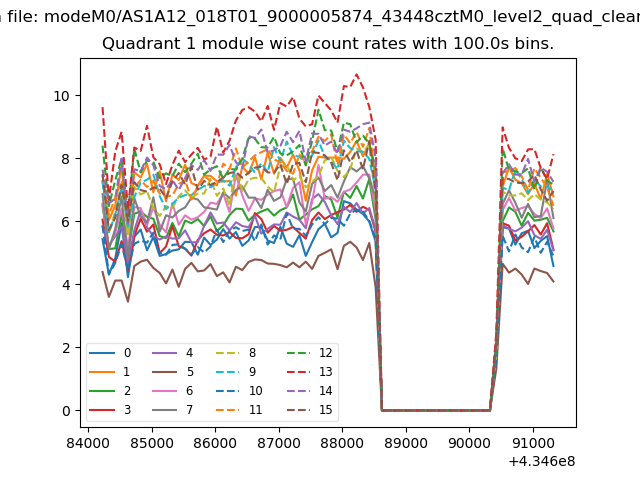
| Module-wise count rates for Quadrant A Data is divided into 100 sec bins |
 |
 |
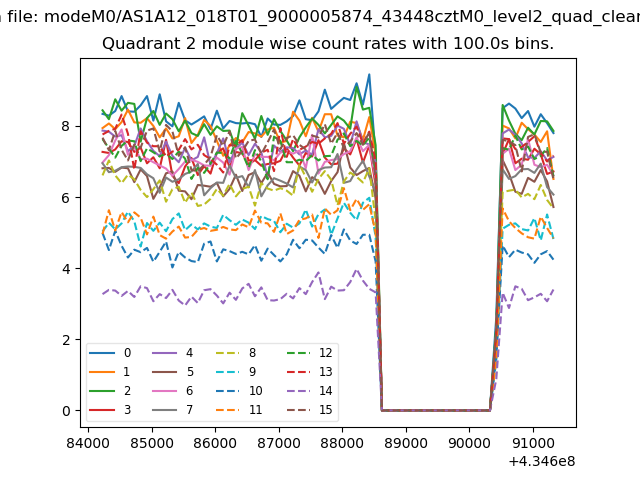
| Module-wise count rates for Quadrant B Data is divided into 100 sec bins |
 |
 |
| Module-wise count rates for Quadrant C Data is divided into 100 sec bins |
 |
 |
| Module-wise count rates for Quadrant D Data is divided into 100 sec bins |
 |
 |
| Parameter | Plot |
|---|---|
| CZT HV Monitor | 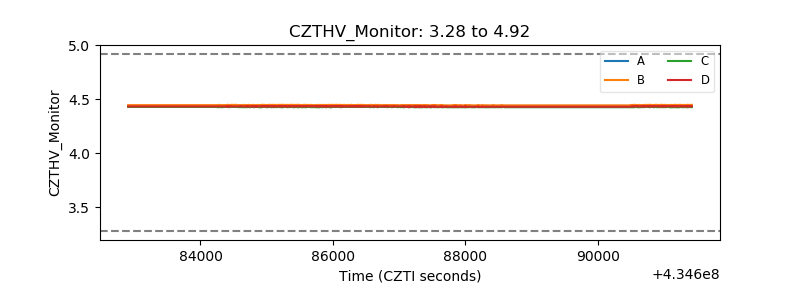 |
| D_VDD | 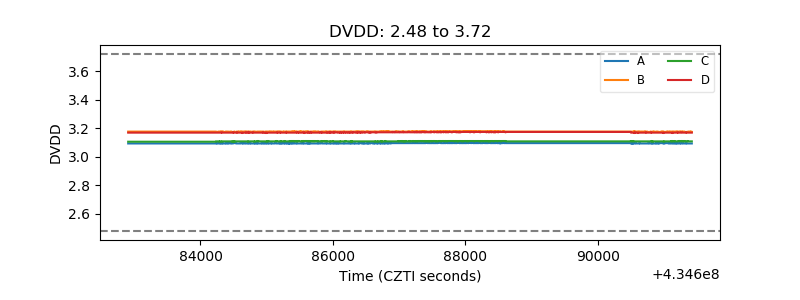 |
| Temperature 1 | 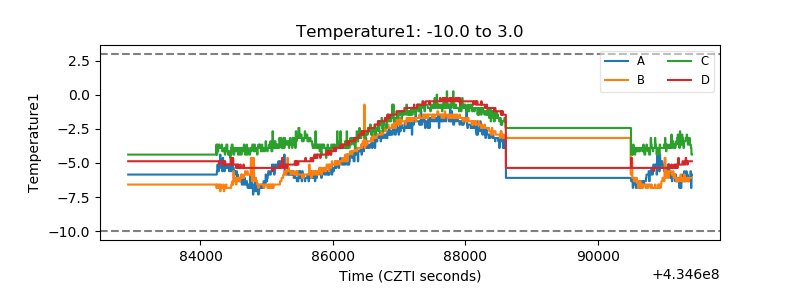 |
| Veto HV Monitor | 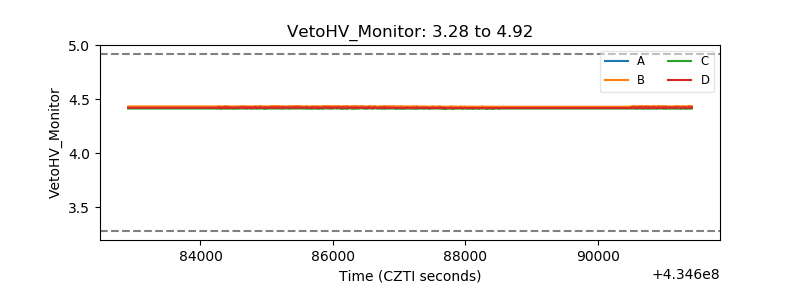 |
| Veto LLD | 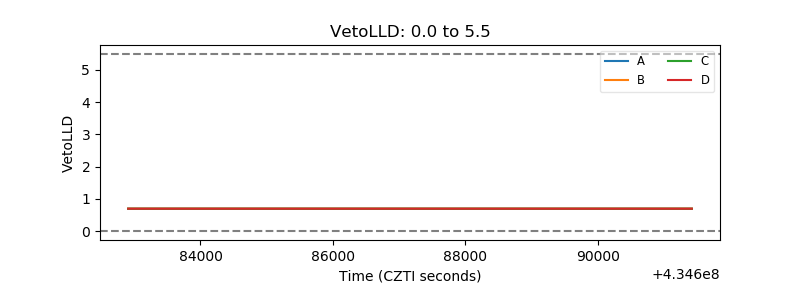 |
| Alpha Counter | 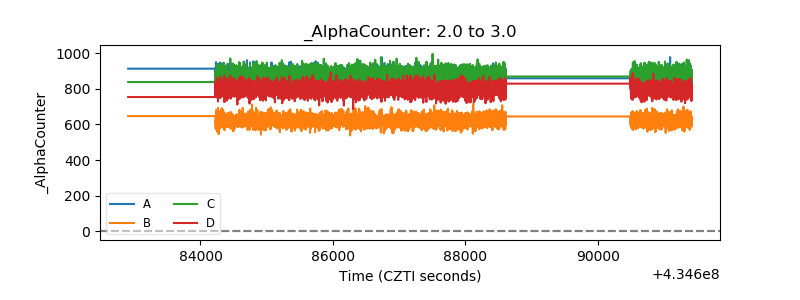 |
| _CPM_Rate | 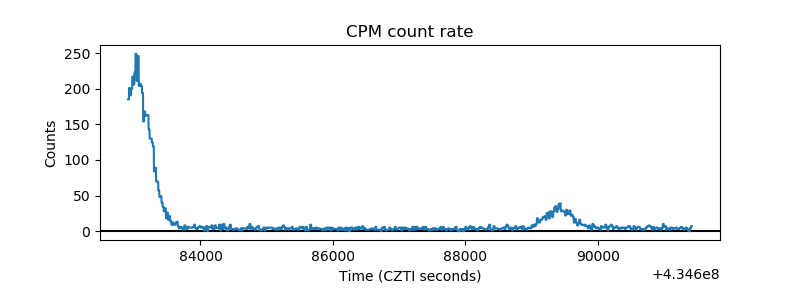 |
| CZT Counter | 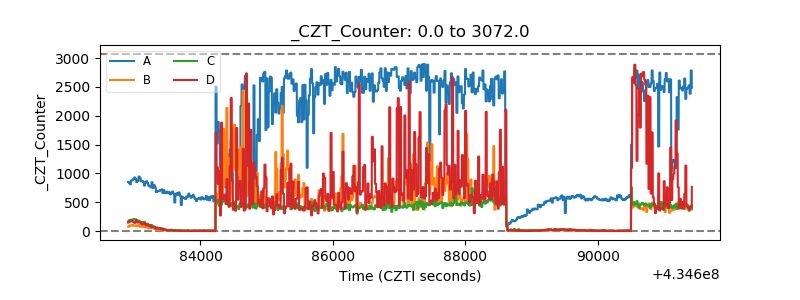 |
| +2.5 Volts monitor | 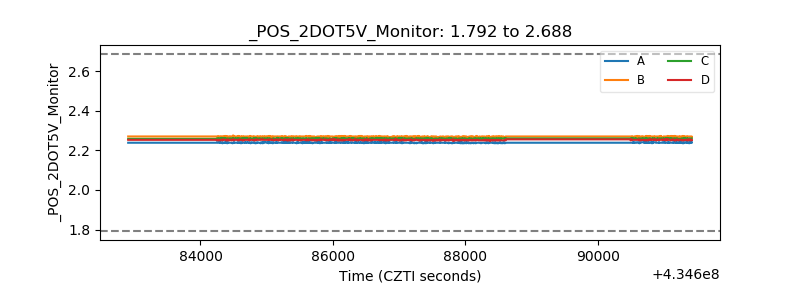 |
| +5 Volts monitor | 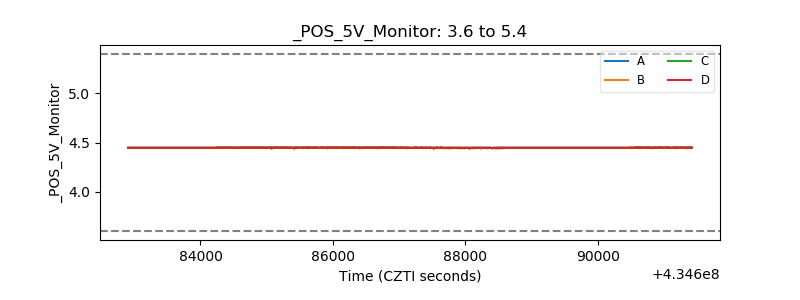 |
| _ROLL_ROT |  |
| _Roll_DEC | 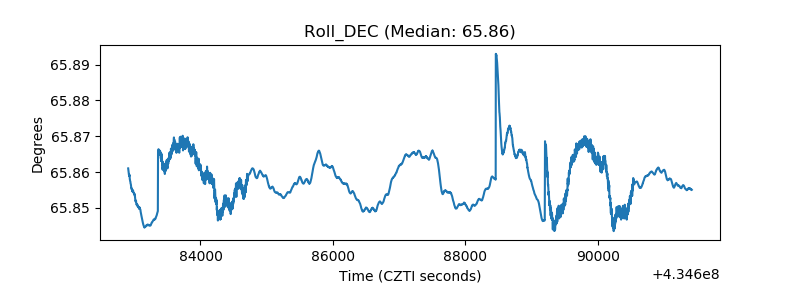 |
| _Roll_RA | 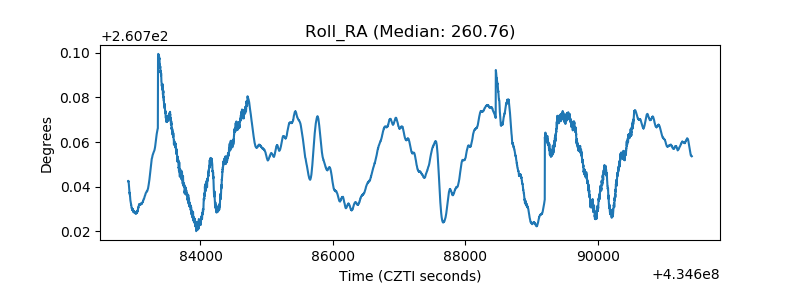 |
| Veto Counter | 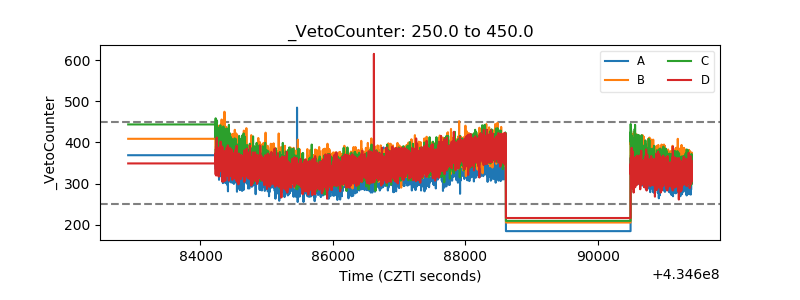 |