| Param | Original file | Final file |
|---|---|---|
| Filename | modeM0/AS1A12_018T01_9000005874_43451cztM0_level2.fits | modeM0/AS1A12_018T01_9000005874_43451cztM0_level2_quad_clean.evt |
| Size (bytes) | 493,603,200 | 89,568,000 |
| Size | 470.7 MB | 85.4 MB |
| Events in quadrant A | 6,631,889 | 511,683 |
| Events in quadrant B | 2,992,260 | 648,573 |
| Events in quadrant C | 2,819,775 | 608,075 |
| Events in quadrant D | 5,371,619 | 533,316 |
| Mode M0 | |||
|---|---|---|---|
| Quadrant | BADHDUFLAG | Total packets | Discarded packets |
| A | 0 | 23577 | 1 |
| B | 0 | 12859 | 1 |
| C | 0 | 12140 | 1 |
| D | 0 | 19983 | 1 |
| Mode M9 | |||
|---|---|---|---|
| Quadrant | BADHDUFLAG | Total packets | Discarded packets |
| A | 0 | 13 | 0 |
| B | 0 | 13 | 0 |
| C | 0 | 13 | 0 |
| D | 0 | 13 | 0 |
| Mode SS | |||
|---|---|---|---|
| Quadrant | BADHDUFLAG | Total packets | Discarded packets |
| A | 0 | 118 | 0 |
| B | 0 | 118 | 0 |
| C | 0 | 118 | 0 |
| D | 0 | 118 | 0 |
| Quadrant | Total seconds | Saturated seconds | Saturation percentage |
|---|---|---|---|
| A | 5872 | 1255 | 21.372616% |
| B | 5872 | 21 | 0.357629% |
| C | 5873 | 4 | 0.068108% |
| D | 5873 | 387 | 6.589477% |
Noise dominated data is calculated using 1-second bins in cleaned event files. If a bin has >2000 counts, and if more than 50% of those come from <1% of pixels, then it is considered to be noise-dominated and hence unusable.
| Quadrant | # 1 sec bins | Bins with >0 counts | Bins with >2000 counts | High rate bins dominated by noise | Noise dominated (total time) | Noise dominated (detector-on time) | Marked lightcurve |
|---|---|---|---|---|---|---|---|
| A | 7155 | 5873 | 1180 | 1180 | 16.49% | 20.09% | 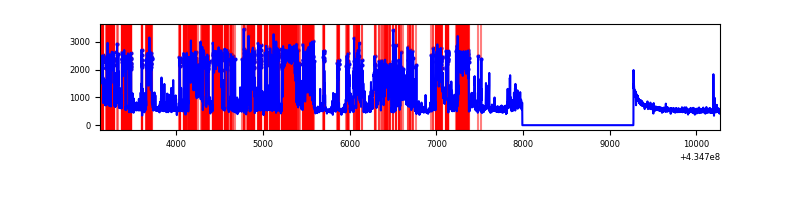 |
| B | 7155 | 5873 | 10 | 10 | 0.14% | 0.17% | 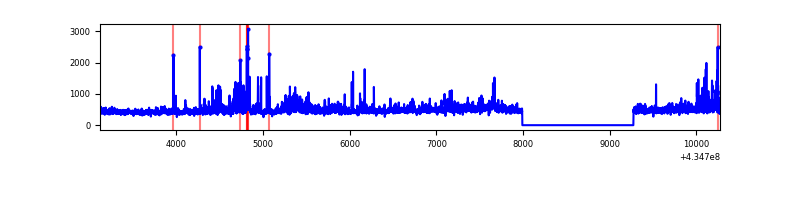 |
| C | 7156 | 5874 | 1 | 1 | 0.01% | 0.02% |  |
| D | 7156 | 5874 | 368 | 368 | 5.14% | 6.26% | 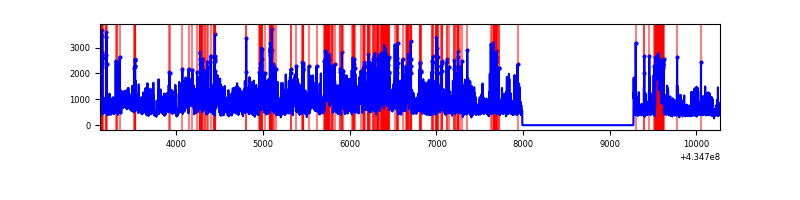 |
Top three noisy pixels from each quadrant. If the there are fewer than three noisy pixels in the level2.evt file, extra rows are filled as -1
| Pixel properties | Quadrant properties | ||||||
|---|---|---|---|---|---|---|---|
| Quadrant | DetID | PixID | Counts | Sigma | Mean | Median | Sigma |
| A | 15 | 222 | 3149611 | 26344.22 | 585 | 573 | 119.5 |
| A | 15 | 237 | 615685 | 5145.9 | 585 | 573 | 119.5 |
| A | 10 | 83 | 579783 | 4845.55 | 585 | 573 | 119.5 |
| B | 0 | 199 | 177951 | 1461.25 | 626 | 607 | 121.4 |
| B | 0 | 189 | 117582 | 963.83 | 626 | 607 | 121.4 |
| B | 0 | 190 | 74136 | 605.85 | 626 | 607 | 121.4 |
| C | 15 | 214 | 263449 | 1817.87 | 611 | 614 | 144.6 |
| C | 3 | 233 | 170006 | 1171.58 | 611 | 614 | 144.6 |
| C | 13 | 61 | 4115 | 24.21 | 611 | 614 | 144.6 |
| D | 1 | 52 | 1671856 | 11464.88 | 596 | 579 | 145.8 |
| D | 2 | 16 | 607152 | 4161.06 | 596 | 579 | 145.8 |
| D | 13 | 249 | 334934 | 2293.66 | 596 | 579 | 145.8 |
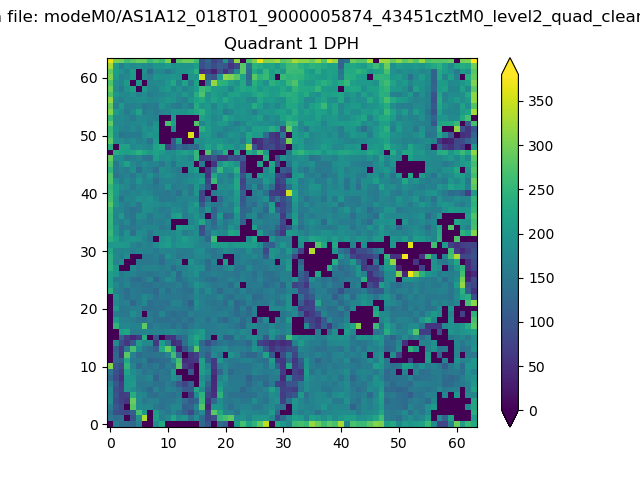
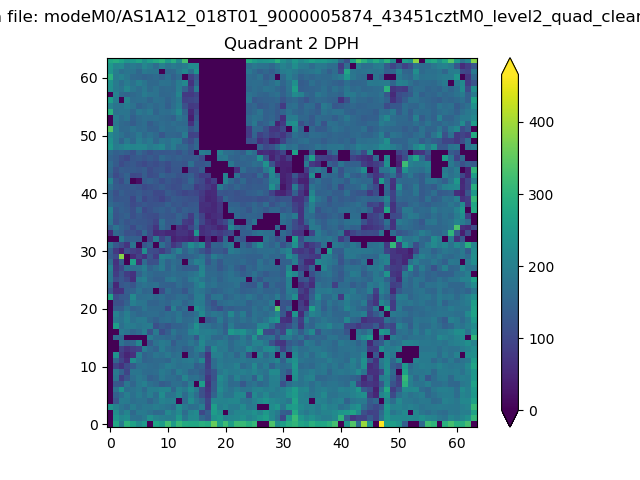
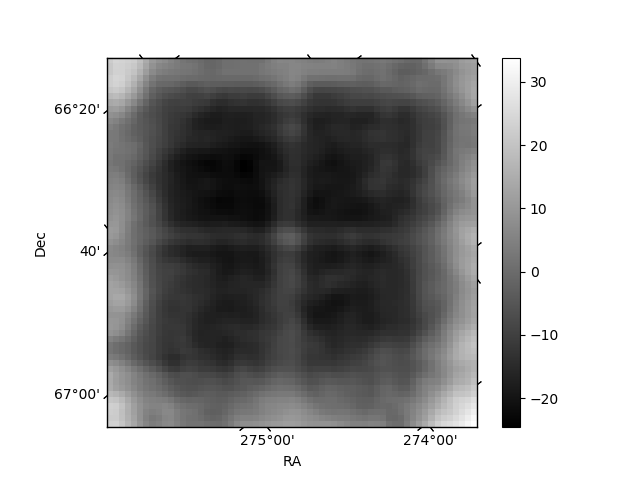
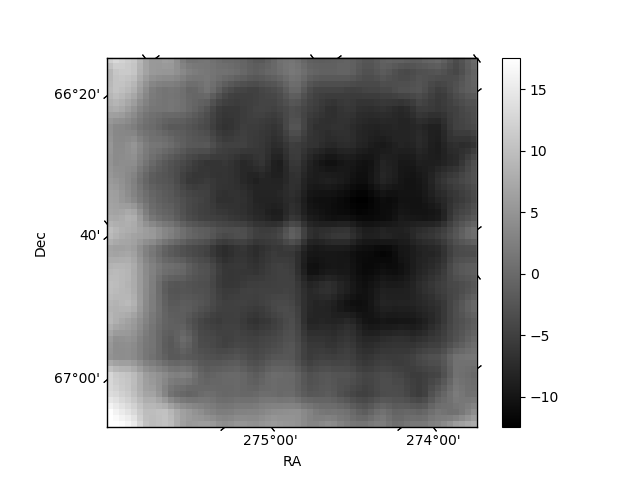
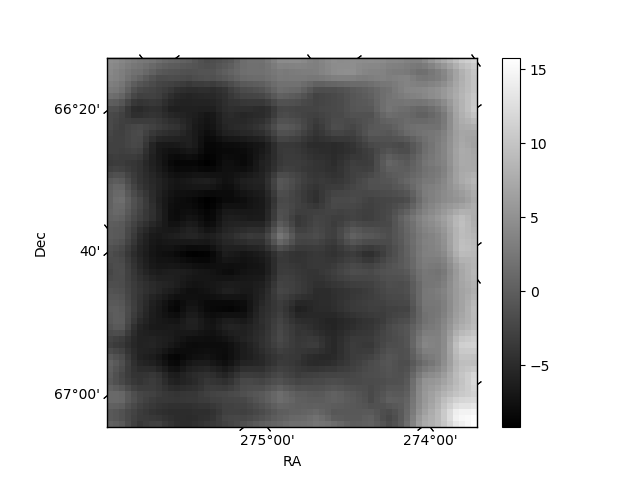
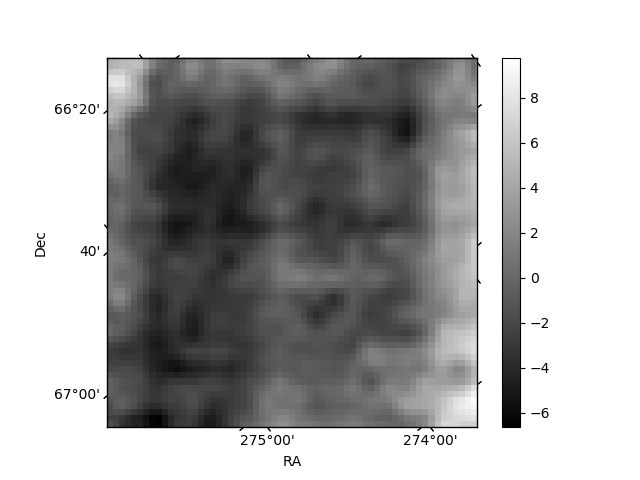
Histogram calculated using DETX and DETY for each event in the final _common_clean file
| Quadrant A | 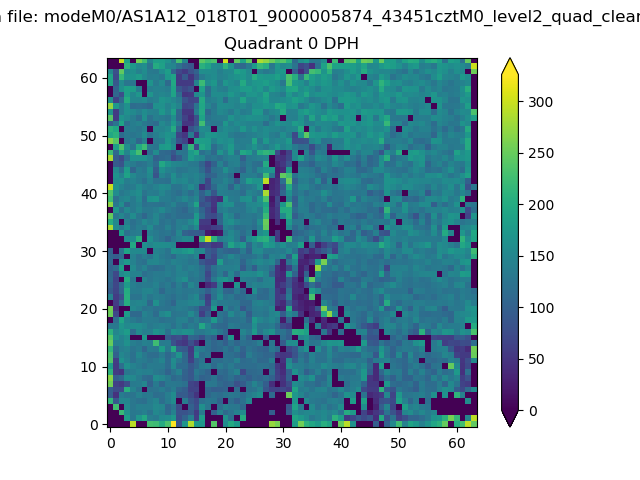 |
 |
Quadrant B |
|---|---|---|---|
| Quadrant D | 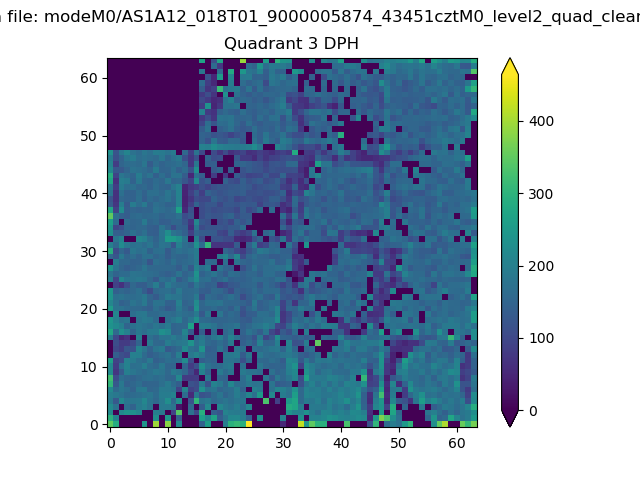 |
 |
Quadrant C |
| Plot type | Count rate plots | Images |
|---|---|---|
| Comparison with Poisson distribution Blue bars denote a histogram of data divided into 1 sec bins. Red curve is a Poisson curve with rate = median count rate of data. |
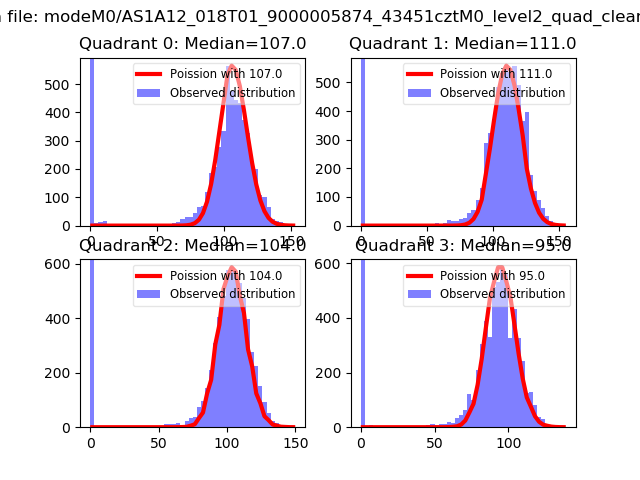 |
 |
| Quadrant-wise count rates Data is divided into 100 sec bins |
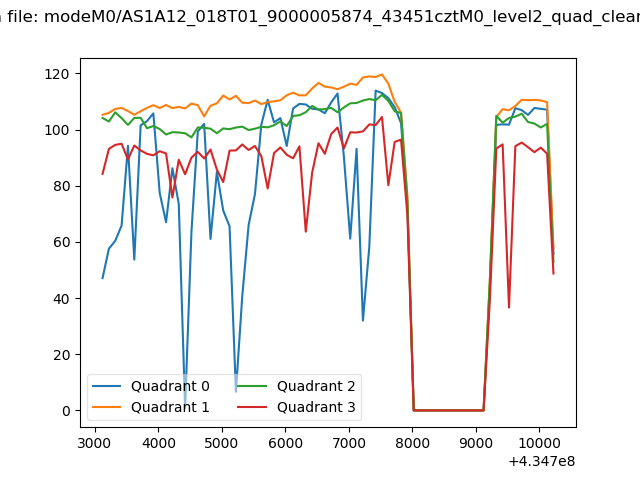 |
|
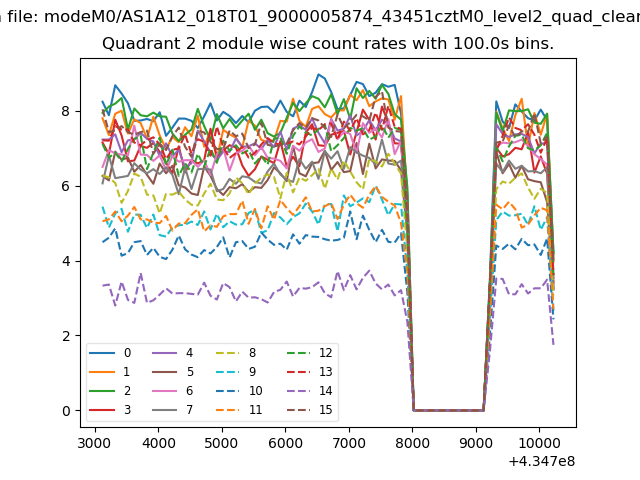
| Module-wise count rates for Quadrant A Data is divided into 100 sec bins |
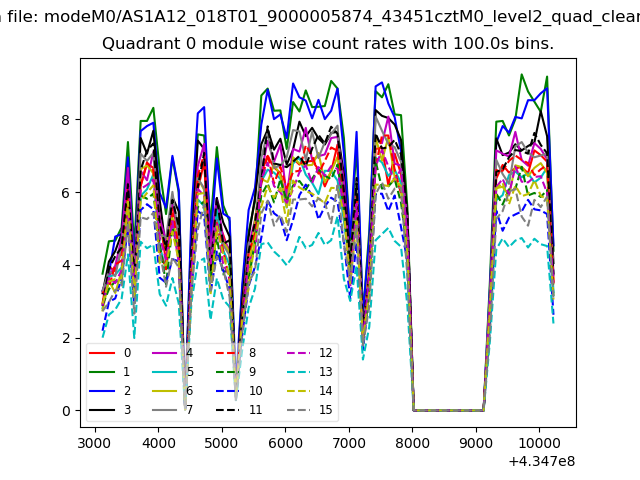 |
 |
| Module-wise count rates for Quadrant B Data is divided into 100 sec bins |
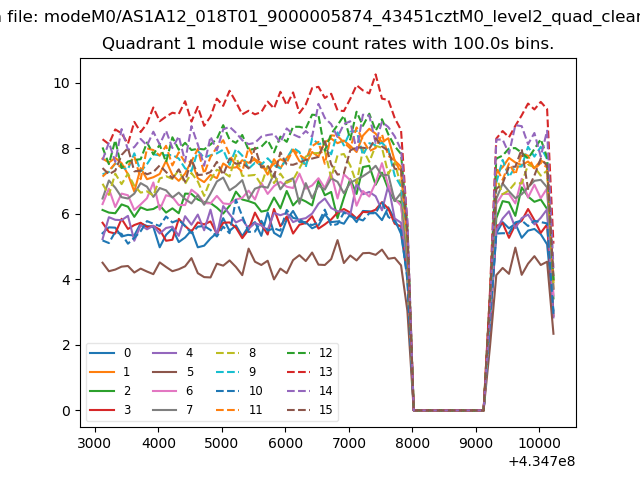 |
 |
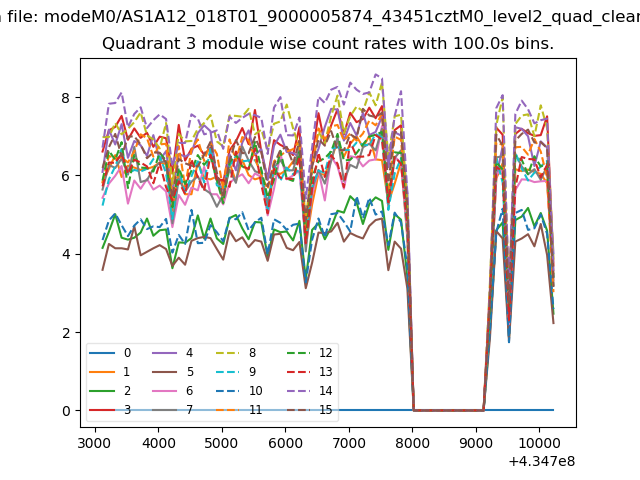
| Module-wise count rates for Quadrant C Data is divided into 100 sec bins |
 |
 |
| Module-wise count rates for Quadrant D Data is divided into 100 sec bins |
 |
 |
| Parameter | Plot |
|---|---|
| CZT HV Monitor | 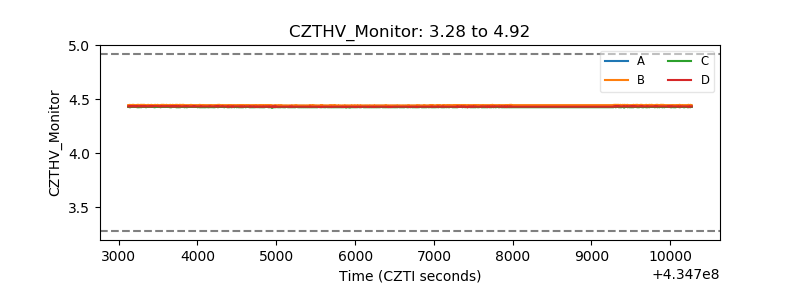 |
| D_VDD | 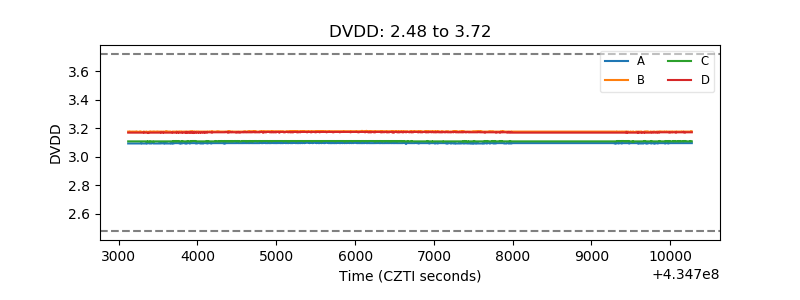 |
| Temperature 1 | 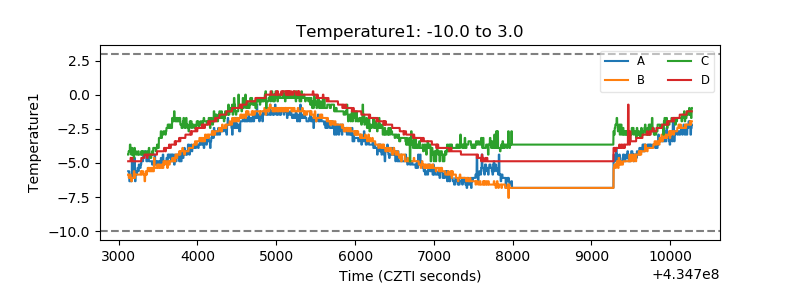 |
| Veto HV Monitor | 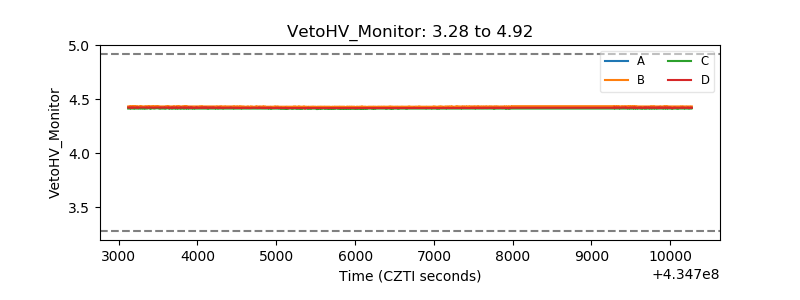 |
| Veto LLD | 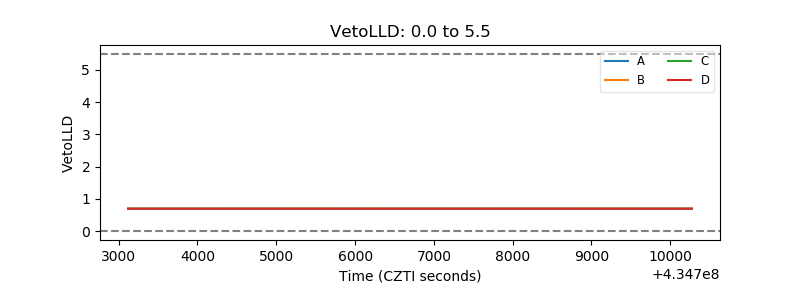 |
| Alpha Counter | 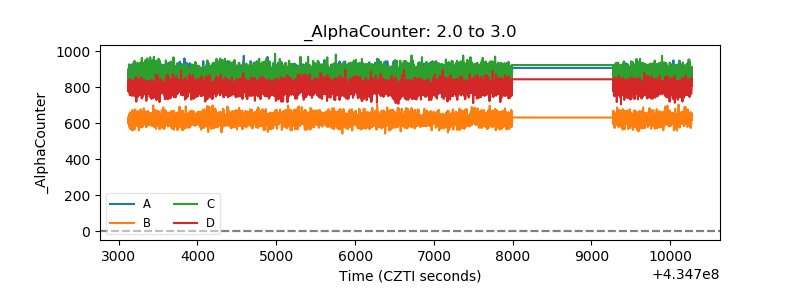 |
| _CPM_Rate | 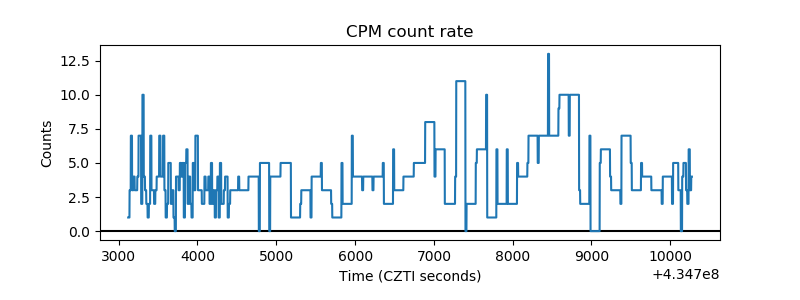 |
| CZT Counter | 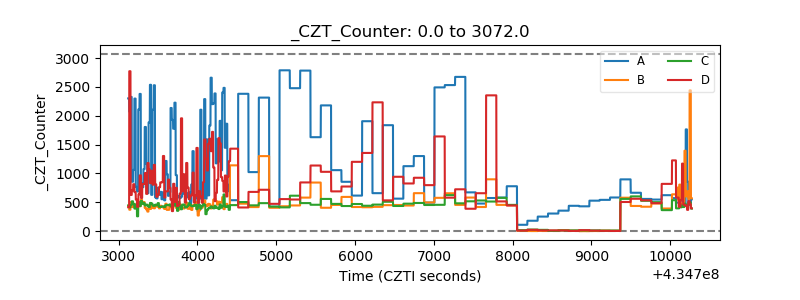 |
| +2.5 Volts monitor | 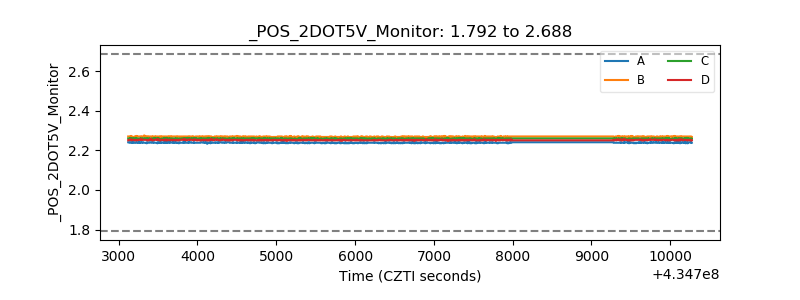 |
| +5 Volts monitor | 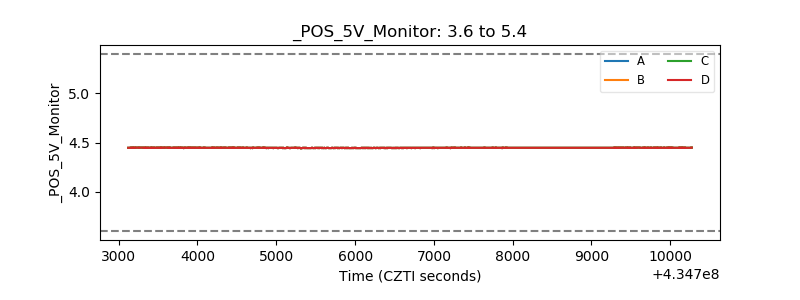 |
| _ROLL_ROT | 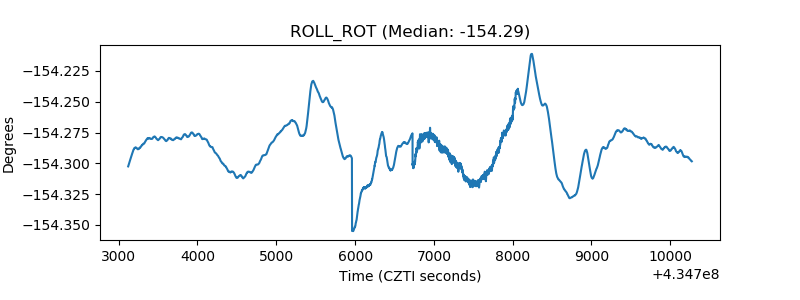 |
| _Roll_DEC | 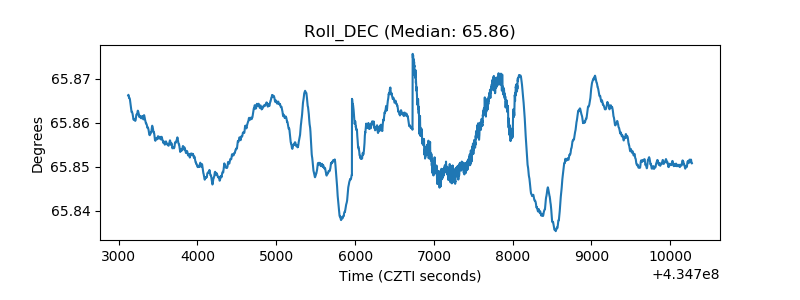 |
| _Roll_RA | 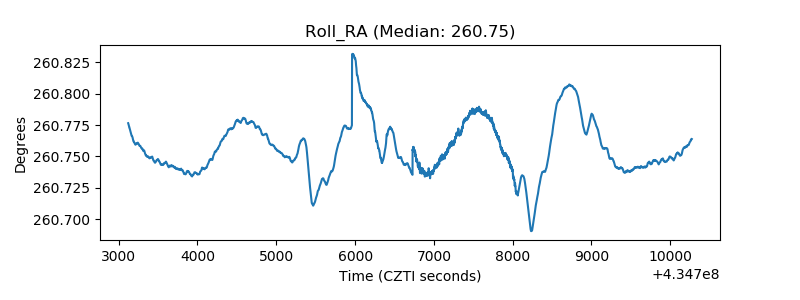 |
| Veto Counter | 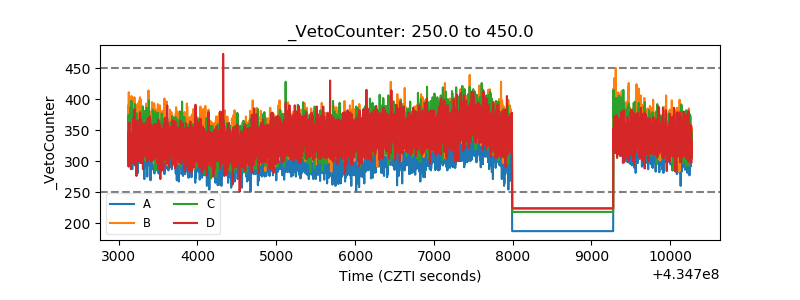 |