| Param | Original file | Final file |
|---|---|---|
| Filename | modeM0/AS1A12_018T01_9000005874_43453cztM0_level2.fits | modeM0/AS1A12_018T01_9000005874_43453cztM0_level2_quad_clean.evt |
| Size (bytes) | 895,109,760 | 159,531,840 |
| Size | 853.6 MB | 152.1 MB |
| Events in quadrant A | 11,656,487 | 912,788 |
| Events in quadrant B | 6,901,123 | 1,143,323 |
| Events in quadrant C | 5,084,494 | 1,089,581 |
| Events in quadrant D | 8,673,712 | 952,798 |
| Mode M0 | |||
|---|---|---|---|
| Quadrant | BADHDUFLAG | Total packets | Discarded packets |
| A | 0 | 41522 | 2 |
| B | 0 | 27507 | 2 |
| C | 0 | 21832 | 5 |
| D | 0 | 33019 | 20 |
| Mode M9 | |||
|---|---|---|---|
| Quadrant | BADHDUFLAG | Total packets | Discarded packets |
| A | 0 | 29 | 0 |
| B | 0 | 29 | 0 |
| C | 0 | 29 | 0 |
| D | 0 | 29 | 0 |
| Mode SS | |||
|---|---|---|---|
| Quadrant | BADHDUFLAG | Total packets | Discarded packets |
| A | 0 | 212 | 0 |
| B | 0 | 212 | 0 |
| C | 0 | 212 | 0 |
| D | 0 | 212 | 0 |
| Quadrant | Total seconds | Saturated seconds | Saturation percentage |
|---|---|---|---|
| A | 10572 | 2268 | 21.452894% |
| B | 10573 | 278 | 2.629339% |
| C | 10571 | 28 | 0.264876% |
| D | 10568 | 651 | 6.160106% |
Noise dominated data is calculated using 1-second bins in cleaned event files. If a bin has >2000 counts, and if more than 50% of those come from <1% of pixels, then it is considered to be noise-dominated and hence unusable.
| Quadrant | # 1 sec bins | Bins with >0 counts | Bins with >2000 counts | High rate bins dominated by noise | Noise dominated (total time) | Noise dominated (detector-on time) | Marked lightcurve |
|---|---|---|---|---|---|---|---|
| A | 13379 | 10573 | 2171 | 2171 | 16.23% | 20.53% | 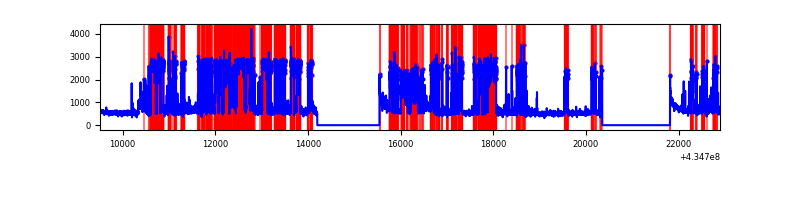 |
| B | 13380 | 10575 | 241 | 241 | 1.80% | 2.28% | 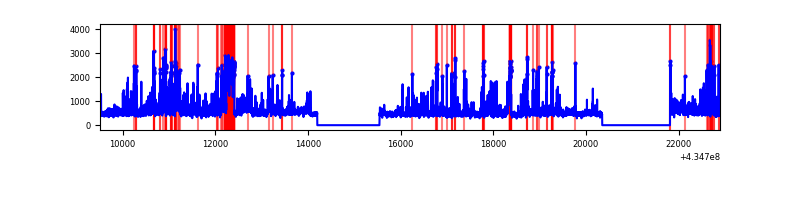 |
| C | 13380 | 10574 | 22 | 22 | 0.16% | 0.21% | 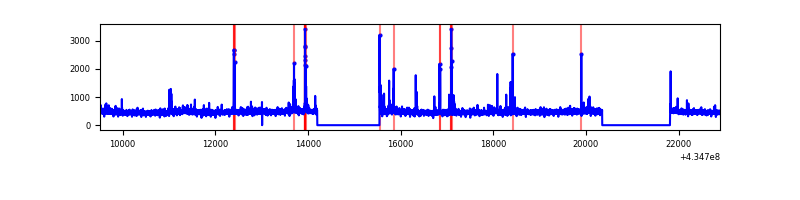 |
| D | 13379 | 10572 | 648 | 648 | 4.84% | 6.13% | 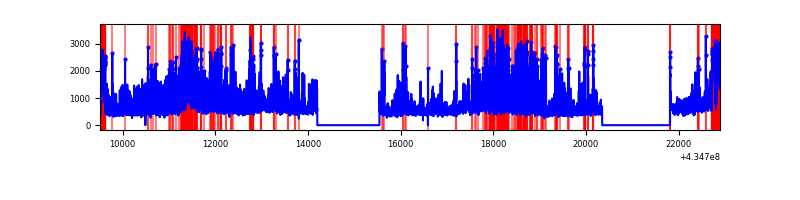 |
Top three noisy pixels from each quadrant. If the there are fewer than three noisy pixels in the level2.evt file, extra rows are filled as -1
| Pixel properties | Quadrant properties | ||||||
|---|---|---|---|---|---|---|---|
| Quadrant | DetID | PixID | Counts | Sigma | Mean | Median | Sigma |
| A | 15 | 222 | 6176329 | 30131.83 | 1008 | 986 | 204.9 |
| A | 10 | 83 | 1007395 | 4910.65 | 1008 | 986 | 204.9 |
| A | 15 | 237 | 515410 | 2510.07 | 1008 | 986 | 204.9 |
| B | 0 | 189 | 675873 | 3164.77 | 1124 | 1096 | 213.2 |
| B | 0 | 229 | 534470 | 2501.57 | 1124 | 1096 | 213.2 |
| B | 0 | 245 | 376437 | 1760.38 | 1124 | 1096 | 213.2 |
| C | 15 | 214 | 461984 | 1796.88 | 1103 | 1108 | 256.5 |
| C | 3 | 233 | 165498 | 640.93 | 1103 | 1108 | 256.5 |
| C | 14 | 254 | 94505 | 364.14 | 1103 | 1108 | 256.5 |
| D | 1 | 52 | 2587437 | 9759.43 | 1080 | 1047 | 265.0 |
| D | 12 | 233 | 746551 | 2813.07 | 1080 | 1047 | 265.0 |
| D | 2 | 16 | 491686 | 1851.37 | 1080 | 1047 | 265.0 |
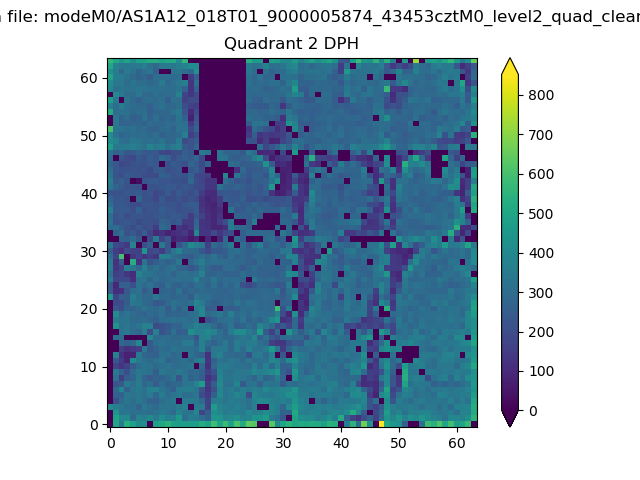
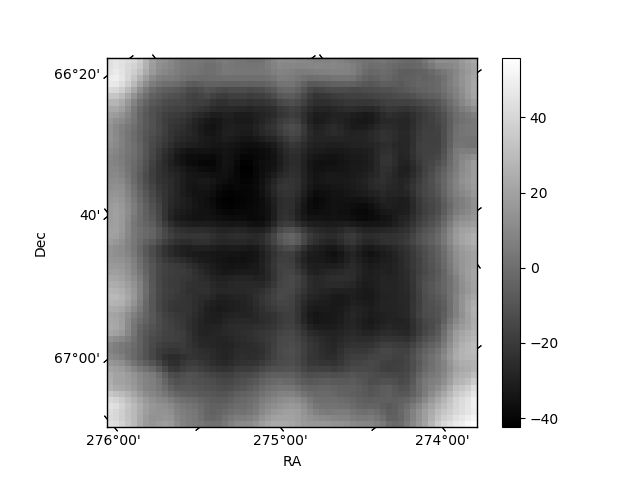
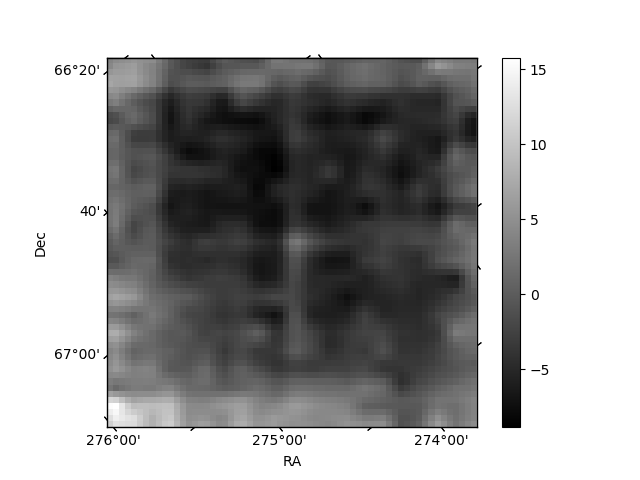
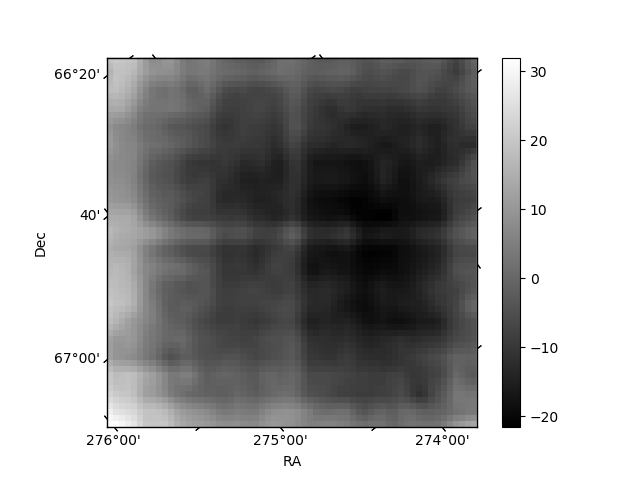
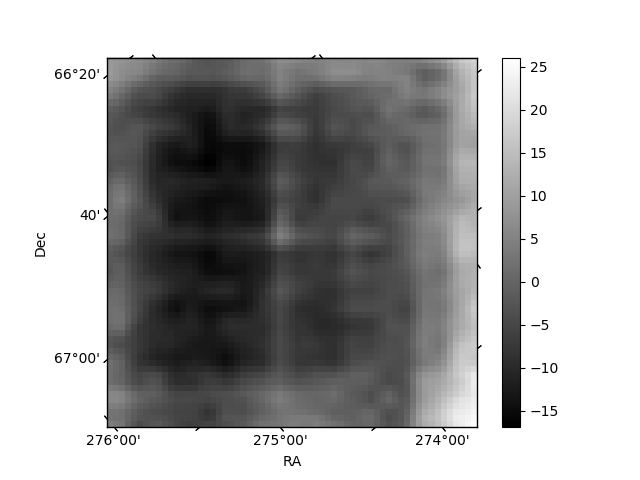
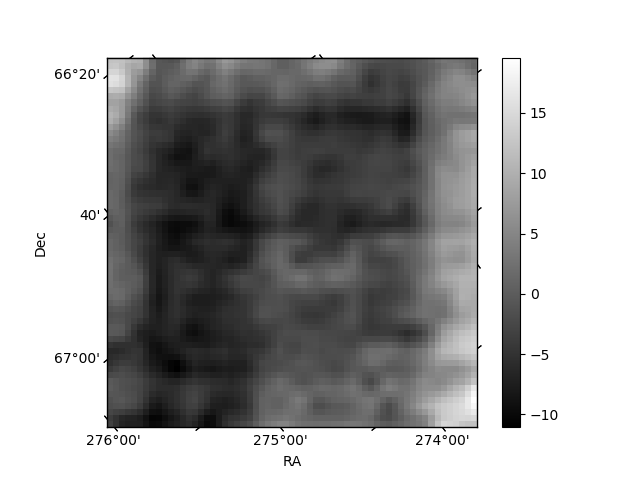
Histogram calculated using DETX and DETY for each event in the final _common_clean file
| Quadrant A | 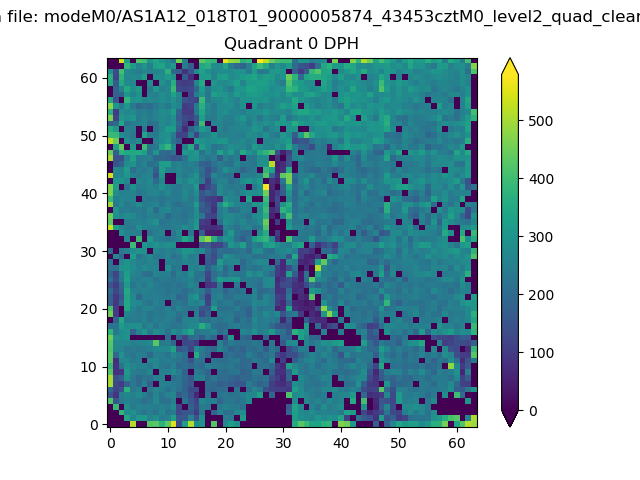 |
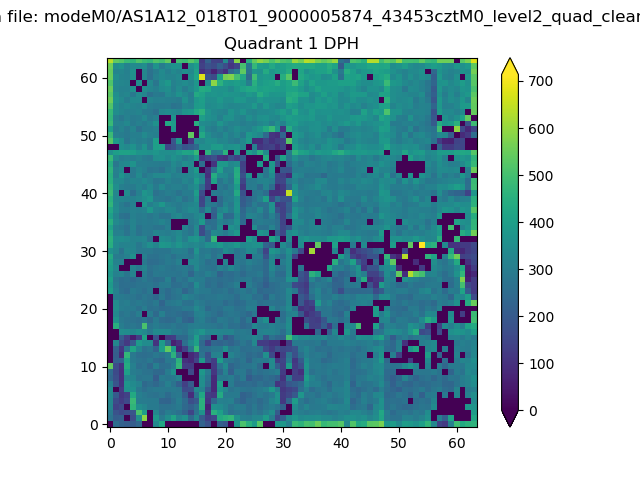 |
Quadrant B |
|---|---|---|---|
| Quadrant D | 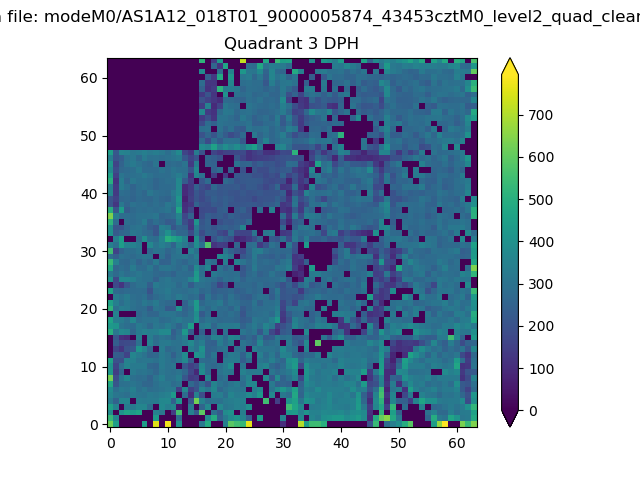 |
 |
Quadrant C |
| Plot type | Count rate plots | Images |
|---|---|---|
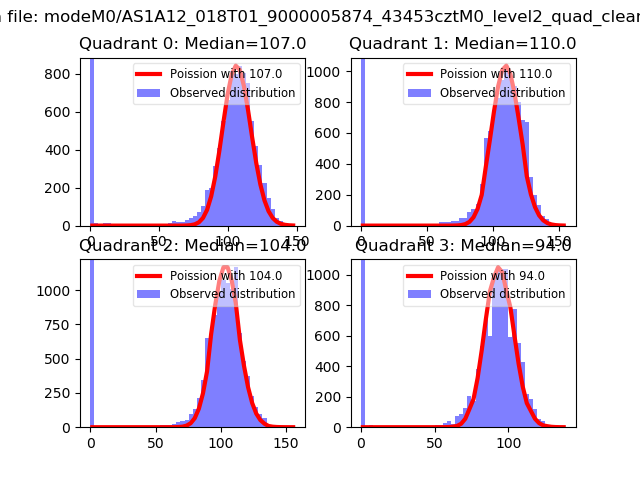
| Comparison with Poisson distribution Blue bars denote a histogram of data divided into 1 sec bins. Red curve is a Poisson curve with rate = median count rate of data. |
 |
 |
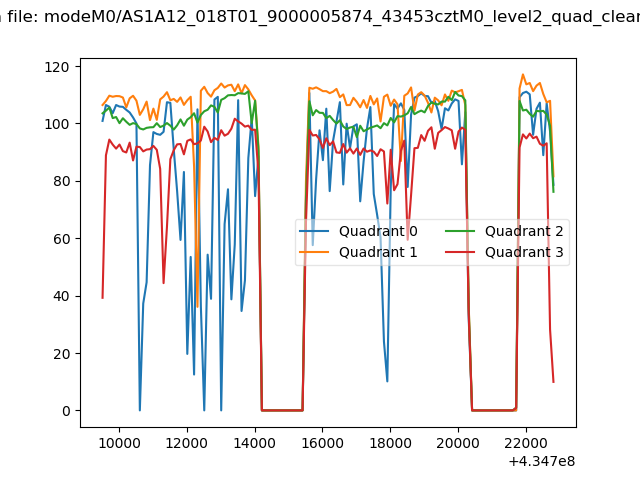
| Quadrant-wise count rates Data is divided into 100 sec bins |
 |
|
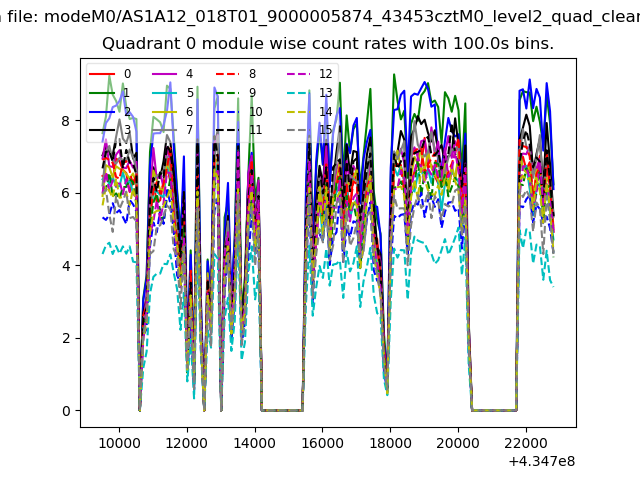
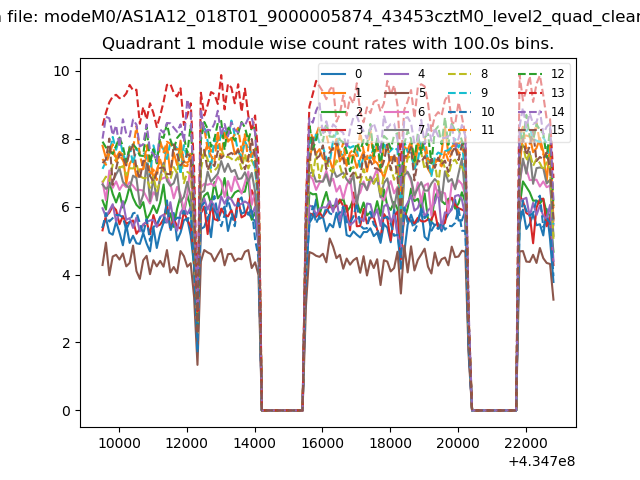
| Module-wise count rates for Quadrant A Data is divided into 100 sec bins |
 |
 |
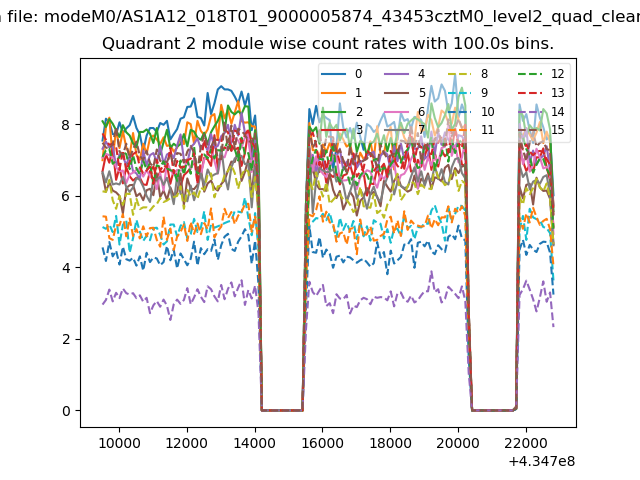
| Module-wise count rates for Quadrant B Data is divided into 100 sec bins |
 |
 |
| Module-wise count rates for Quadrant C Data is divided into 100 sec bins |
 |
 |
| Module-wise count rates for Quadrant D Data is divided into 100 sec bins |
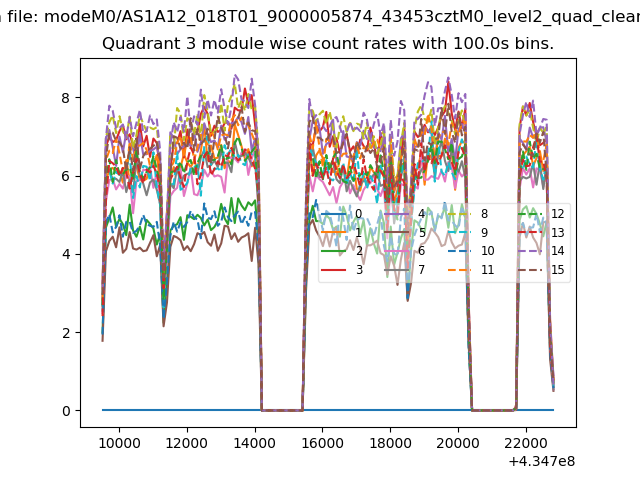 |
 |
| Parameter | Plot |
|---|---|
| CZT HV Monitor | 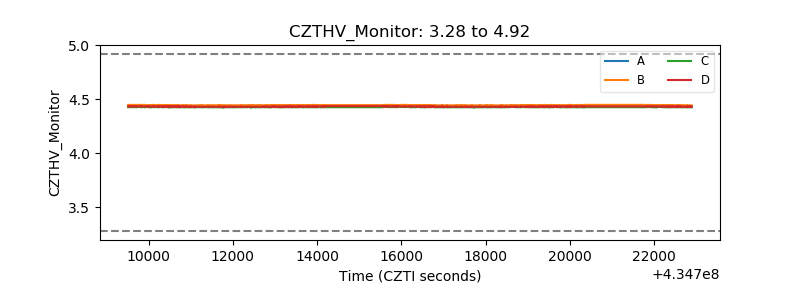 |
| D_VDD | 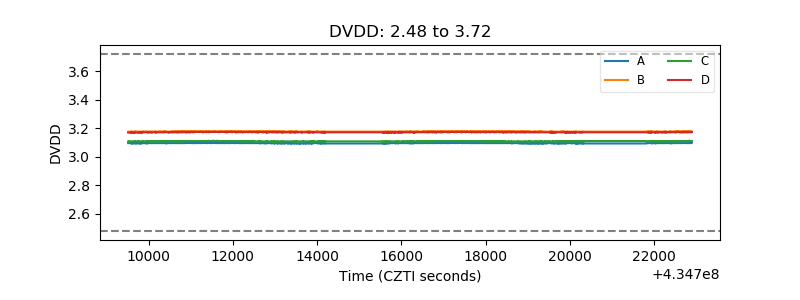 |
| Temperature 1 | 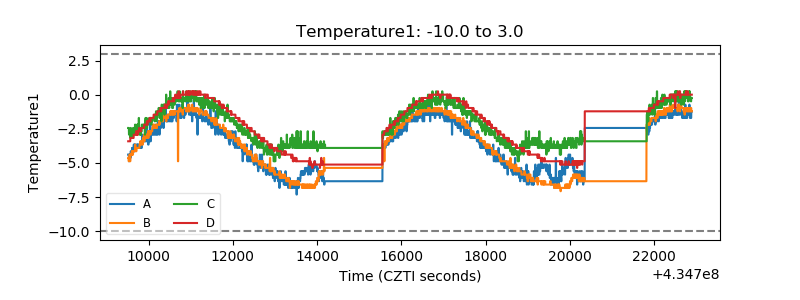 |
| Veto HV Monitor | 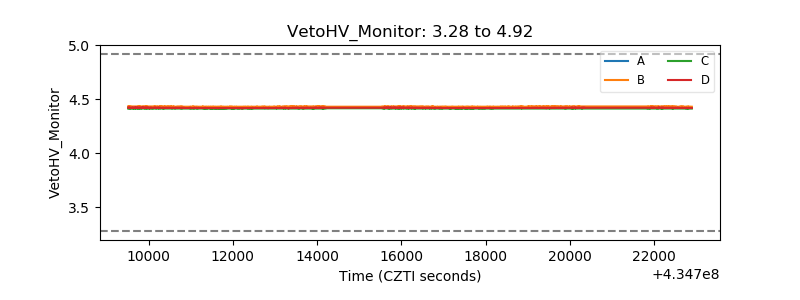 |
| Veto LLD |  |
| Alpha Counter | 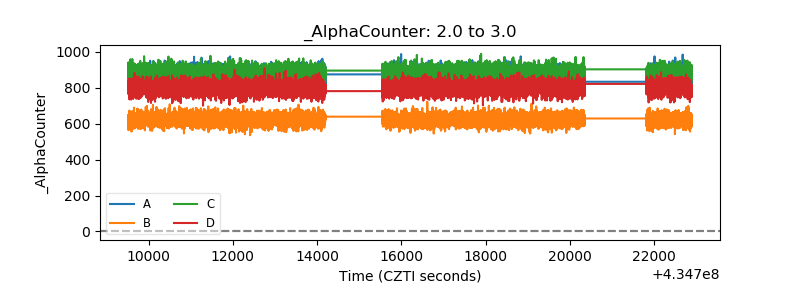 |
| _CPM_Rate | 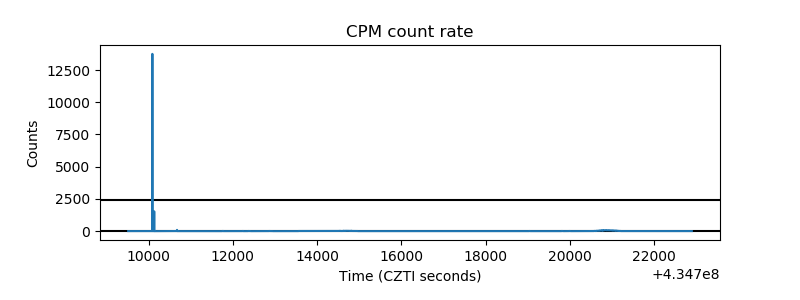 |
| CZT Counter | 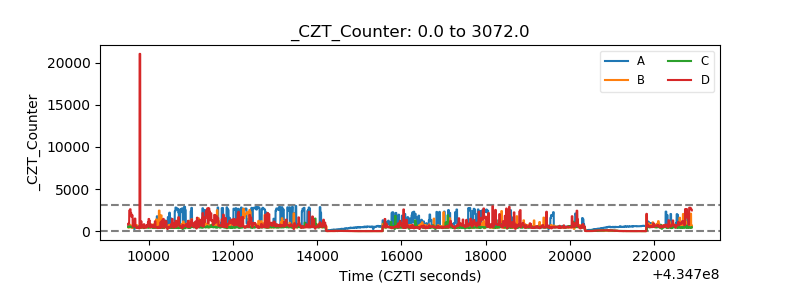 |
| +2.5 Volts monitor | 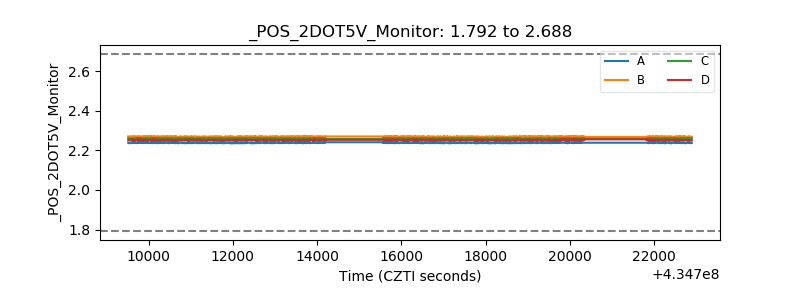 |
| +5 Volts monitor |  |
| _ROLL_ROT | 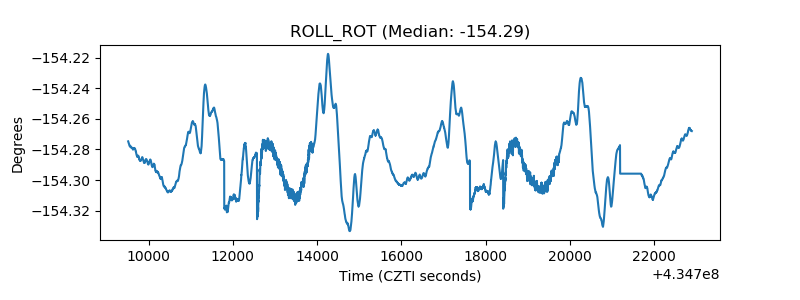 |
| _Roll_DEC | 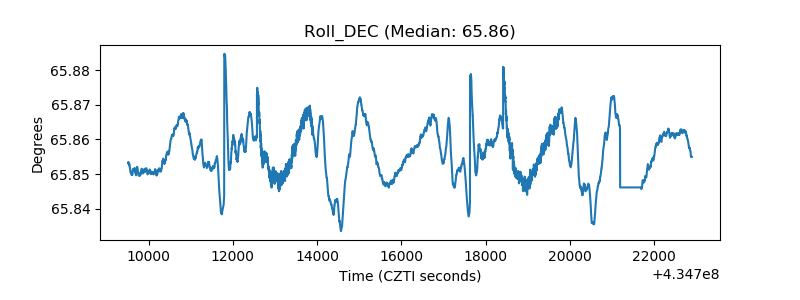 |
| _Roll_RA | 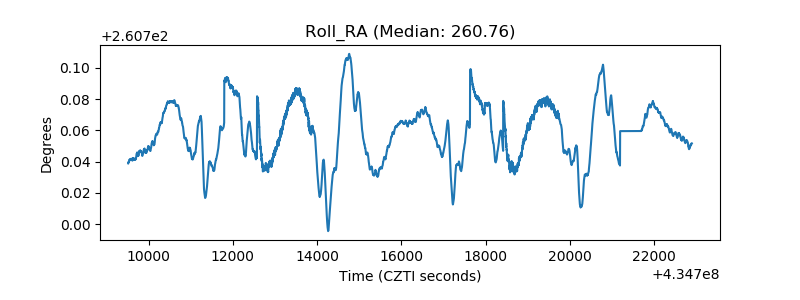 |
| Veto Counter | 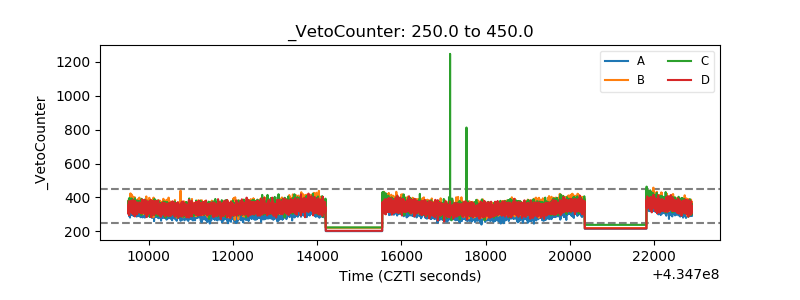 |