| Param | Original file | Final file |
|---|---|---|
| Filename | modeM0/AS1A12_018T01_9000005874_43454cztM0_level2.fits | modeM0/AS1A12_018T01_9000005874_43454cztM0_level2_quad_clean.evt |
| Size (bytes) | 470,289,600 | 89,864,640 |
| Size | 448.5 MB | 85.7 MB |
| Events in quadrant A | 5,370,795 | 573,036 |
| Events in quadrant B | 3,465,292 | 638,285 |
| Events in quadrant C | 2,725,844 | 603,747 |
| Events in quadrant D | 5,393,831 | 498,889 |
| Mode M0 | |||
|---|---|---|---|
| Quadrant | BADHDUFLAG | Total packets | Discarded packets |
| A | 0 | 19829 | 2 |
| B | 0 | 14147 | 2 |
| C | 0 | 11825 | 2 |
| D | 0 | 20048 | 2 |
| Mode M9 | |||
|---|---|---|---|
| Quadrant | BADHDUFLAG | Total packets | Discarded packets |
| A | 0 | 17 | 0 |
| B | 0 | 18 | 0 |
| C | 0 | 18 | 0 |
| D | 0 | 18 | 0 |
| Mode SS | |||
|---|---|---|---|
| Quadrant | BADHDUFLAG | Total packets | Discarded packets |
| A | 0 | 116 | 0 |
| B | 0 | 116 | 0 |
| C | 0 | 116 | 0 |
| D | 0 | 116 | 0 |
| Quadrant | Total seconds | Saturated seconds | Saturation percentage |
|---|---|---|---|
| A | 5828 | 705 | 12.096774% |
| B | 5828 | 113 | 1.938916% |
| C | 5828 | 6 | 0.102951% |
| D | 5827 | 698 | 11.978720% |
Noise dominated data is calculated using 1-second bins in cleaned event files. If a bin has >2000 counts, and if more than 50% of those come from <1% of pixels, then it is considered to be noise-dominated and hence unusable.
| Quadrant | # 1 sec bins | Bins with >0 counts | Bins with >2000 counts | High rate bins dominated by noise | Noise dominated (total time) | Noise dominated (detector-on time) | Marked lightcurve |
|---|---|---|---|---|---|---|---|
| A | 7382 | 5829 | 639 | 639 | 8.66% | 10.96% | 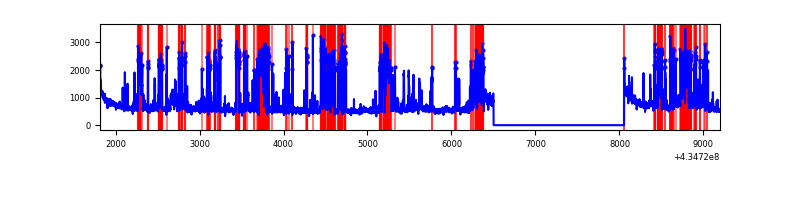 |
| B | 7382 | 5829 | 80 | 80 | 1.08% | 1.37% | 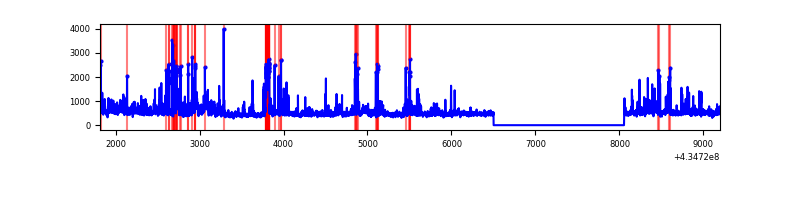 |
| C | 7382 | 5829 | 4 | 4 | 0.05% | 0.07% | 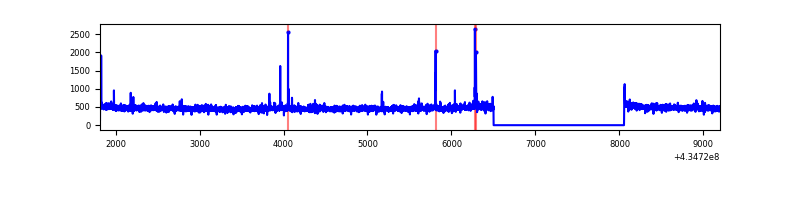 |
| D | 7381 | 5828 | 684 | 684 | 9.27% | 11.74% | 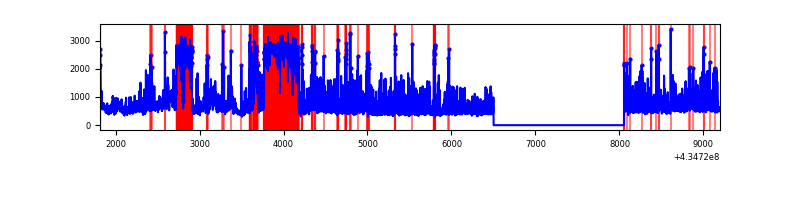 |
Top three noisy pixels from each quadrant. If the there are fewer than three noisy pixels in the level2.evt file, extra rows are filled as -1
| Pixel properties | Quadrant properties | ||||||
|---|---|---|---|---|---|---|---|
| Quadrant | DetID | PixID | Counts | Sigma | Mean | Median | Sigma |
| A | 15 | 222 | 1692634 | 13752.14 | 599 | 586 | 123.0 |
| A | 10 | 83 | 679753 | 5519.94 | 599 | 586 | 123.0 |
| A | 15 | 237 | 631159 | 5124.99 | 599 | 586 | 123.0 |
| B | 0 | 229 | 424289 | 3527.63 | 620 | 604 | 120.1 |
| B | 0 | 189 | 331442 | 2754.58 | 620 | 604 | 120.1 |
| B | 3 | 112 | 75551 | 624.01 | 620 | 604 | 120.1 |
| C | 15 | 214 | 259451 | 1809.58 | 610 | 613 | 143.0 |
| C | 3 | 233 | 44307 | 305.47 | 610 | 613 | 143.0 |
| C | 14 | 254 | 23321 | 158.76 | 610 | 613 | 143.0 |
| D | 12 | 233 | 1484584 | 10554.99 | 574 | 555 | 140.6 |
| D | 1 | 52 | 699073 | 4968.13 | 574 | 555 | 140.6 |
| D | 2 | 16 | 502454 | 3569.7 | 574 | 555 | 140.6 |
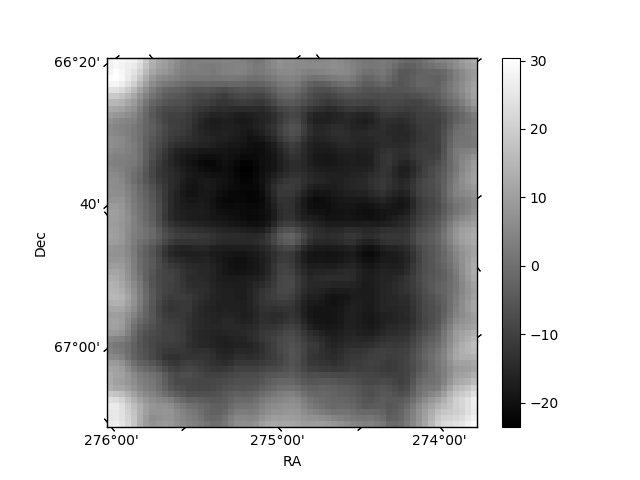
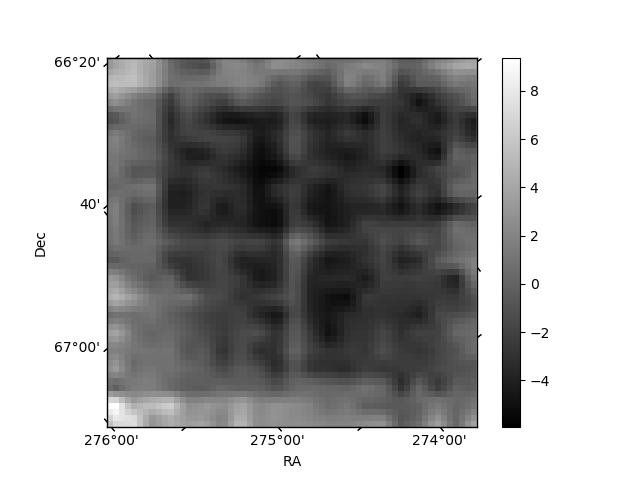
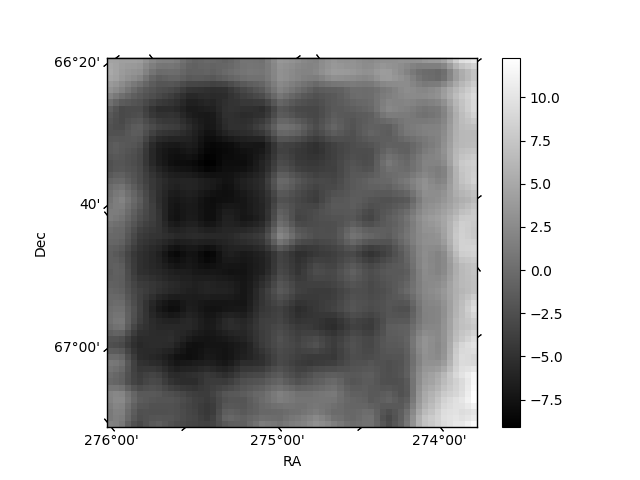
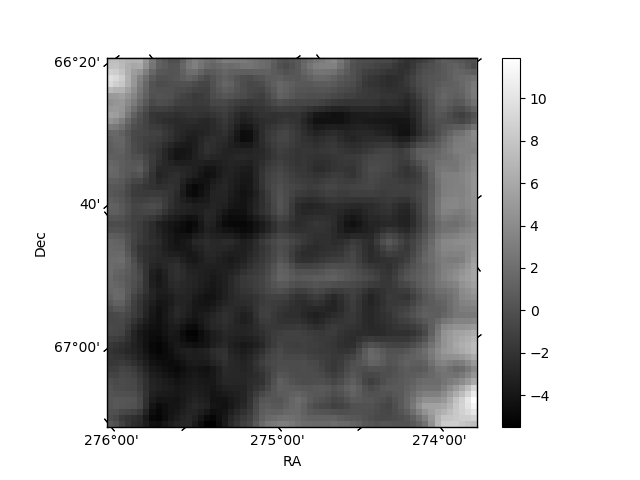
Histogram calculated using DETX and DETY for each event in the final _common_clean file
| Quadrant A | 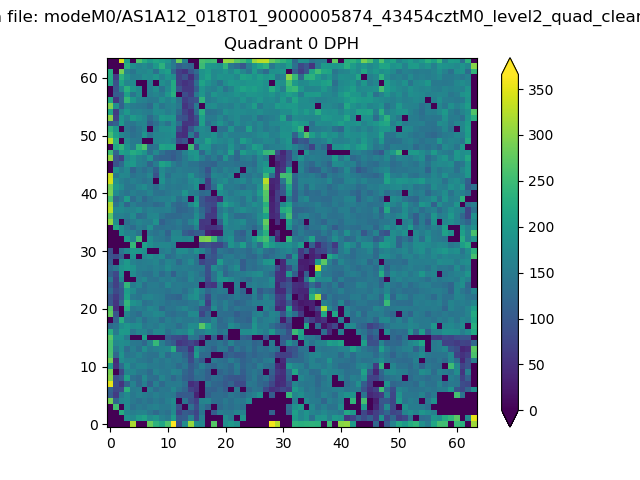 |
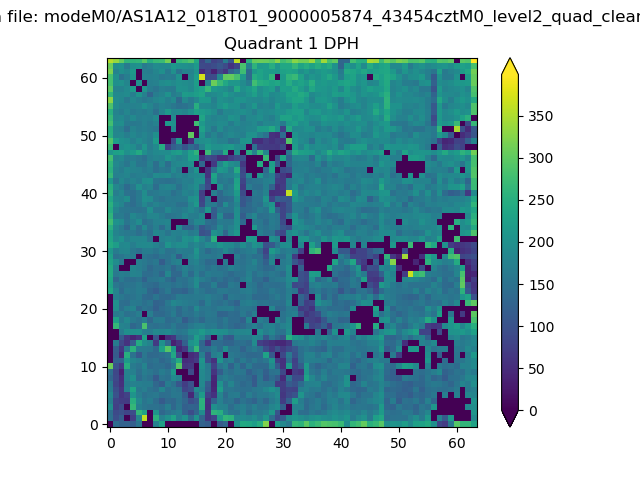 |
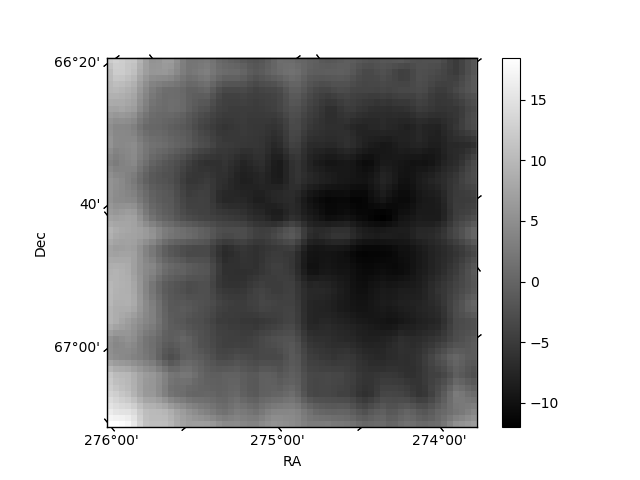
Quadrant B |
|---|---|---|---|
| Quadrant D | 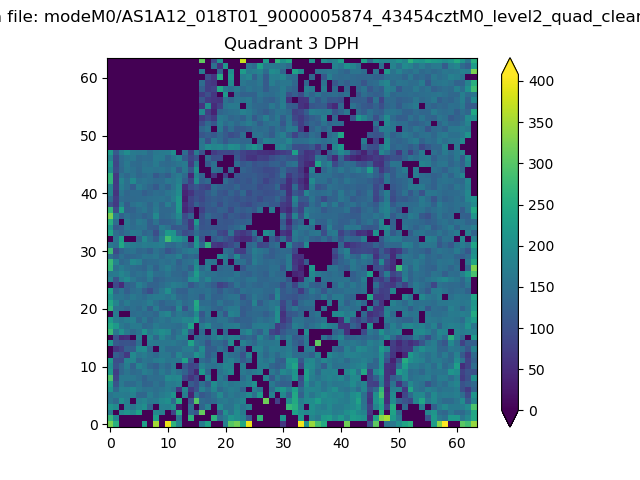 |
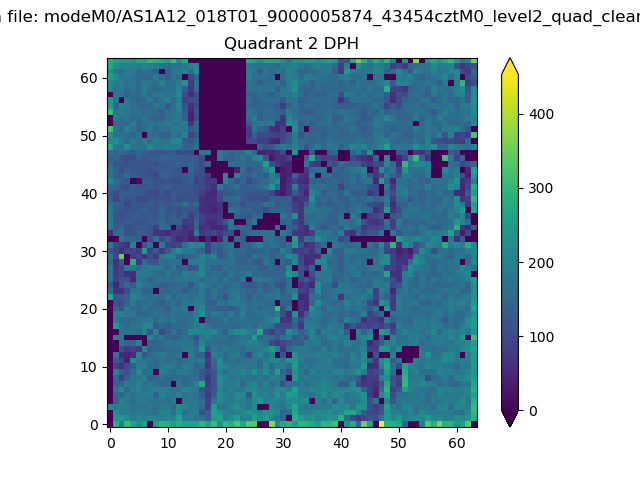 |
Quadrant C |
| Plot type | Count rate plots | Images |
|---|---|---|
| Comparison with Poisson distribution Blue bars denote a histogram of data divided into 1 sec bins. Red curve is a Poisson curve with rate = median count rate of data. |
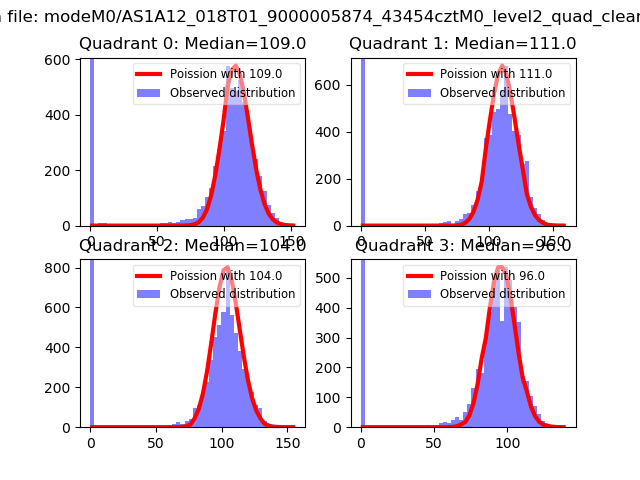 |
 |
| Quadrant-wise count rates Data is divided into 100 sec bins |
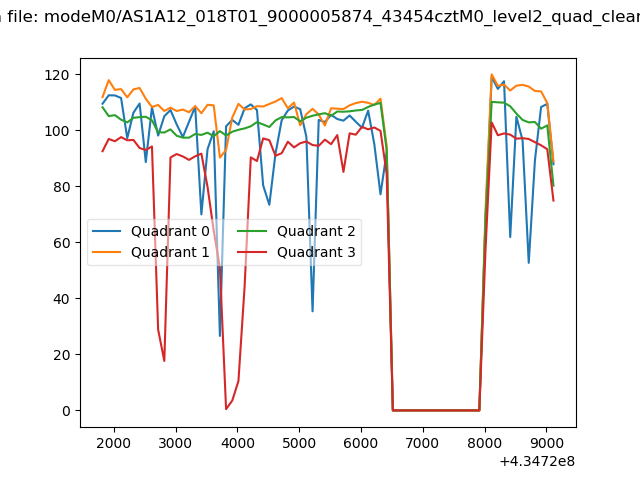 |
|
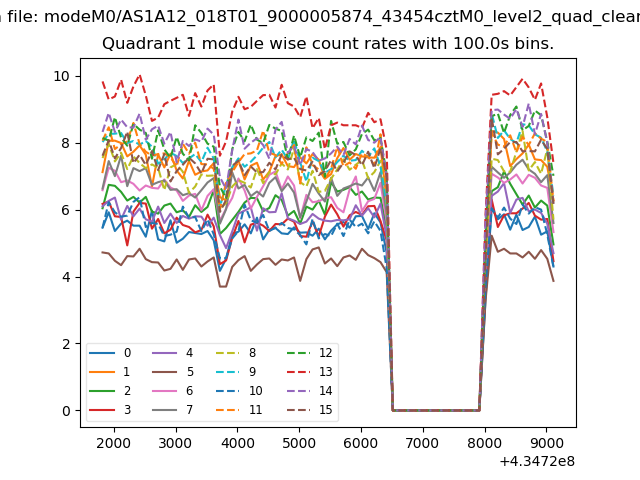
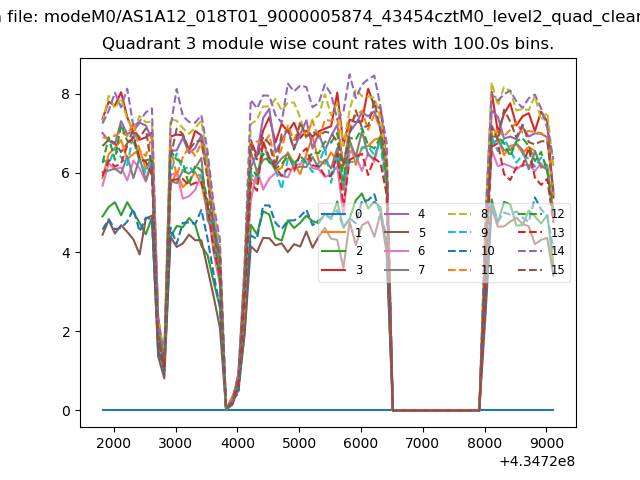
| Module-wise count rates for Quadrant A Data is divided into 100 sec bins |
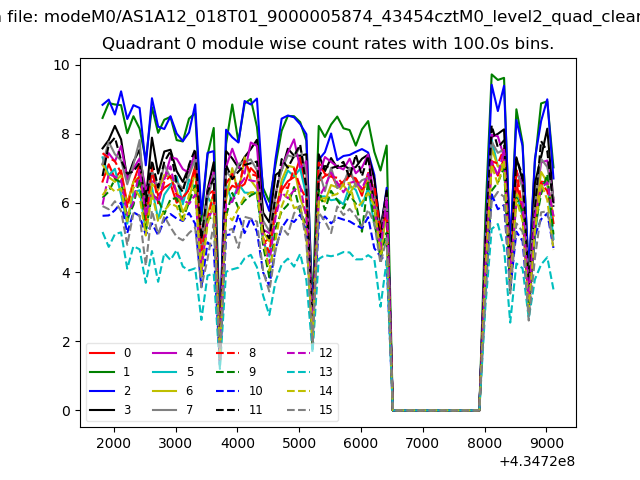 |
 |
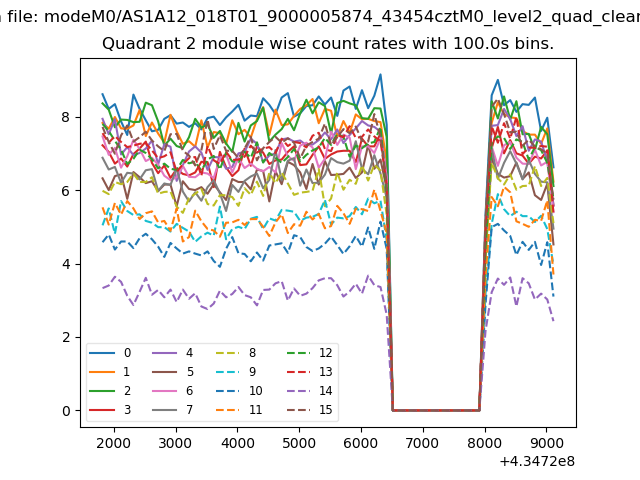
| Module-wise count rates for Quadrant B Data is divided into 100 sec bins |
 |
 |
| Module-wise count rates for Quadrant C Data is divided into 100 sec bins |
 |
 |
| Module-wise count rates for Quadrant D Data is divided into 100 sec bins |
 |
 |
| Parameter | Plot |
|---|---|
| CZT HV Monitor | 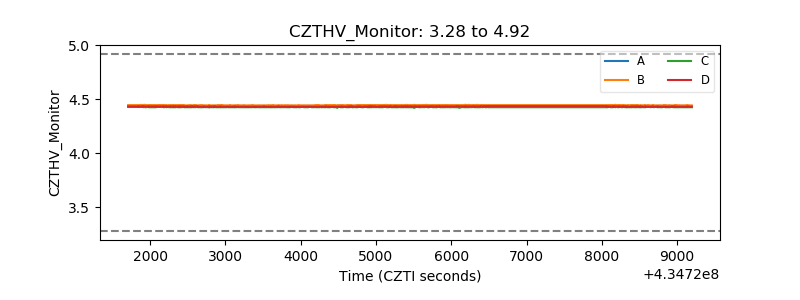 |
| D_VDD | 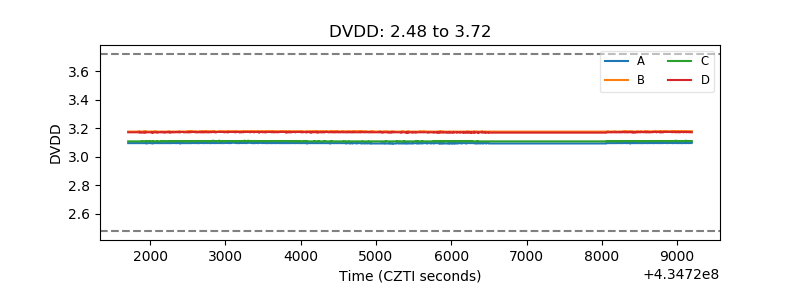 |
| Temperature 1 | 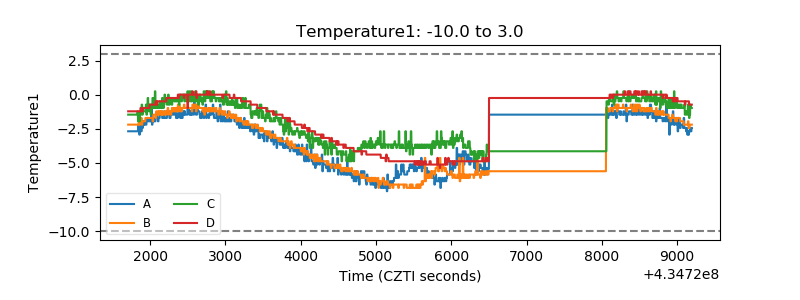 |
| Veto HV Monitor |  |
| Veto LLD | 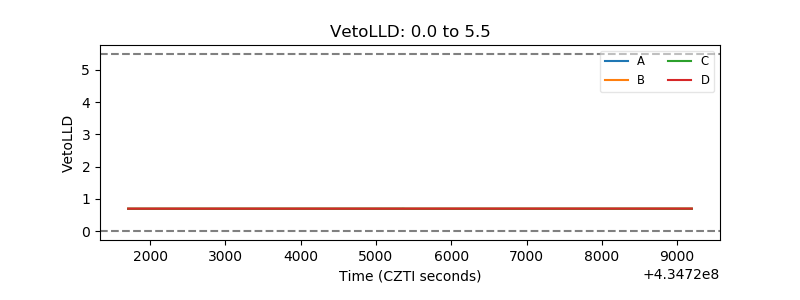 |
| Alpha Counter | 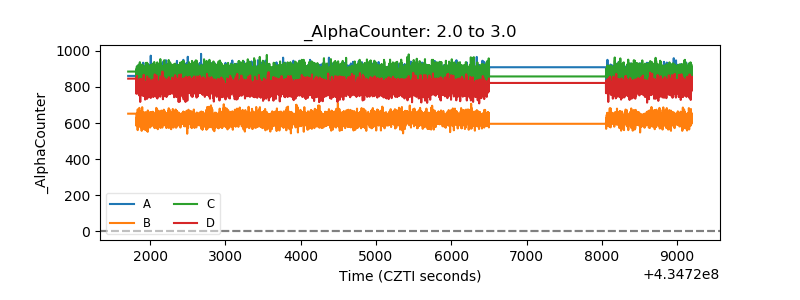 |
| _CPM_Rate | 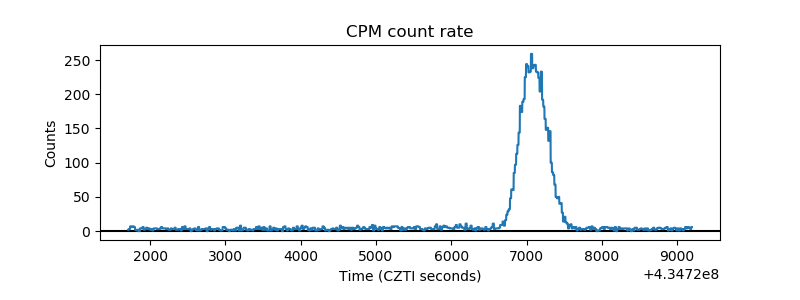 |
| CZT Counter | 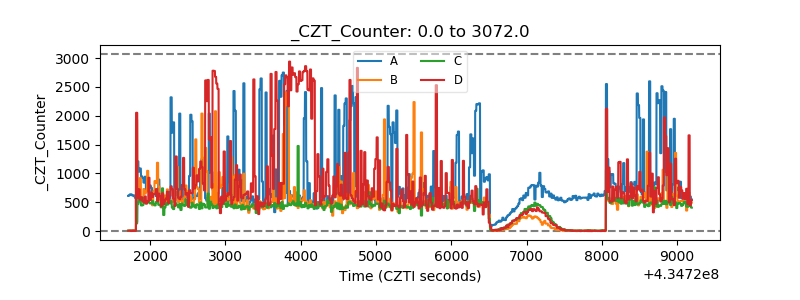 |
| +2.5 Volts monitor | 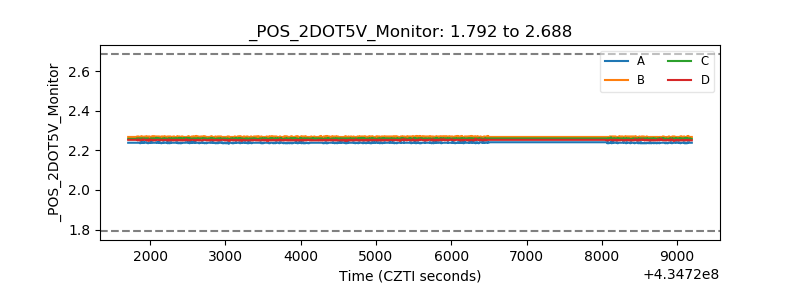 |
| +5 Volts monitor | 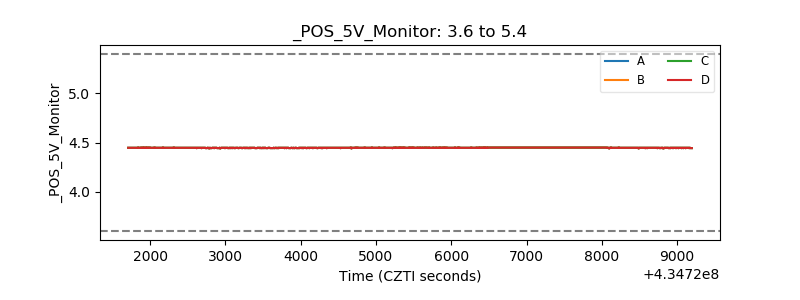 |
| _ROLL_ROT |  |
| _Roll_DEC | 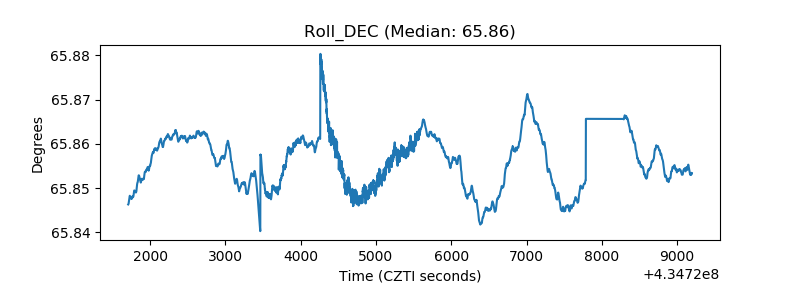 |
| _Roll_RA | 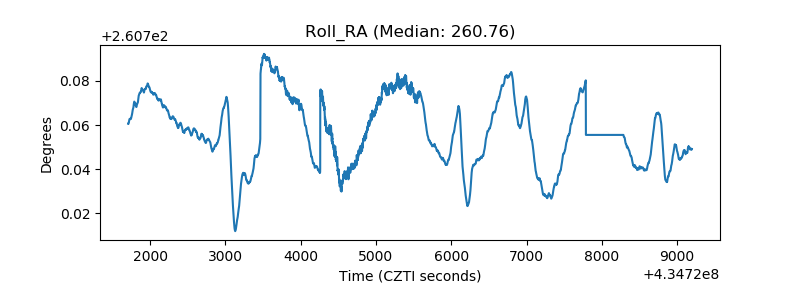 |
| Veto Counter | 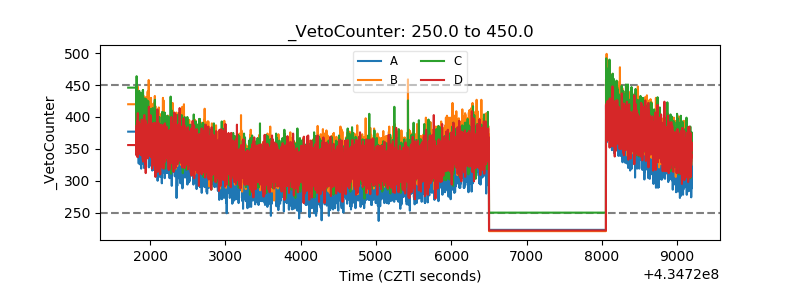 |