| Param | Original file | Final file |
|---|---|---|
| Filename | modeM0/AS1A12_018T01_9000005874_43455cztM0_level2.fits | modeM0/AS1A12_018T01_9000005874_43455cztM0_level2_quad_clean.evt |
| Size (bytes) | 407,854,080 | 86,492,160 |
| Size | 389.0 MB | 82.5 MB |
| Events in quadrant A | 4,684,013 | 549,150 |
| Events in quadrant B | 3,466,110 | 595,989 |
| Events in quadrant C | 2,570,776 | 573,211 |
| Events in quadrant D | 3,954,053 | 520,119 |
| Mode M0 | |||
|---|---|---|---|
| Quadrant | BADHDUFLAG | Total packets | Discarded packets |
| A | 0 | 17680 | 1 |
| B | 0 | 13954 | 1 |
| C | 0 | 11143 | 1 |
| D | 0 | 15487 | 1 |
| Mode M9 | |||
|---|---|---|---|
| Quadrant | BADHDUFLAG | Total packets | Discarded packets |
| A | 0 | 17 | 0 |
| B | 0 | 17 | 0 |
| C | 0 | 17 | 0 |
| D | 0 | 17 | 0 |
| Mode SS | |||
|---|---|---|---|
| Quadrant | BADHDUFLAG | Total packets | Discarded packets |
| A | 0 | 110 | 0 |
| B | 0 | 110 | 0 |
| C | 0 | 110 | 0 |
| D | 0 | 110 | 0 |
| Quadrant | Total seconds | Saturated seconds | Saturation percentage |
|---|---|---|---|
| A | 5432 | 537 | 9.885862% |
| B | 5432 | 146 | 2.687776% |
| C | 5432 | 4 | 0.073638% |
| D | 5433 | 177 | 3.257869% |
Noise dominated data is calculated using 1-second bins in cleaned event files. If a bin has >2000 counts, and if more than 50% of those come from <1% of pixels, then it is considered to be noise-dominated and hence unusable.
| Quadrant | # 1 sec bins | Bins with >0 counts | Bins with >2000 counts | High rate bins dominated by noise | Noise dominated (total time) | Noise dominated (detector-on time) | Marked lightcurve |
|---|---|---|---|---|---|---|---|
| A | 7105 | 5433 | 503 | 503 | 7.08% | 9.26% | 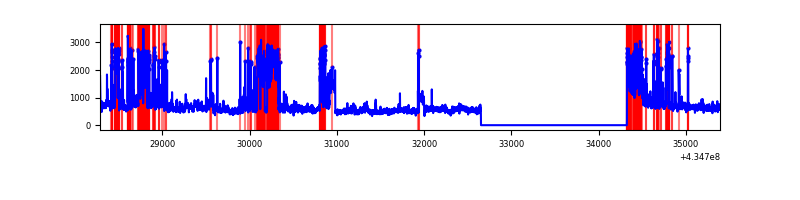 |
| B | 7105 | 5433 | 93 | 93 | 1.31% | 1.71% | 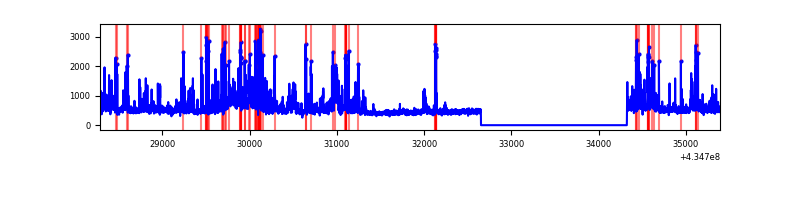 |
| C | 7105 | 5433 | 0 | 0 | 0.00% | 0.00% | 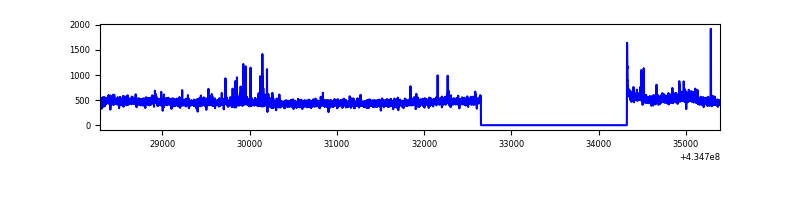 |
| D | 7106 | 5434 | 165 | 165 | 2.32% | 3.04% | 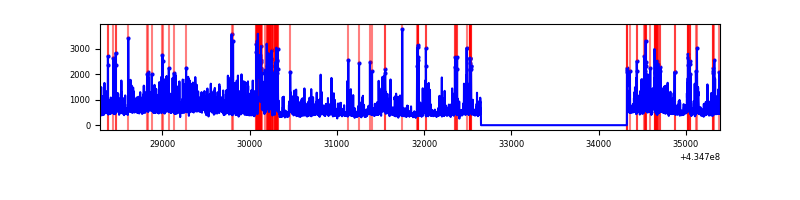 |
Top three noisy pixels from each quadrant. If the there are fewer than three noisy pixels in the level2.evt file, extra rows are filled as -1
| Pixel properties | Quadrant properties | ||||||
|---|---|---|---|---|---|---|---|
| Quadrant | DetID | PixID | Counts | Sigma | Mean | Median | Sigma |
| A | 15 | 222 | 1257078 | 10966.23 | 559 | 547 | 114.6 |
| A | 10 | 83 | 553895 | 4829.28 | 559 | 547 | 114.6 |
| A | 15 | 237 | 401939 | 3503.1 | 559 | 547 | 114.6 |
| B | 0 | 229 | 596166 | 5410.33 | 573 | 556 | 110.1 |
| B | 3 | 112 | 227714 | 2063.43 | 573 | 556 | 110.1 |
| B | 0 | 189 | 187309 | 1696.4 | 573 | 556 | 110.1 |
| C | 15 | 214 | 237691 | 1777.85 | 568 | 570 | 133.4 |
| C | 3 | 233 | 73761 | 548.76 | 568 | 570 | 133.4 |
| C | 0 | 207 | 22411 | 163.76 | 568 | 570 | 133.4 |
| D | 1 | 52 | 833715 | 6056.59 | 562 | 545 | 137.6 |
| D | 2 | 16 | 367593 | 2668.19 | 562 | 545 | 137.6 |
| D | 12 | 233 | 208082 | 1508.66 | 562 | 545 | 137.6 |
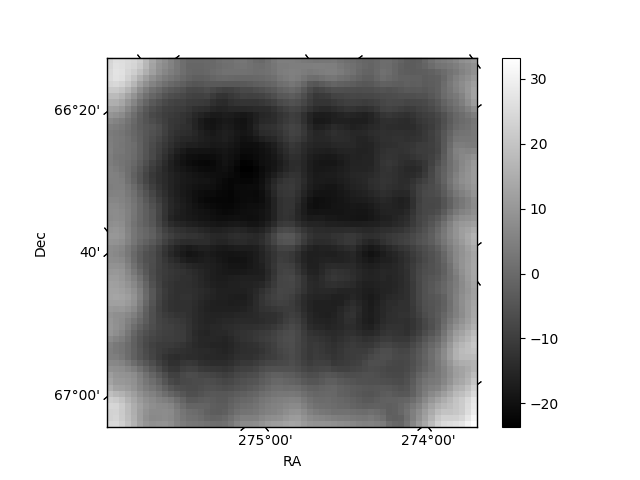
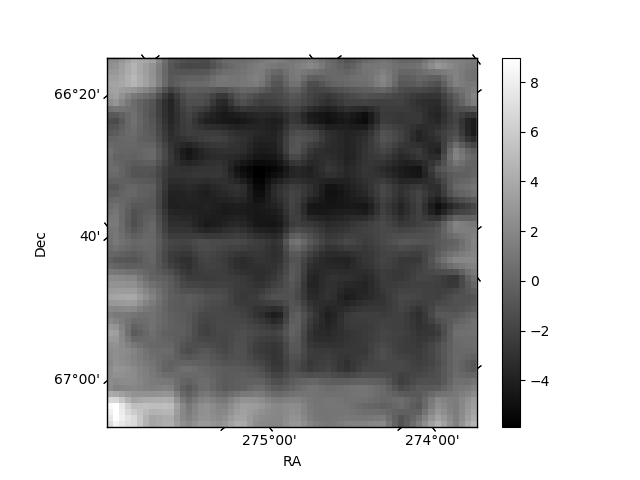
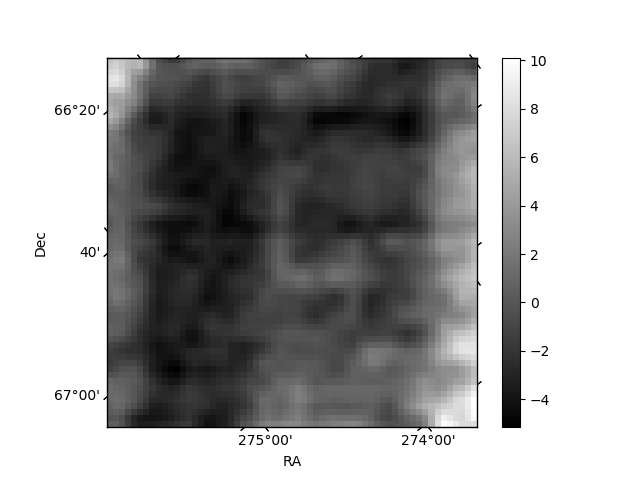
Histogram calculated using DETX and DETY for each event in the final _common_clean file
| Quadrant A | 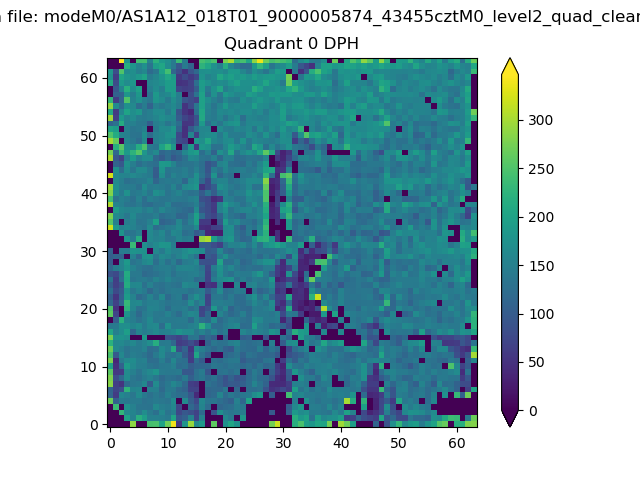 |
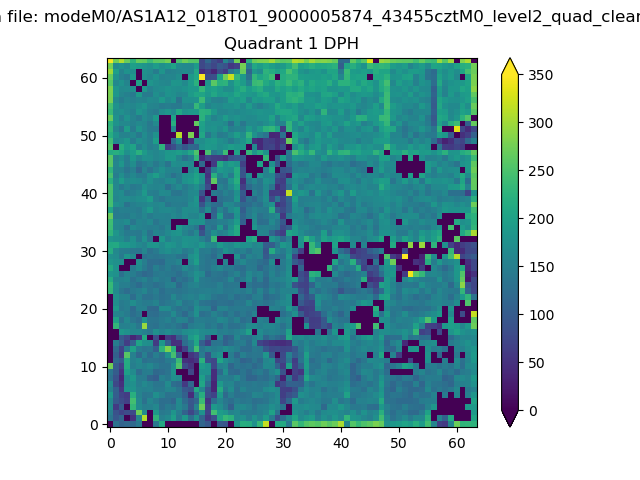 |
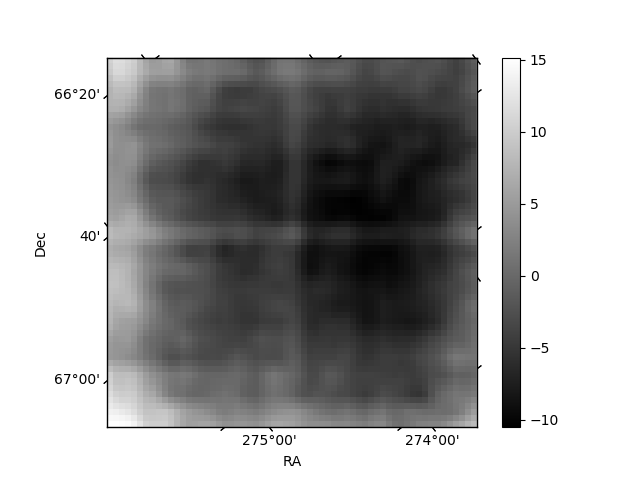
Quadrant B |
|---|---|---|---|
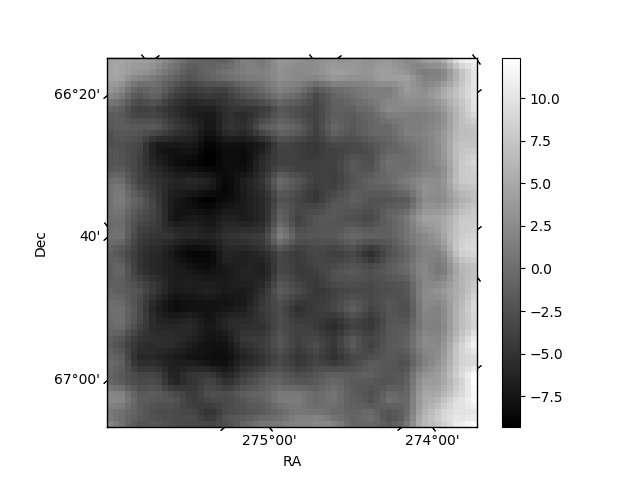
| Quadrant D | 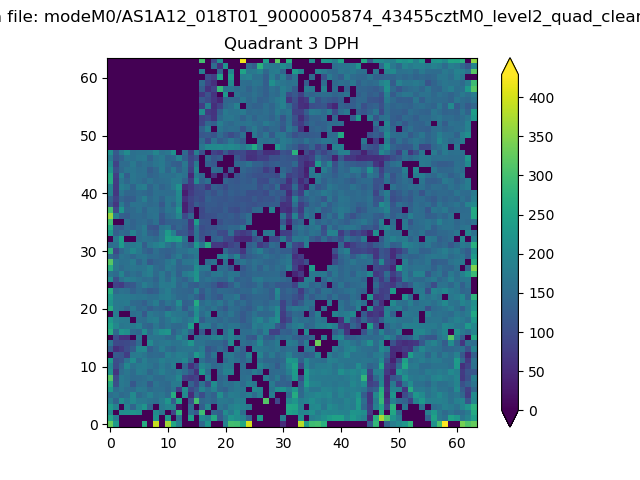 |
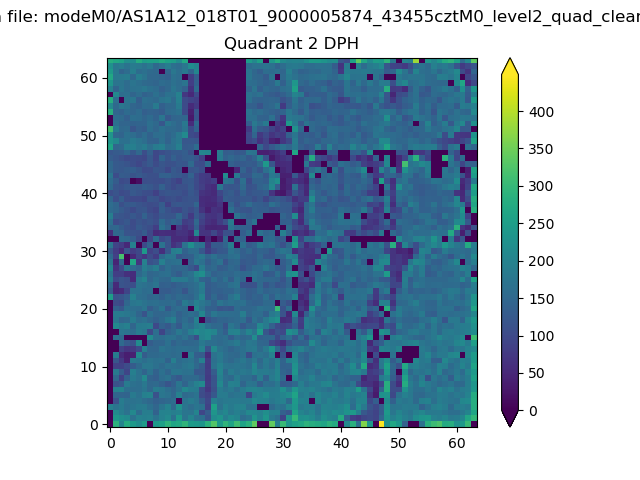 |
Quadrant C |
| Plot type | Count rate plots | Images |
|---|---|---|
| Comparison with Poisson distribution Blue bars denote a histogram of data divided into 1 sec bins. Red curve is a Poisson curve with rate = median count rate of data. |
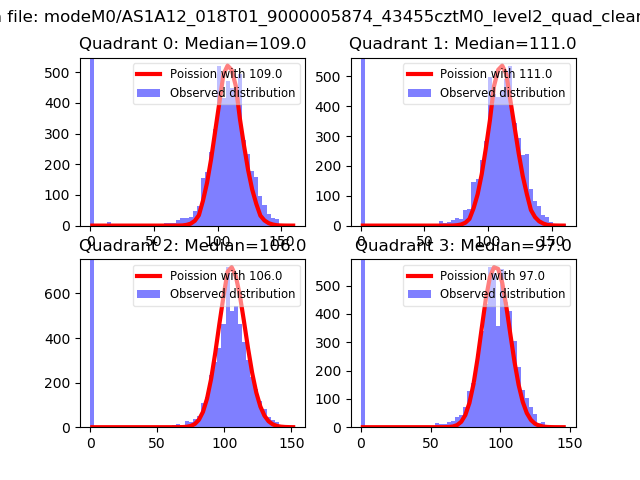 |
 |
| Quadrant-wise count rates Data is divided into 100 sec bins |
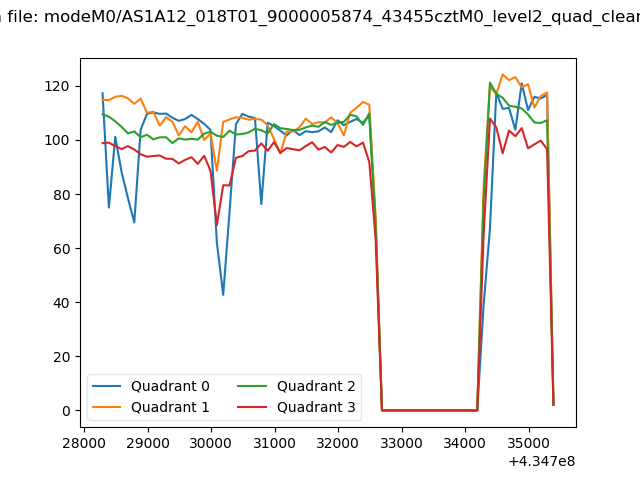 |
|
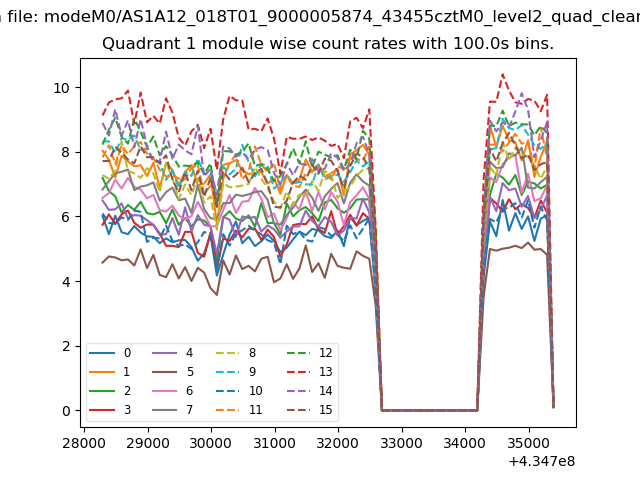
| Module-wise count rates for Quadrant A Data is divided into 100 sec bins |
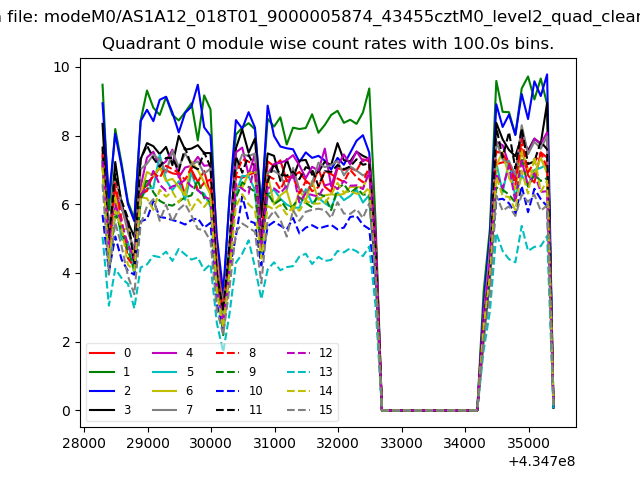 |
 |
| Module-wise count rates for Quadrant B Data is divided into 100 sec bins |
 |
 |
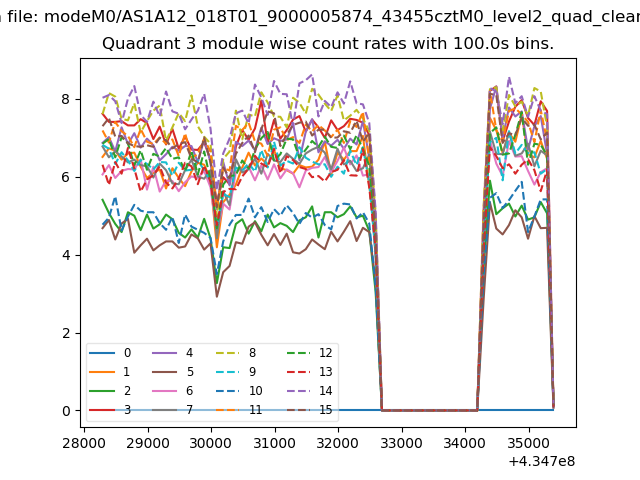
| Module-wise count rates for Quadrant C Data is divided into 100 sec bins |
 |
 |
| Module-wise count rates for Quadrant D Data is divided into 100 sec bins |
 |
 |
| Parameter | Plot |
|---|---|
| CZT HV Monitor |  |
| D_VDD | 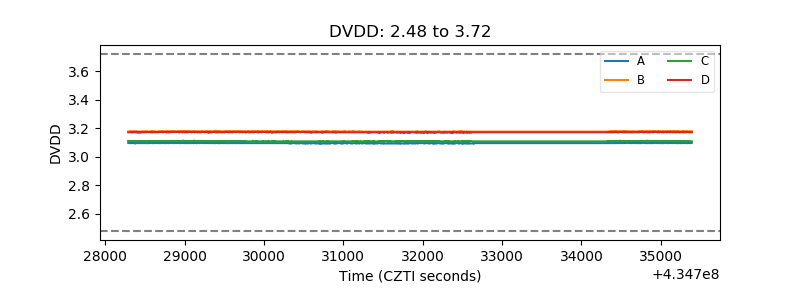 |
| Temperature 1 | 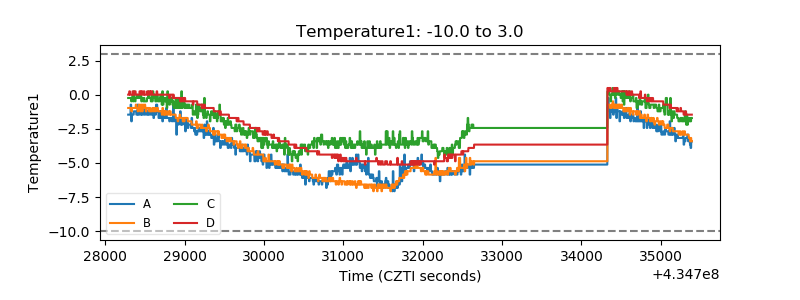 |
| Veto HV Monitor | 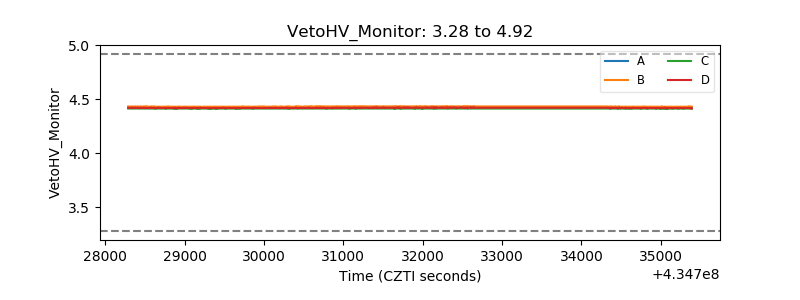 |
| Veto LLD | 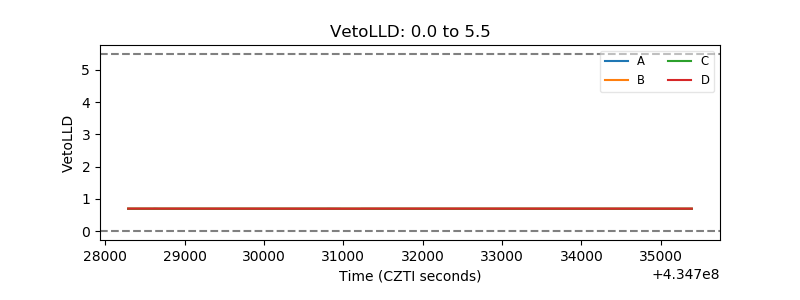 |
| Alpha Counter | 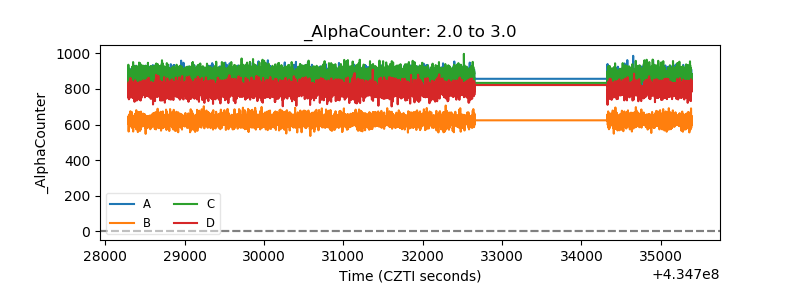 |
| _CPM_Rate | 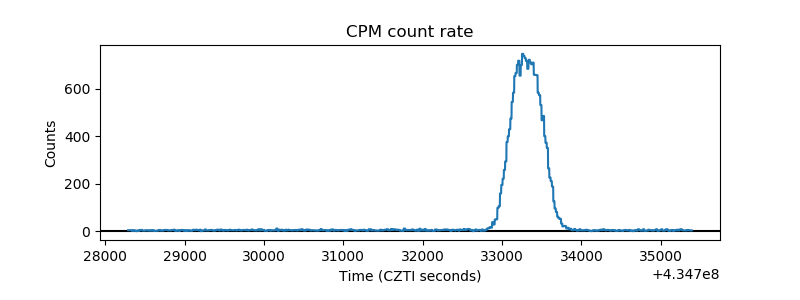 |
| CZT Counter | 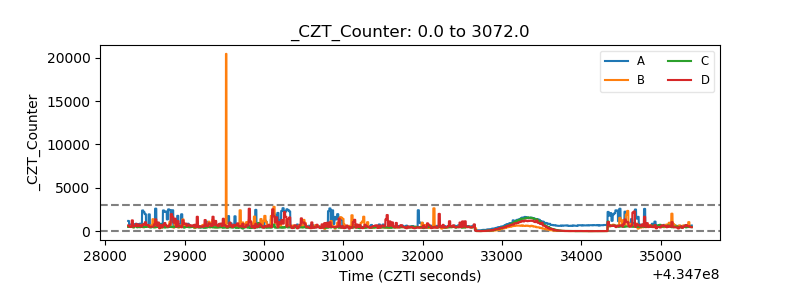 |
| +2.5 Volts monitor | 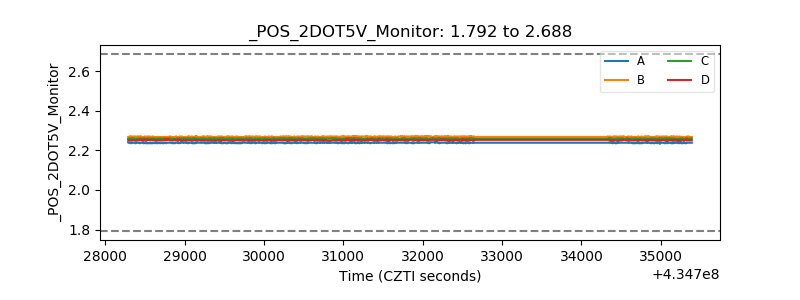 |
| +5 Volts monitor | 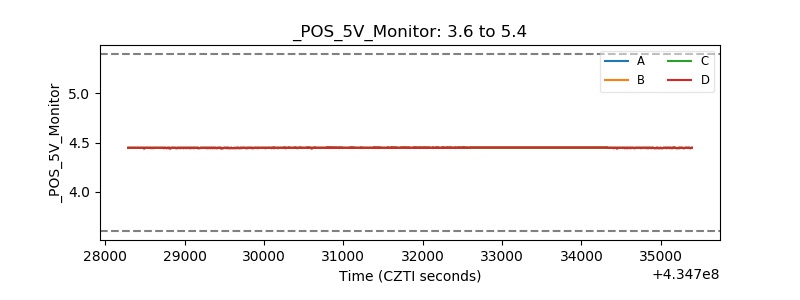 |
| _ROLL_ROT | 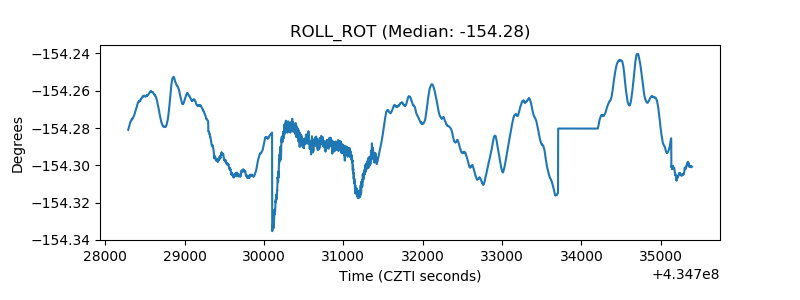 |
| _Roll_DEC | 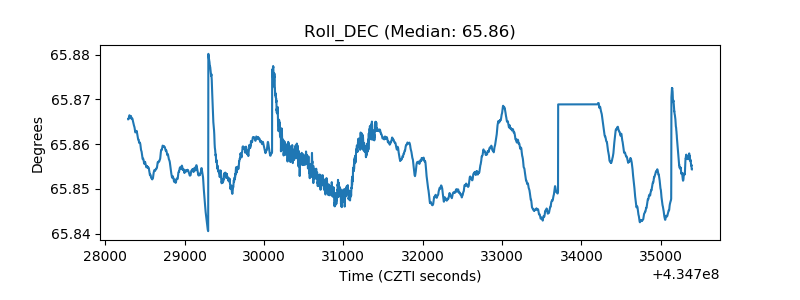 |
| _Roll_RA | 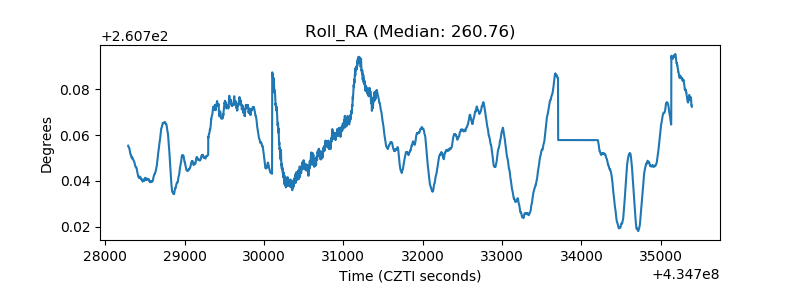 |
| Veto Counter | 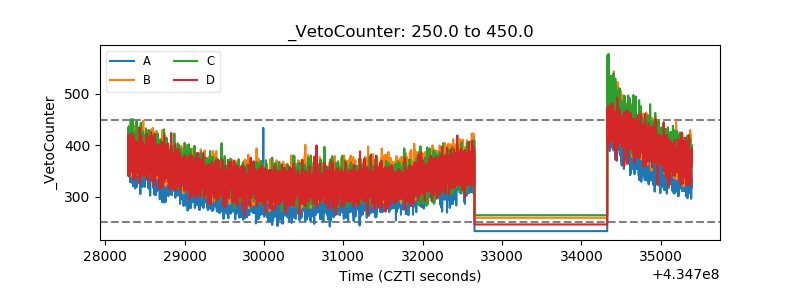 |