| Param | Original file | Final file |
|---|---|---|
| Filename | modeM0/AS1A12_018T01_9000005874_43458cztM0_level2.fits | modeM0/AS1A12_018T01_9000005874_43458cztM0_level2_quad_clean.evt |
| Size (bytes) | 405,915,840 | 86,353,920 |
| Size | 387.1 MB | 82.4 MB |
| Events in quadrant A | 3,587,170 | 581,369 |
| Events in quadrant B | 2,964,610 | 613,384 |
| Events in quadrant C | 2,523,449 | 586,497 |
| Events in quadrant D | 5,554,695 | 476,559 |
| Mode M0 | |||
|---|---|---|---|
| Quadrant | BADHDUFLAG | Total packets | Discarded packets |
| A | 0 | 13977 | 2 |
| B | 0 | 12379 | 2 |
| C | 0 | 10768 | 2 |
| D | 0 | 20105 | 2 |
| Mode M9 | |||
|---|---|---|---|
| Quadrant | BADHDUFLAG | Total packets | Discarded packets |
| A | 0 | 23 | 0 |
| B | 0 | 24 | 0 |
| C | 0 | 24 | 0 |
| D | 0 | 24 | 0 |
| Mode SS | |||
|---|---|---|---|
| Quadrant | BADHDUFLAG | Total packets | Discarded packets |
| A | 0 | 104 | 0 |
| B | 0 | 104 | 0 |
| C | 0 | 104 | 0 |
| D | 0 | 104 | 0 |
| Quadrant | Total seconds | Saturated seconds | Saturation percentage |
|---|---|---|---|
| A | 5090 | 165 | 3.241650% |
| B | 5090 | 19 | 0.373281% |
| C | 5090 | 20 | 0.392927% |
| D | 5090 | 774 | 15.206287% |
Noise dominated data is calculated using 1-second bins in cleaned event files. If a bin has >2000 counts, and if more than 50% of those come from <1% of pixels, then it is considered to be noise-dominated and hence unusable.
| Quadrant | # 1 sec bins | Bins with >0 counts | Bins with >2000 counts | High rate bins dominated by noise | Noise dominated (total time) | Noise dominated (detector-on time) | Marked lightcurve |
|---|---|---|---|---|---|---|---|
| A | 7064 | 5091 | 165 | 165 | 2.34% | 3.24% | 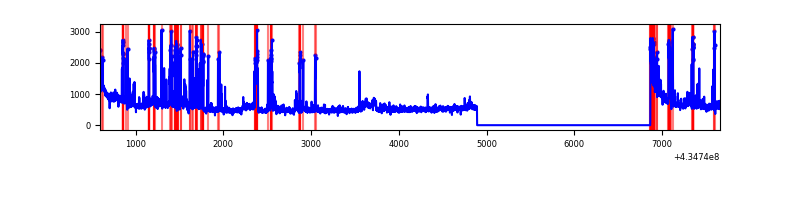 |
| B | 7064 | 5091 | 7 | 7 | 0.10% | 0.14% | 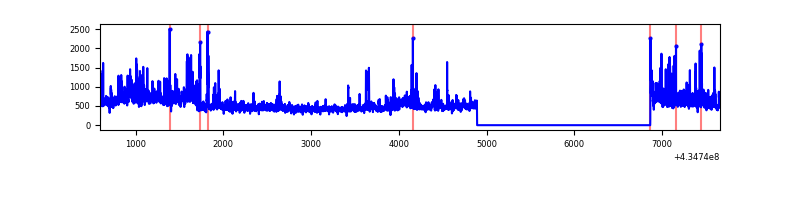 |
| C | 7064 | 5091 | 16 | 16 | 0.23% | 0.31% | 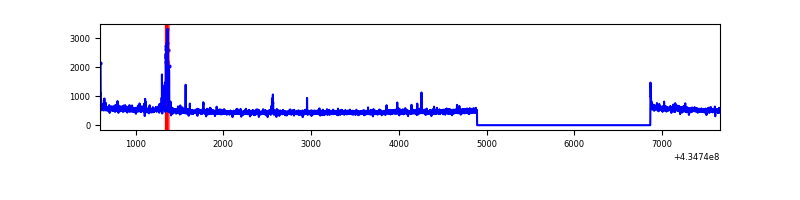 |
| D | 7064 | 5091 | 789 | 789 | 11.17% | 15.50% | 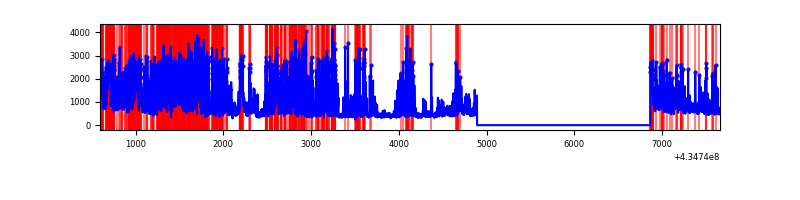 |
Top three noisy pixels from each quadrant. If the there are fewer than three noisy pixels in the level2.evt file, extra rows are filled as -1
| Pixel properties | Quadrant properties | ||||||
|---|---|---|---|---|---|---|---|
| Quadrant | DetID | PixID | Counts | Sigma | Mean | Median | Sigma |
| A | 10 | 83 | 601231 | 5329.93 | 549 | 538 | 112.7 |
| A | 15 | 222 | 469903 | 4164.66 | 549 | 538 | 112.7 |
| A | 15 | 237 | 315931 | 2798.47 | 549 | 538 | 112.7 |
| B | 3 | 112 | 260041 | 2423.53 | 561 | 546 | 107.1 |
| B | 0 | 189 | 184679 | 1719.7 | 561 | 546 | 107.1 |
| B | 0 | 245 | 149279 | 1389.08 | 561 | 546 | 107.1 |
| C | 15 | 214 | 224781 | 1780.9 | 553 | 557 | 125.9 |
| C | 15 | 159 | 74550 | 587.69 | 553 | 557 | 125.9 |
| C | 3 | 233 | 42808 | 335.58 | 553 | 557 | 125.9 |
| D | 1 | 52 | 2454902 | 19703.05 | 514 | 500 | 124.6 |
| D | 2 | 16 | 376858 | 3021.27 | 514 | 500 | 124.6 |
| D | 1 | 47 | 291662 | 2337.34 | 514 | 500 | 124.6 |
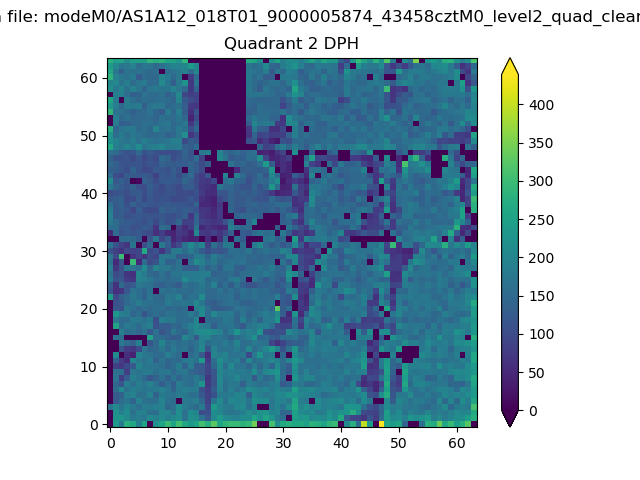
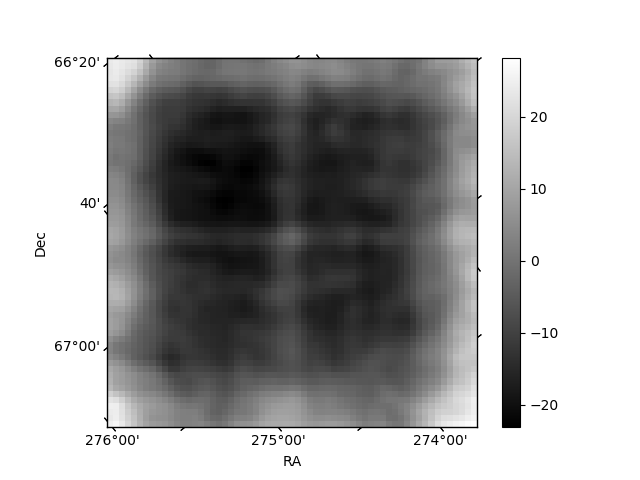
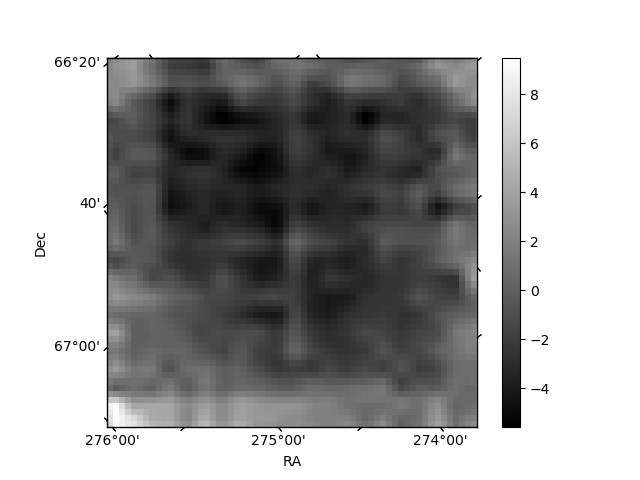
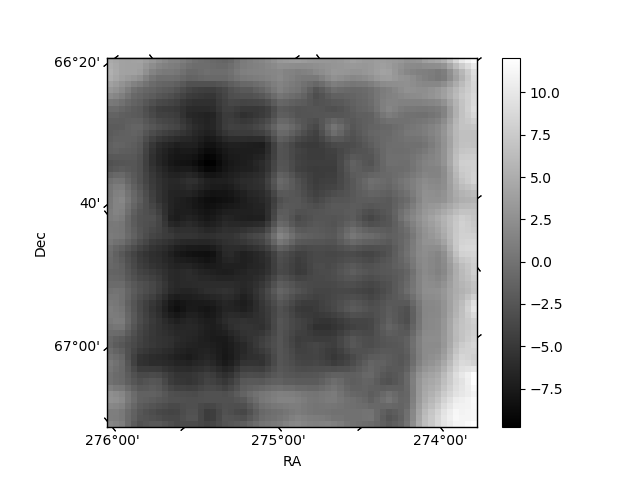
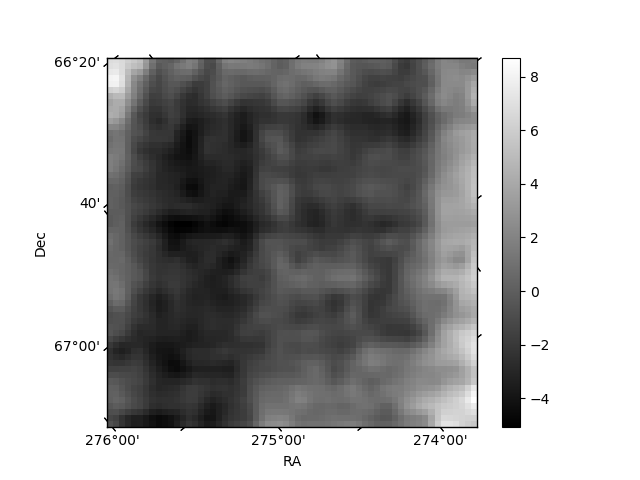
Histogram calculated using DETX and DETY for each event in the final _common_clean file
| Quadrant A | 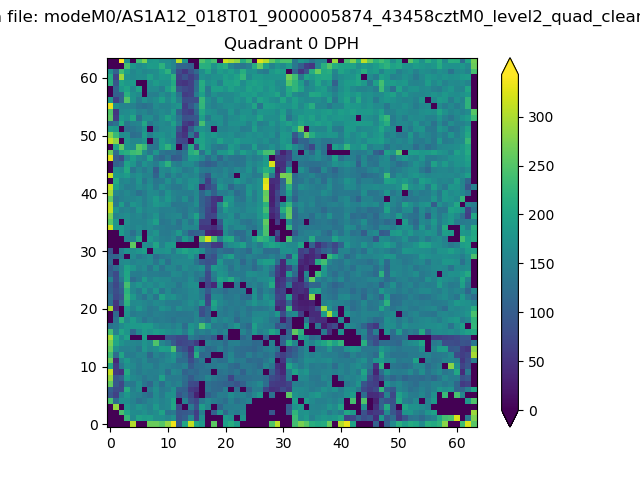 |
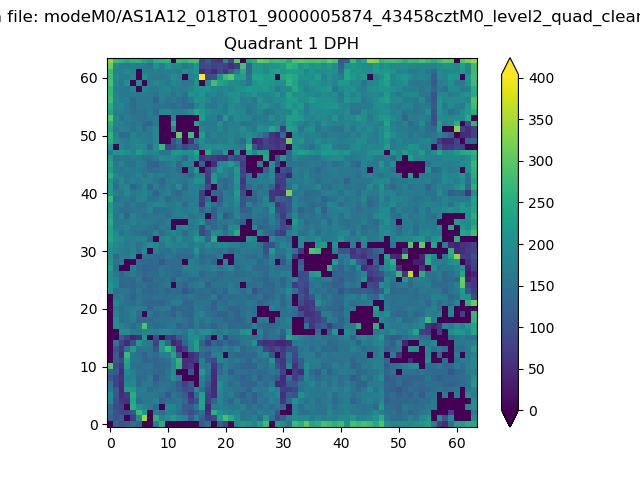 |
Quadrant B |
|---|---|---|---|
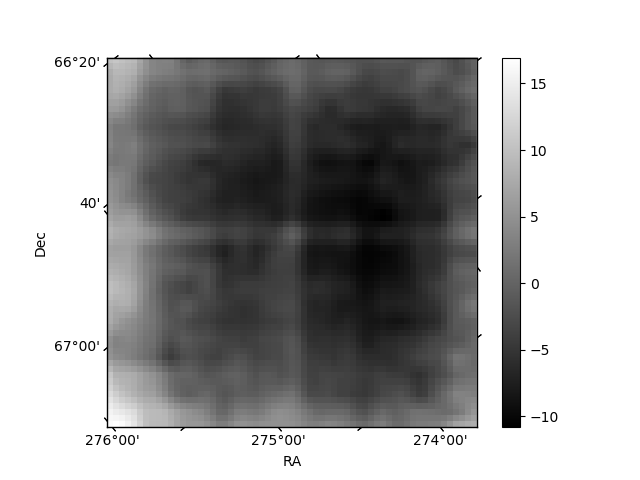
| Quadrant D | 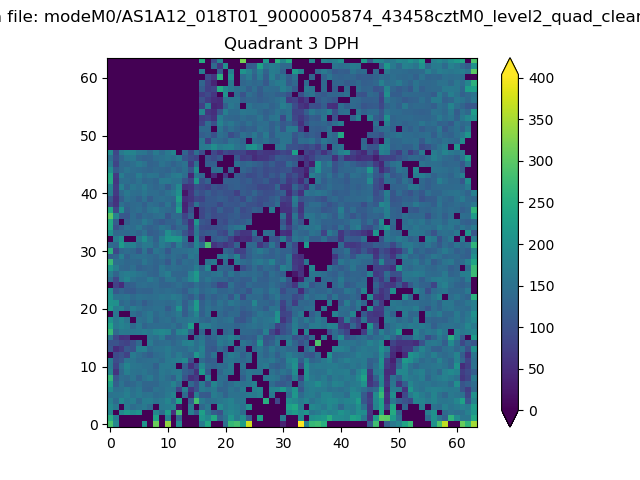 |
 |
Quadrant C |
| Plot type | Count rate plots | Images |
|---|---|---|
| Comparison with Poisson distribution Blue bars denote a histogram of data divided into 1 sec bins. Red curve is a Poisson curve with rate = median count rate of data. |
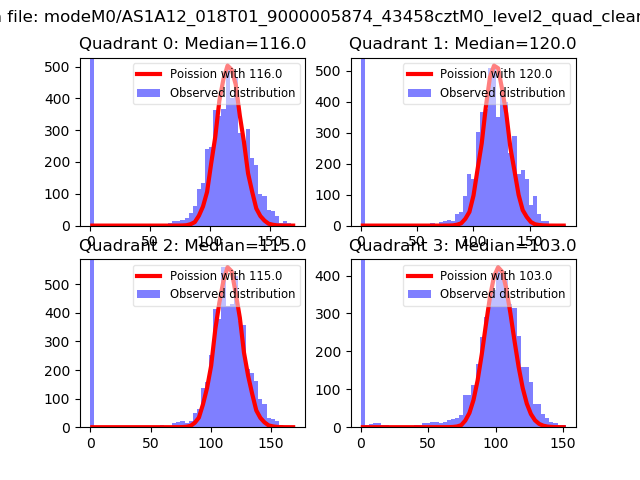 |
 |
| Quadrant-wise count rates Data is divided into 100 sec bins |
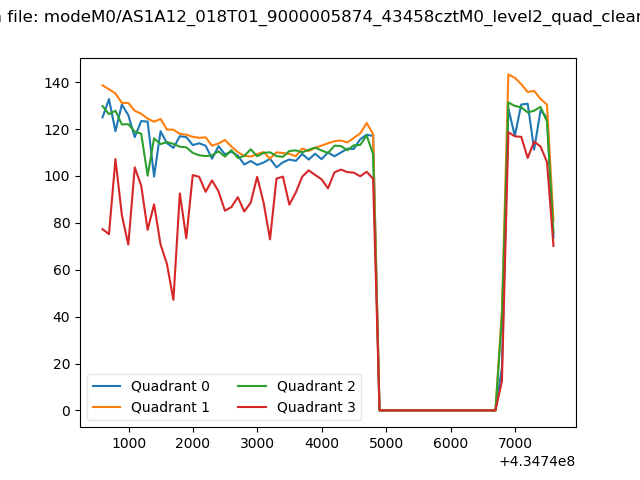 |
|
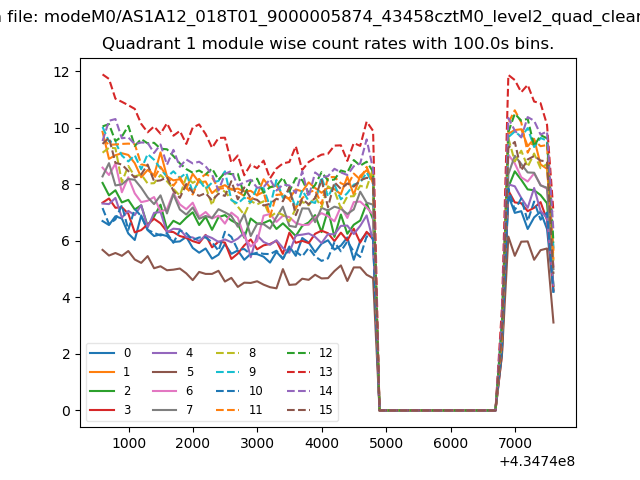
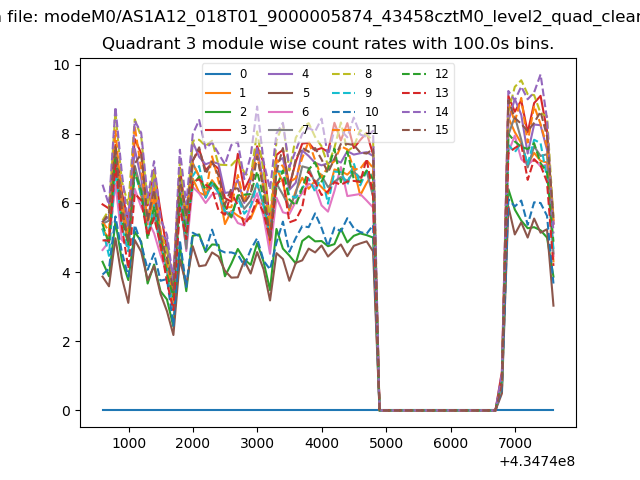
| Module-wise count rates for Quadrant A Data is divided into 100 sec bins |
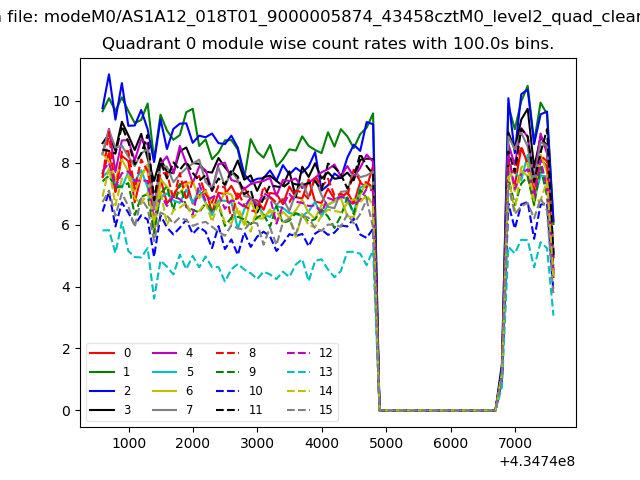 |
 |
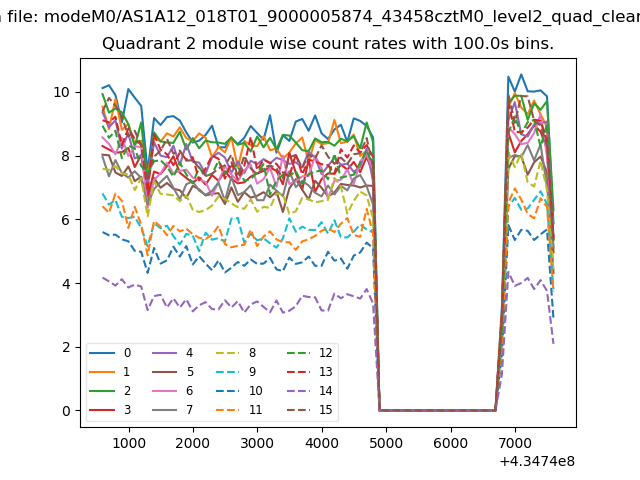
| Module-wise count rates for Quadrant B Data is divided into 100 sec bins |
 |
 |
| Module-wise count rates for Quadrant C Data is divided into 100 sec bins |
 |
 |
| Module-wise count rates for Quadrant D Data is divided into 100 sec bins |
 |
 |
| Parameter | Plot |
|---|---|
| CZT HV Monitor | 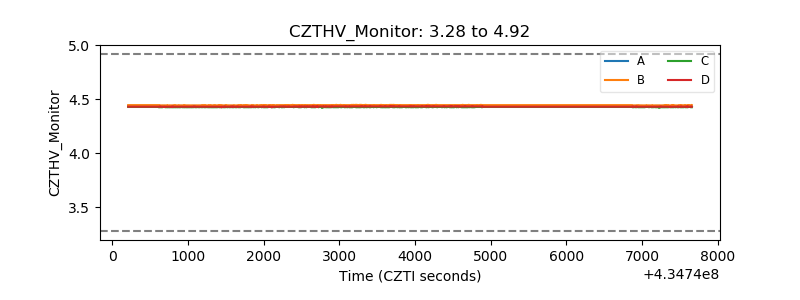 |
| D_VDD | 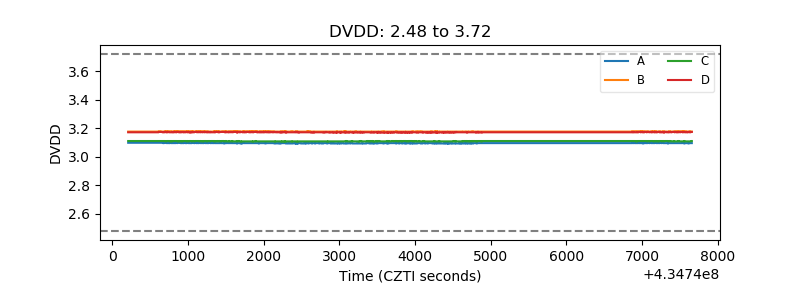 |
| Temperature 1 | 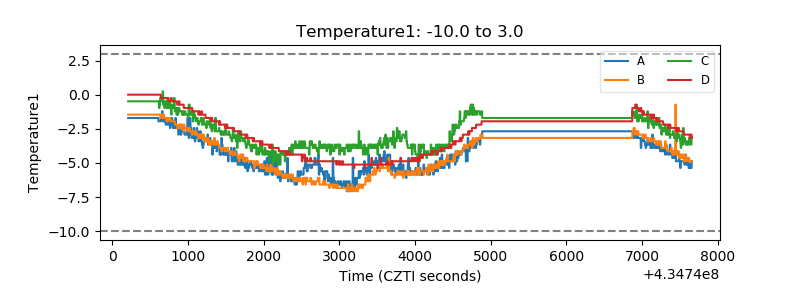 |
| Veto HV Monitor | 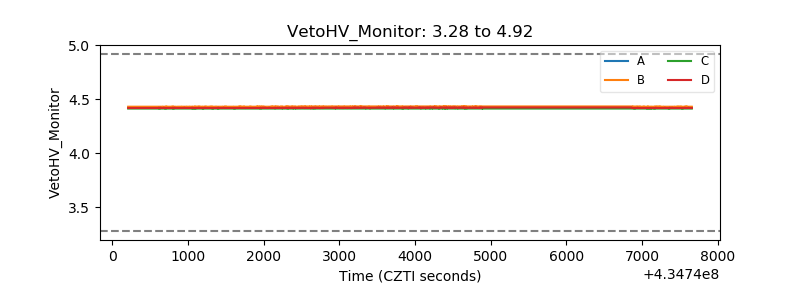 |
| Veto LLD | 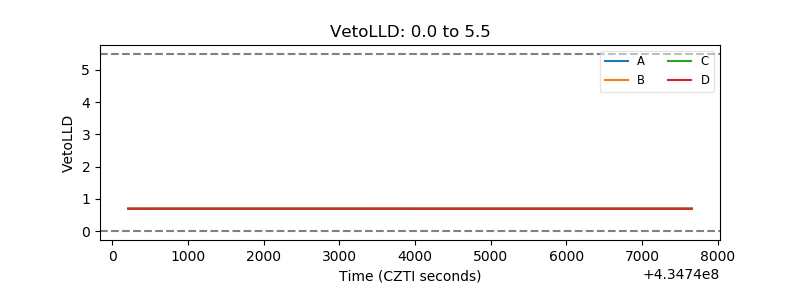 |
| Alpha Counter | 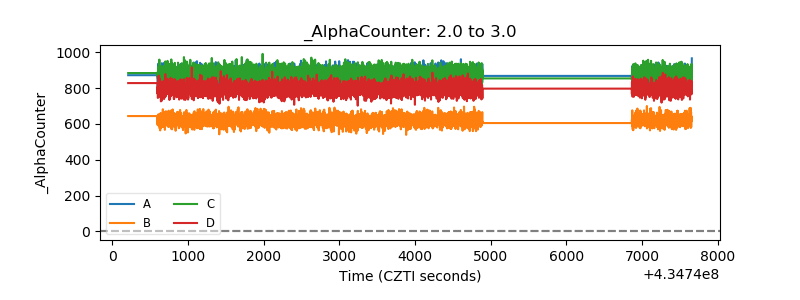 |
| _CPM_Rate | 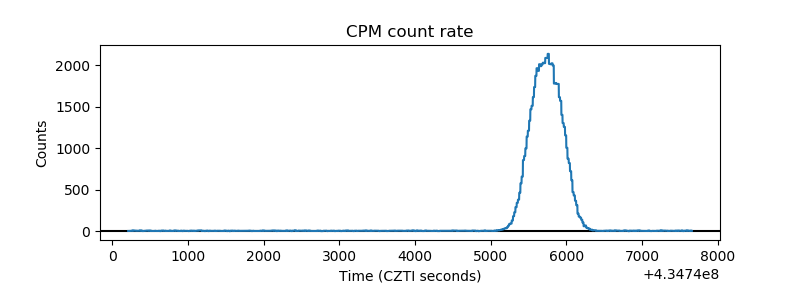 |
| CZT Counter | 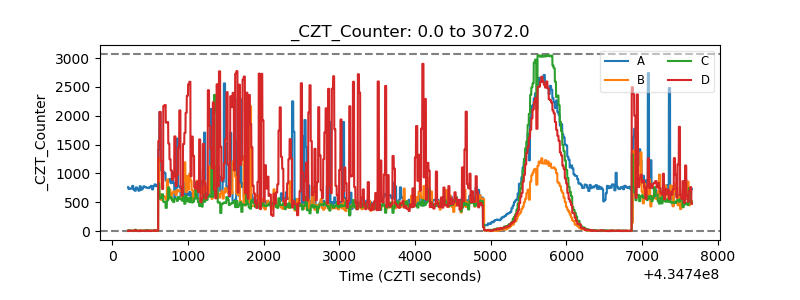 |
| +2.5 Volts monitor | 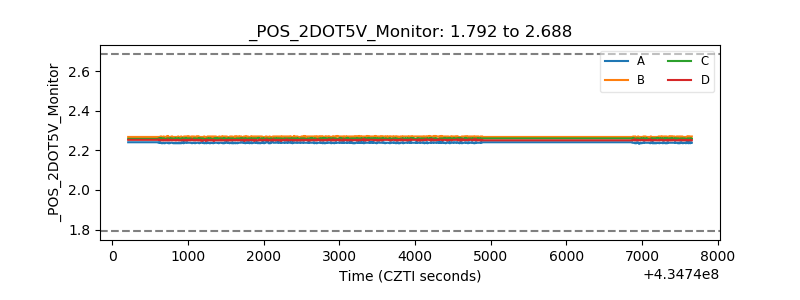 |
| +5 Volts monitor | 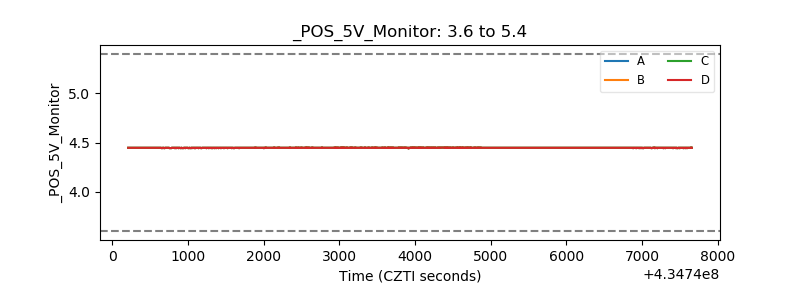 |
| _ROLL_ROT | 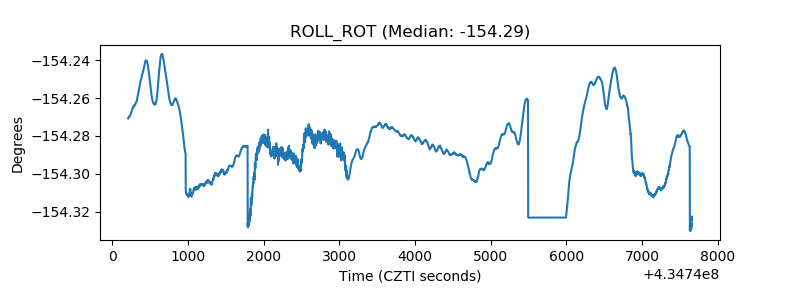 |
| _Roll_DEC | 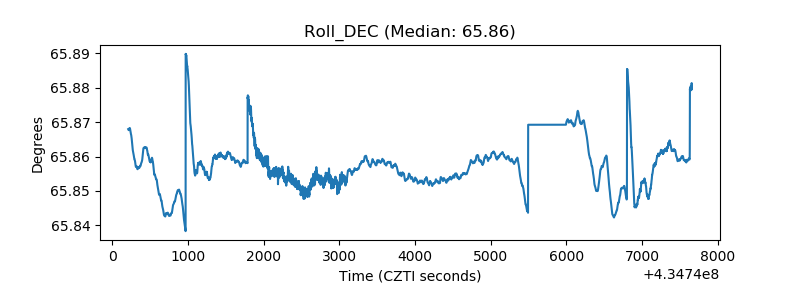 |
| _Roll_RA | 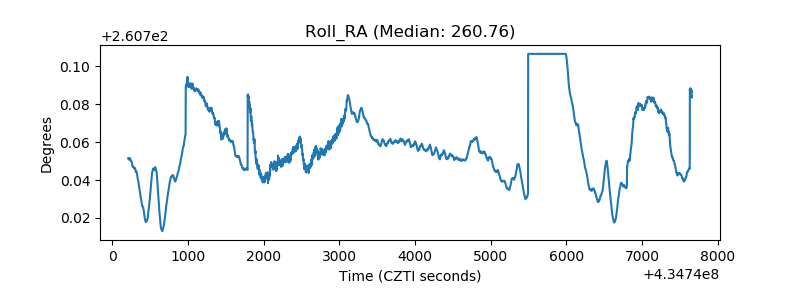 |
| Veto Counter |  |