| Param | Original file | Final file |
|---|---|---|
| Filename | modeM0/AS1A12_018T01_9000005874_43459cztM0_level2.fits | modeM0/AS1A12_018T01_9000005874_43459cztM0_level2_quad_clean.evt |
| Size (bytes) | 337,838,400 | 88,508,160 |
| Size | 322.2 MB | 84.4 MB |
| Events in quadrant A | 3,298,175 | 585,769 |
| Events in quadrant B | 2,660,427 | 619,574 |
| Events in quadrant C | 2,412,329 | 592,656 |
| Events in quadrant D | 3,745,160 | 531,315 |
| Mode M0 | |||
|---|---|---|---|
| Quadrant | BADHDUFLAG | Total packets | Discarded packets |
| A | 0 | 12948 | 2 |
| B | 0 | 11292 | 2 |
| C | 0 | 10283 | 2 |
| D | 0 | 14575 | 2 |
| Mode M9 | |||
|---|---|---|---|
| Quadrant | BADHDUFLAG | Total packets | Discarded packets |
| A | 0 | 28 | 0 |
| B | 0 | 29 | 0 |
| C | 0 | 29 | 0 |
| D | 0 | 29 | 0 |
| Mode SS | |||
|---|---|---|---|
| Quadrant | BADHDUFLAG | Total packets | Discarded packets |
| A | 0 | 102 | 0 |
| B | 0 | 102 | 0 |
| C | 0 | 102 | 0 |
| D | 0 | 102 | 0 |
| Quadrant | Total seconds | Saturated seconds | Saturation percentage |
|---|---|---|---|
| A | 5005 | 86 | 1.718282% |
| B | 5005 | 23 | 0.459540% |
| C | 5005 | 3 | 0.059940% |
| D | 5004 | 131 | 2.617906% |
Noise dominated data is calculated using 1-second bins in cleaned event files. If a bin has >2000 counts, and if more than 50% of those come from <1% of pixels, then it is considered to be noise-dominated and hence unusable.
| Quadrant | # 1 sec bins | Bins with >0 counts | Bins with >2000 counts | High rate bins dominated by noise | Noise dominated (total time) | Noise dominated (detector-on time) | Marked lightcurve |
|---|---|---|---|---|---|---|---|
| A | 7038 | 5006 | 73 | 73 | 1.04% | 1.46% | 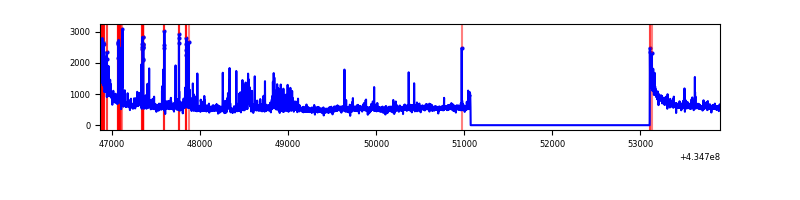 |
| B | 7038 | 5006 | 11 | 11 | 0.16% | 0.22% | 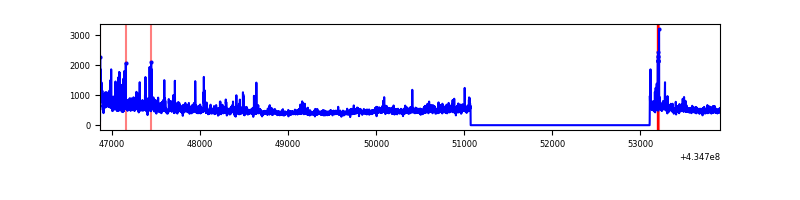 |
| C | 7038 | 5006 | 0 | 0 | 0.00% | 0.00% | 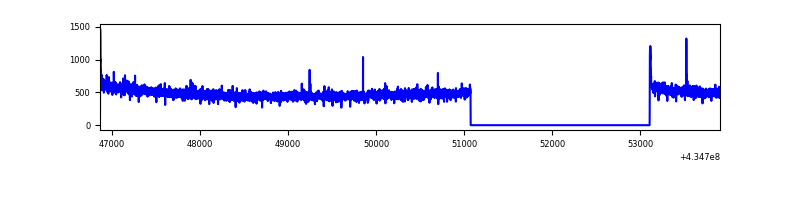 |
| D | 7037 | 5005 | 130 | 130 | 1.85% | 2.60% | 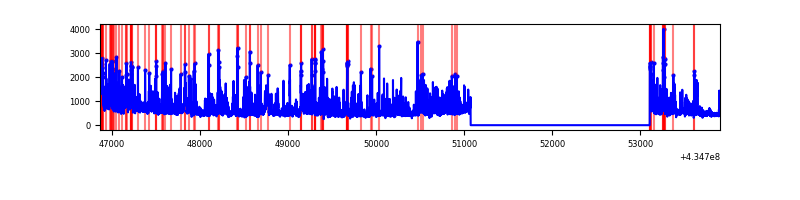 |
Top three noisy pixels from each quadrant. If the there are fewer than three noisy pixels in the level2.evt file, extra rows are filled as -1
| Pixel properties | Quadrant properties | ||||||
|---|---|---|---|---|---|---|---|
| Quadrant | DetID | PixID | Counts | Sigma | Mean | Median | Sigma |
| A | 10 | 83 | 568512 | 5081.97 | 546 | 535 | 111.8 |
| A | 15 | 237 | 408558 | 3650.78 | 546 | 535 | 111.8 |
| A | 15 | 222 | 187578 | 1673.56 | 546 | 535 | 111.8 |
| B | 0 | 245 | 288617 | 2775.02 | 556 | 542 | 103.8 |
| B | 0 | 189 | 72309 | 691.33 | 556 | 542 | 103.8 |
| B | 0 | 186 | 53093 | 506.22 | 556 | 542 | 103.8 |
| C | 15 | 214 | 219813 | 1718.07 | 551 | 554 | 127.6 |
| C | 3 | 233 | 35018 | 270.05 | 551 | 554 | 127.6 |
| C | 13 | 61 | 3698 | 24.64 | 551 | 554 | 127.6 |
| D | 1 | 52 | 808874 | 6151.0 | 537 | 522 | 131.4 |
| D | 2 | 16 | 289462 | 2198.63 | 537 | 522 | 131.4 |
| D | 2 | 249 | 231223 | 1755.48 | 537 | 522 | 131.4 |
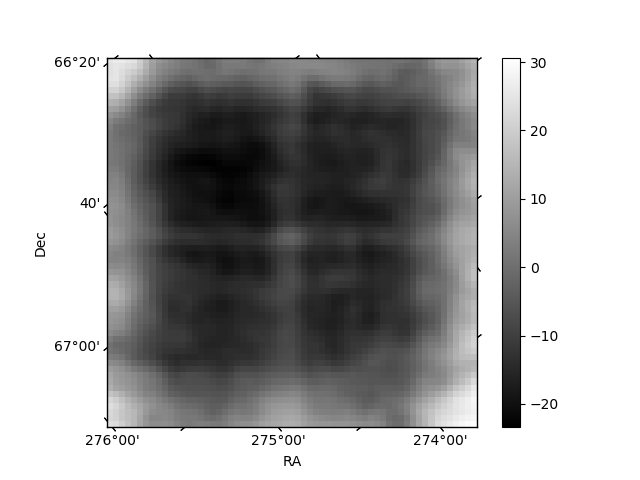
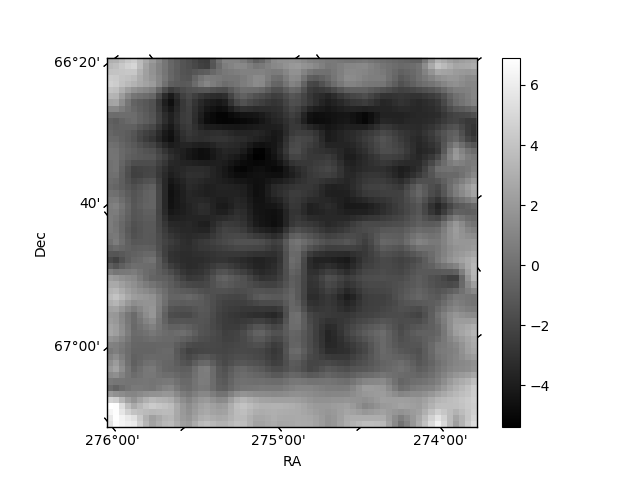
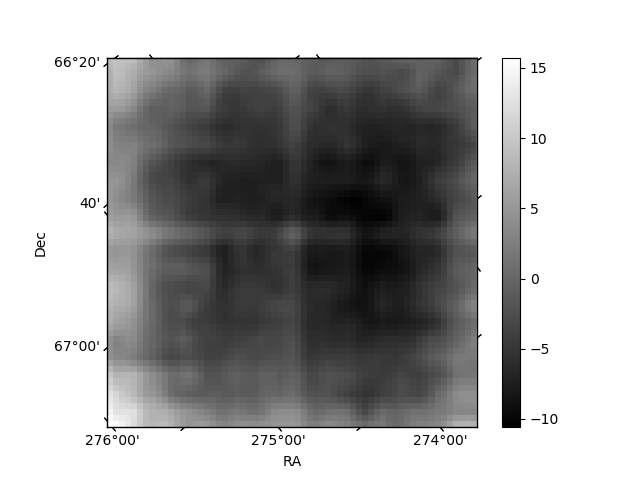
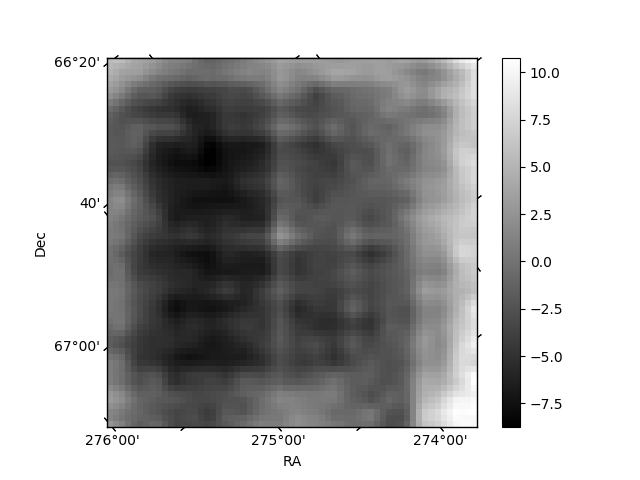
Histogram calculated using DETX and DETY for each event in the final _common_clean file
| Quadrant A | 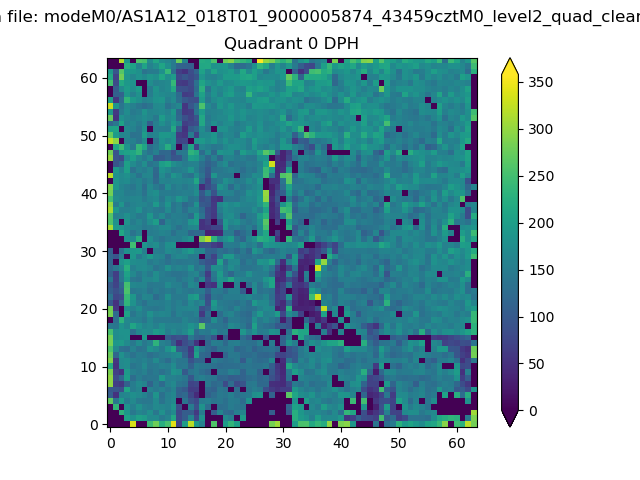 |
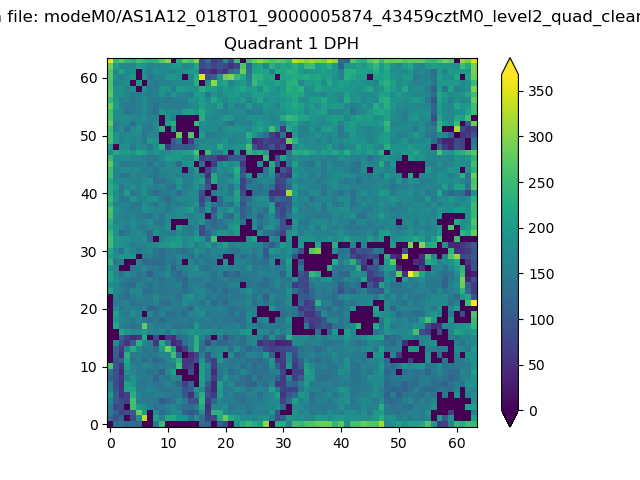 |
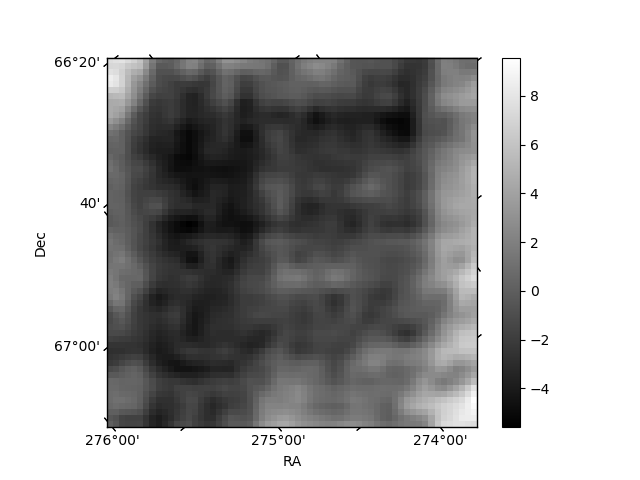
Quadrant B |
|---|---|---|---|
| Quadrant D | 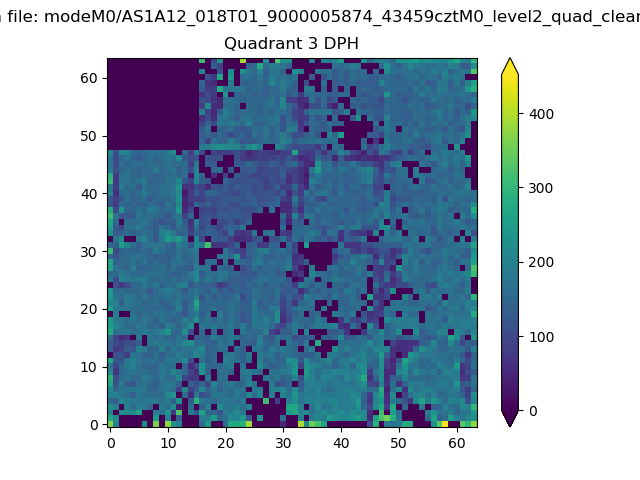 |
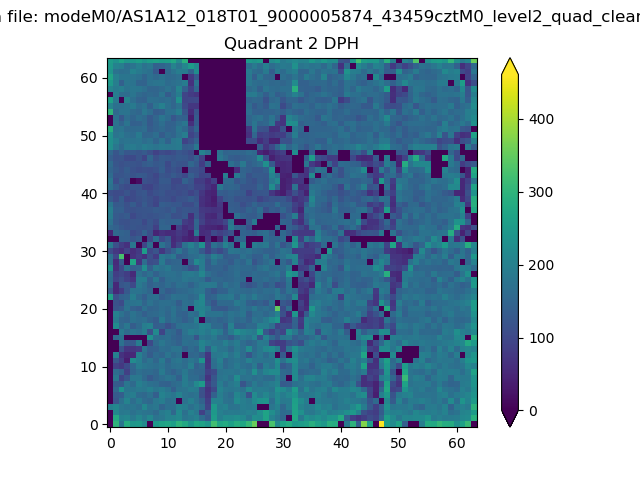 |
Quadrant C |
| Plot type | Count rate plots | Images |
|---|---|---|
| Comparison with Poisson distribution Blue bars denote a histogram of data divided into 1 sec bins. Red curve is a Poisson curve with rate = median count rate of data. |
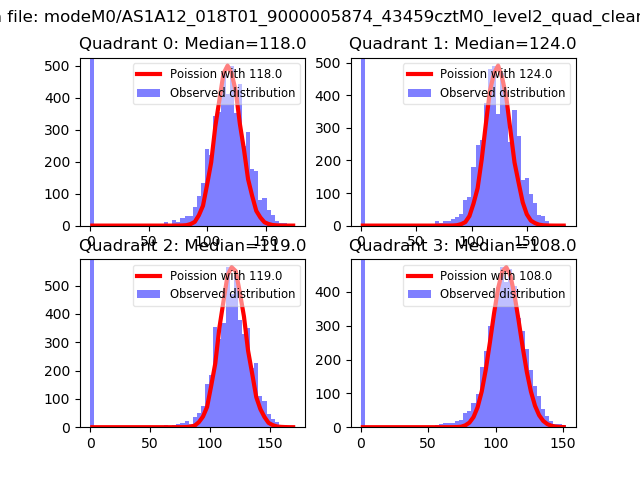 |
 |
| Quadrant-wise count rates Data is divided into 100 sec bins |
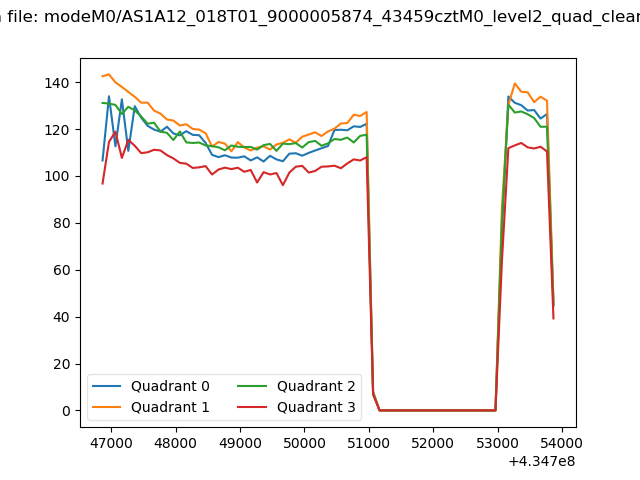 |
|
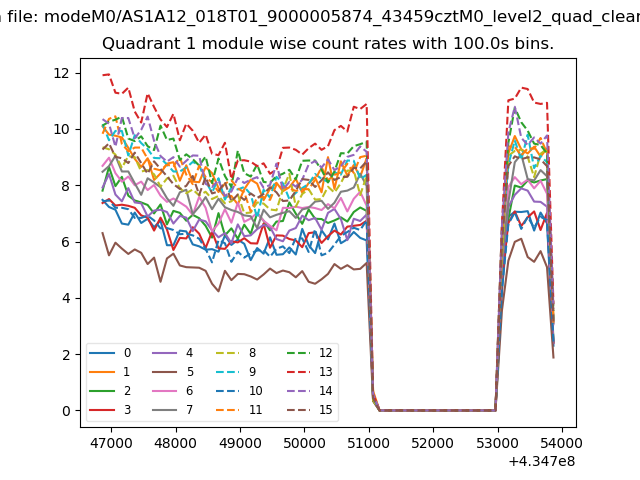
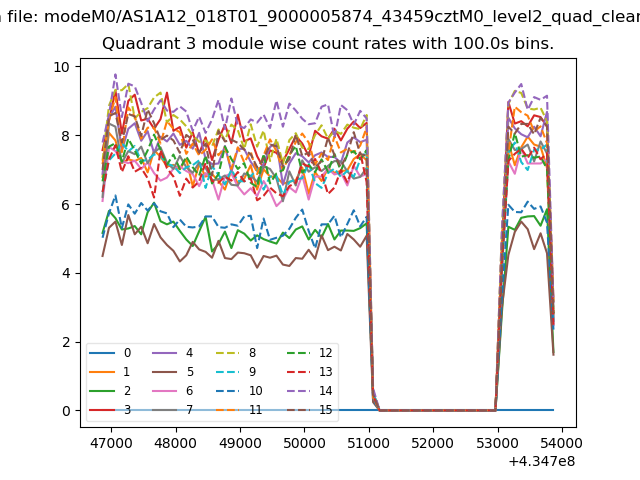
| Module-wise count rates for Quadrant A Data is divided into 100 sec bins |
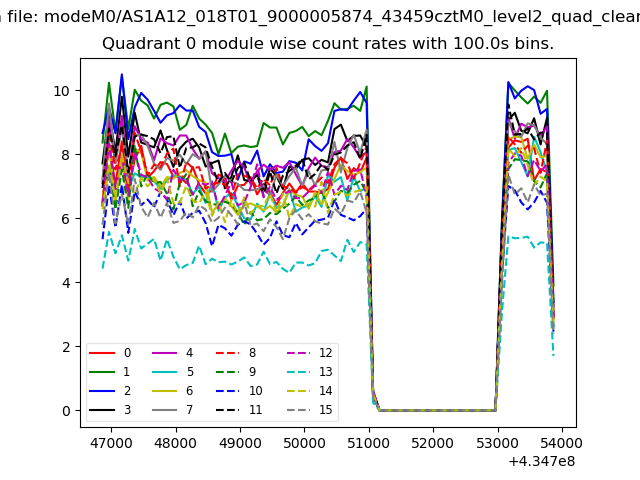 |
 |
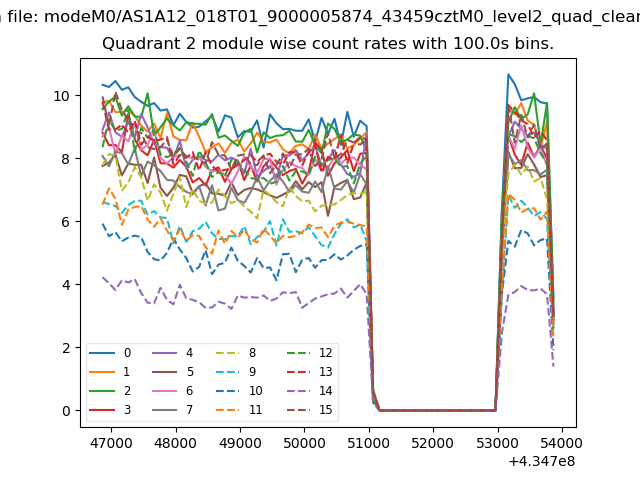
| Module-wise count rates for Quadrant B Data is divided into 100 sec bins |
 |
 |
| Module-wise count rates for Quadrant C Data is divided into 100 sec bins |
 |
 |
| Module-wise count rates for Quadrant D Data is divided into 100 sec bins |
 |
 |
| Parameter | Plot |
|---|---|
| CZT HV Monitor |  |
| D_VDD | 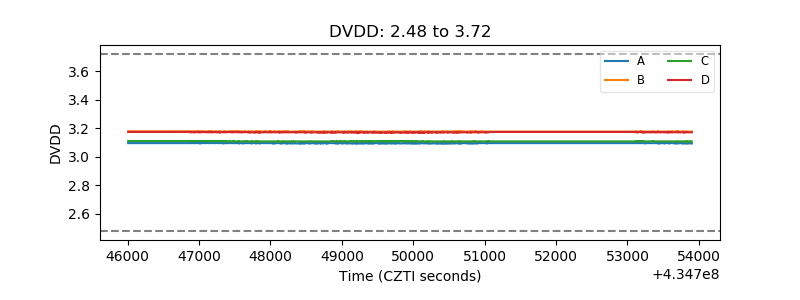 |
| Temperature 1 | 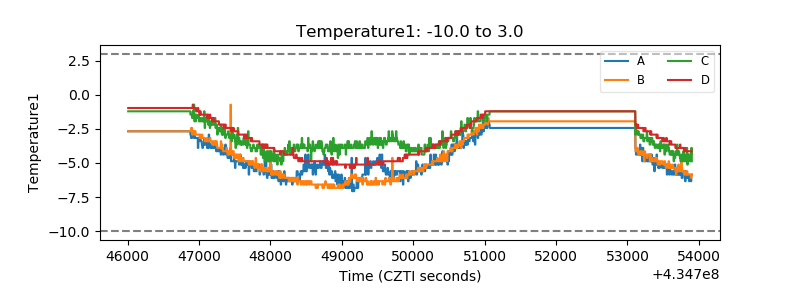 |
| Veto HV Monitor | 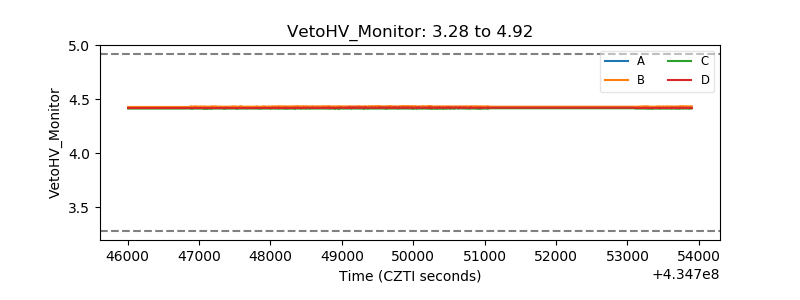 |
| Veto LLD | 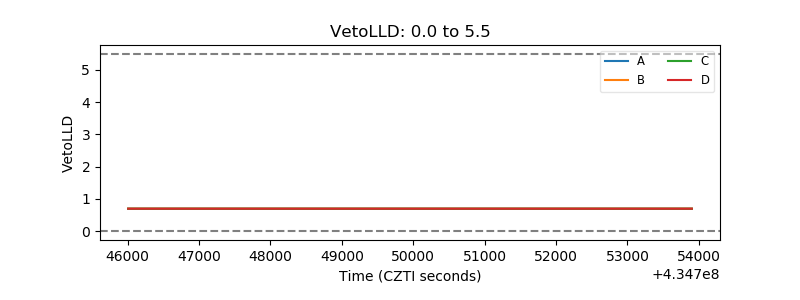 |
| Alpha Counter | 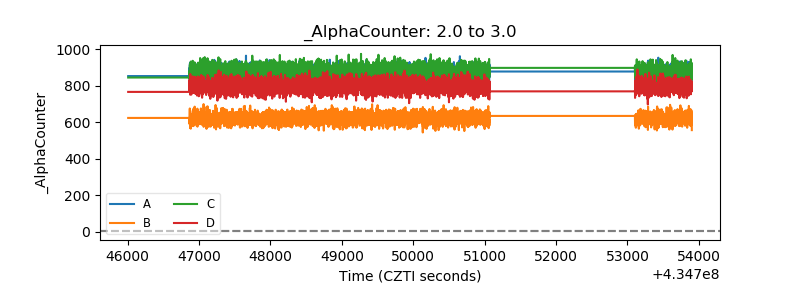 |
| _CPM_Rate | 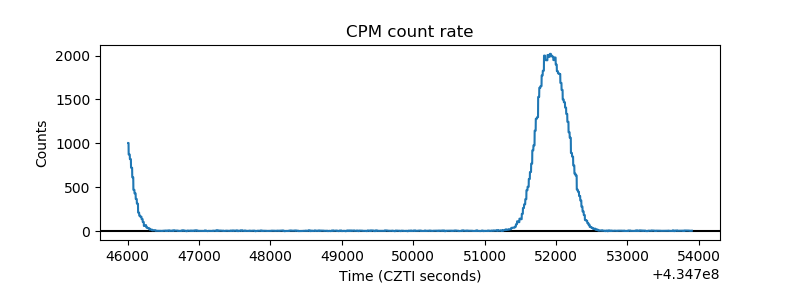 |
| CZT Counter | 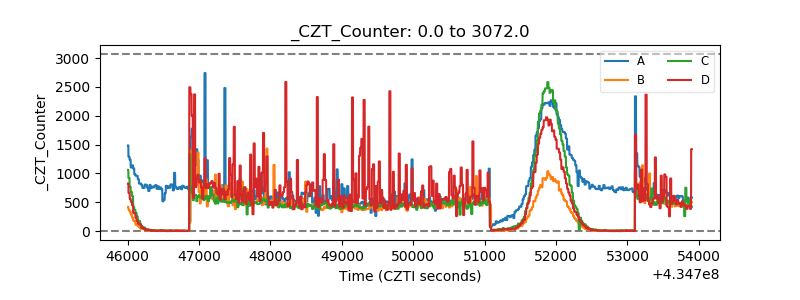 |
| +2.5 Volts monitor | 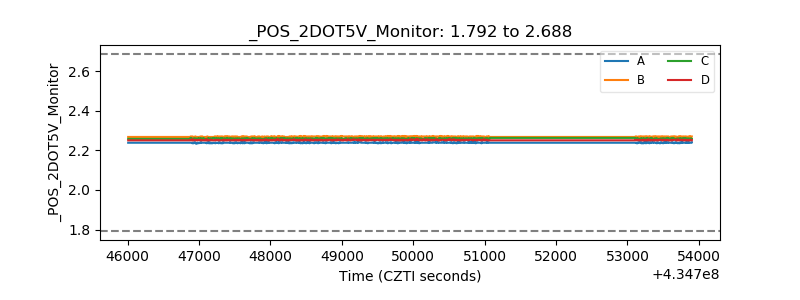 |
| +5 Volts monitor | 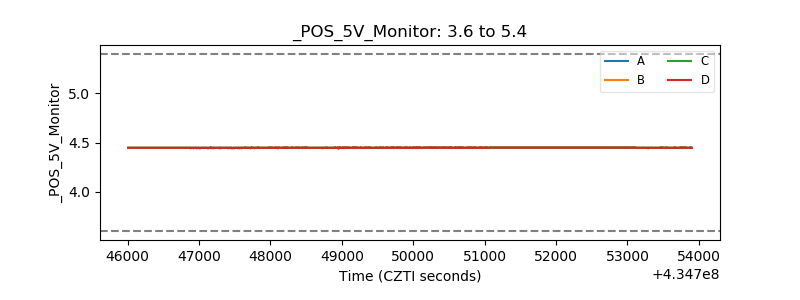 |
| _ROLL_ROT | 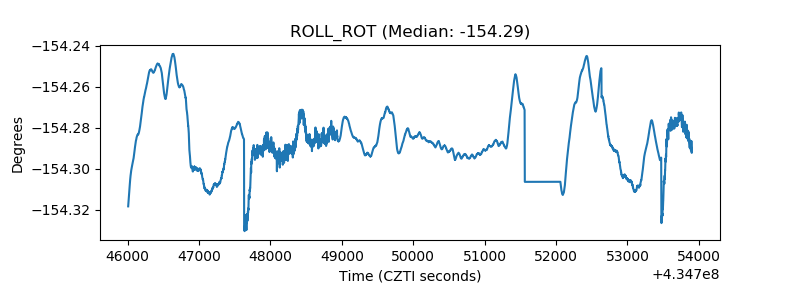 |
| _Roll_DEC | 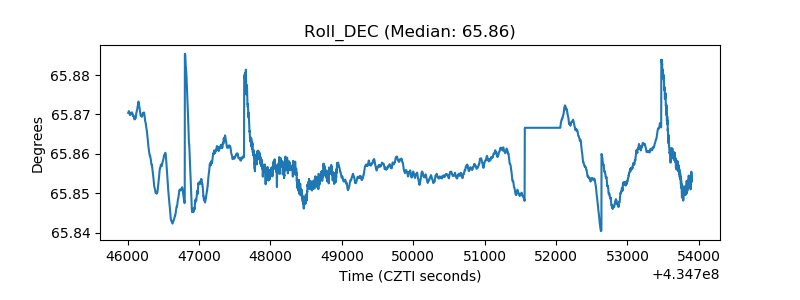 |
| _Roll_RA | 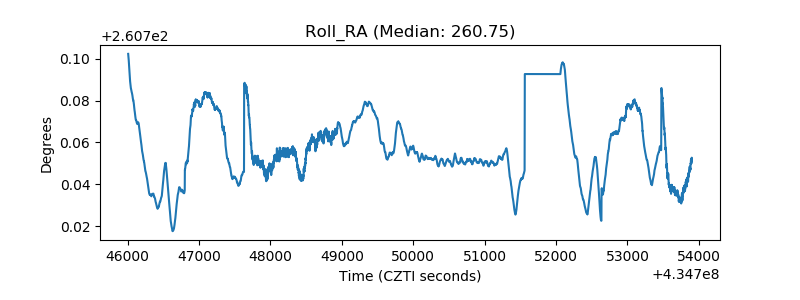 |
| Veto Counter | 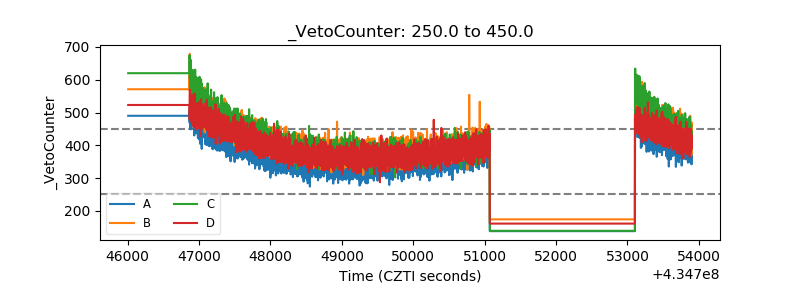 |