| Param | Original file | Final file |
|---|---|---|
| Filename | modeM0/AS1A12_018T01_9000005874_43460cztM0_level2.fits | modeM0/AS1A12_018T01_9000005874_43460cztM0_level2_quad_clean.evt |
| Size (bytes) | 305,061,120 | 87,111,360 |
| Size | 290.9 MB | 83.1 MB |
| Events in quadrant A | 2,894,621 | 581,728 |
| Events in quadrant B | 2,580,683 | 606,682 |
| Events in quadrant C | 2,355,252 | 582,539 |
| Events in quadrant D | 3,072,802 | 516,674 |
| Mode M0 | |||
|---|---|---|---|
| Quadrant | BADHDUFLAG | Total packets | Discarded packets |
| A | 0 | 11649 | 2 |
| B | 0 | 11099 | 9 |
| C | 0 | 10129 | 2 |
| D | 0 | 12652 | 2 |
| Mode M9 | |||
|---|---|---|---|
| Quadrant | BADHDUFLAG | Total packets | Discarded packets |
| A | 0 | 30 | 0 |
| B | 0 | 31 | 0 |
| C | 0 | 31 | 0 |
| D | 0 | 31 | 0 |
| Mode SS | |||
|---|---|---|---|
| Quadrant | BADHDUFLAG | Total packets | Discarded packets |
| A | 0 | 104 | 0 |
| B | 0 | 104 | 0 |
| C | 0 | 104 | 0 |
| D | 0 | 104 | 0 |
| Quadrant | Total seconds | Saturated seconds | Saturation percentage |
|---|---|---|---|
| A | 4990 | 22 | 0.440882% |
| B | 4989 | 33 | 0.661455% |
| C | 4989 | 4 | 0.080176% |
| D | 4989 | 151 | 3.026659% |
Noise dominated data is calculated using 1-second bins in cleaned event files. If a bin has >2000 counts, and if more than 50% of those come from <1% of pixels, then it is considered to be noise-dominated and hence unusable.
| Quadrant | # 1 sec bins | Bins with >0 counts | Bins with >2000 counts | High rate bins dominated by noise | Noise dominated (total time) | Noise dominated (detector-on time) | Marked lightcurve |
|---|---|---|---|---|---|---|---|
| A | 7113 | 4991 | 17 | 17 | 0.24% | 0.34% | 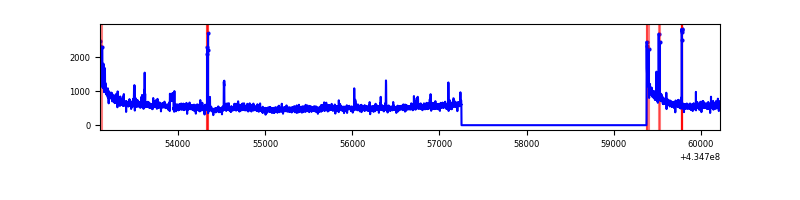 |
| B | 7111 | 4989 | 23 | 23 | 0.32% | 0.46% | 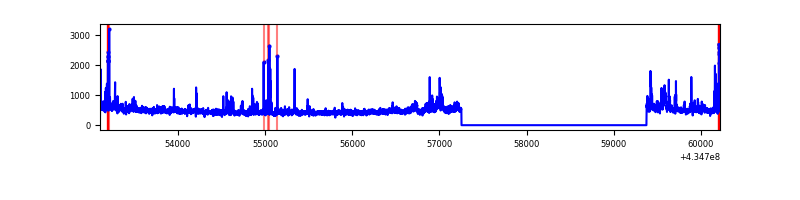 |
| C | 7112 | 4990 | 1 | 1 | 0.01% | 0.02% | 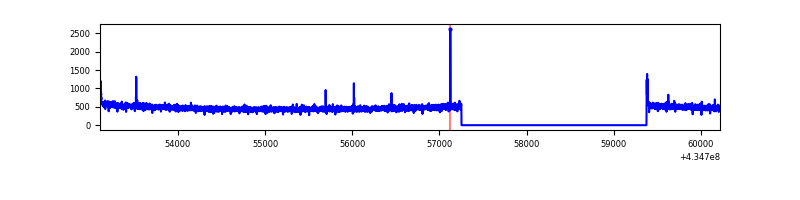 |
| D | 7112 | 4990 | 160 | 160 | 2.25% | 3.21% | 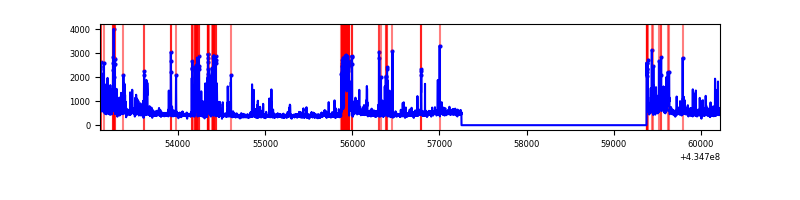 |
Top three noisy pixels from each quadrant. If the there are fewer than three noisy pixels in the level2.evt file, extra rows are filled as -1
| Pixel properties | Quadrant properties | ||||||
|---|---|---|---|---|---|---|---|
| Quadrant | DetID | PixID | Counts | Sigma | Mean | Median | Sigma |
| A | 10 | 83 | 551302 | 4998.09 | 540 | 529 | 110.2 |
| A | 15 | 222 | 173793 | 1572.31 | 540 | 529 | 110.2 |
| A | 15 | 237 | 53703 | 482.54 | 540 | 529 | 110.2 |
| B | 0 | 245 | 162826 | 1568.14 | 546 | 533 | 103.5 |
| B | 0 | 189 | 127666 | 1228.41 | 546 | 533 | 103.5 |
| B | 0 | 199 | 99487 | 956.13 | 546 | 533 | 103.5 |
| C | 15 | 214 | 219878 | 1743.64 | 538 | 543 | 125.8 |
| C | 3 | 233 | 29442 | 229.74 | 538 | 543 | 125.8 |
| C | 15 | 159 | 3688 | 25.0 | 538 | 543 | 125.8 |
| D | 13 | 249 | 469531 | 3648.5 | 524 | 510 | 128.6 |
| D | 1 | 52 | 303028 | 2353.28 | 524 | 510 | 128.6 |
| D | 7 | 96 | 90156 | 697.35 | 524 | 510 | 128.6 |
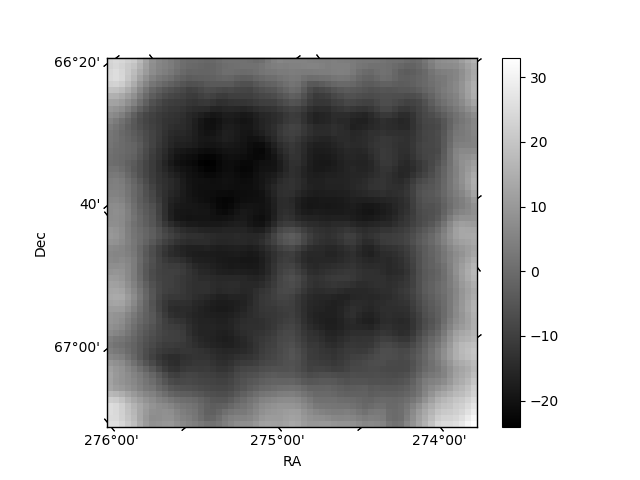
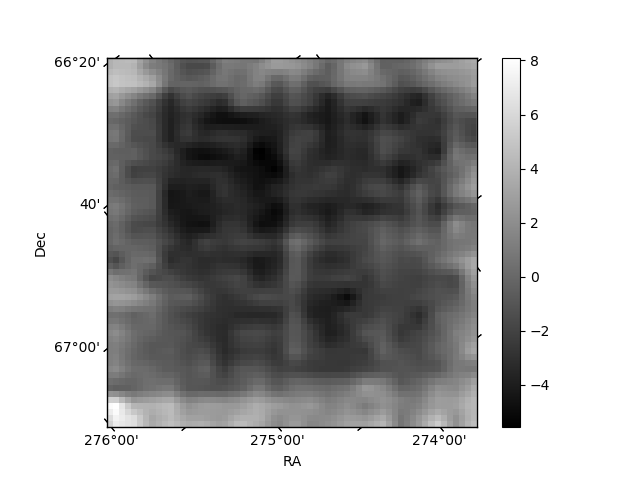
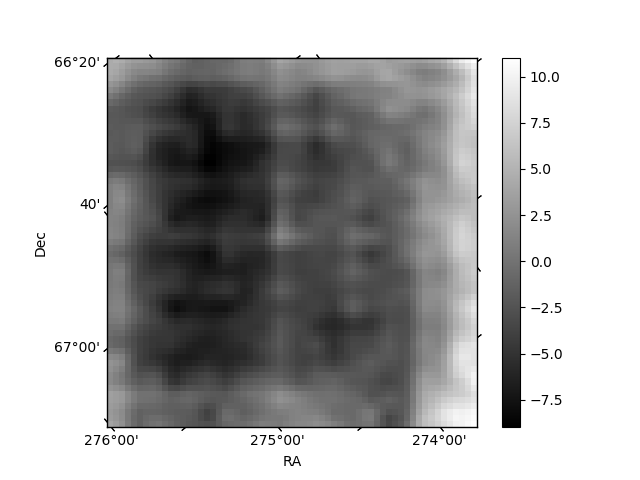
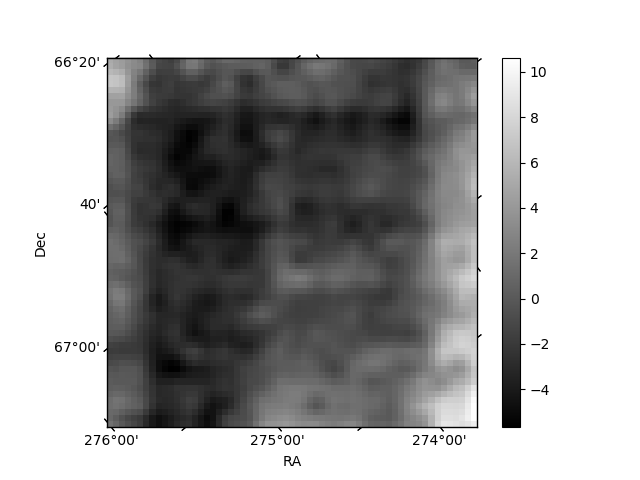
Histogram calculated using DETX and DETY for each event in the final _common_clean file
| Quadrant A | 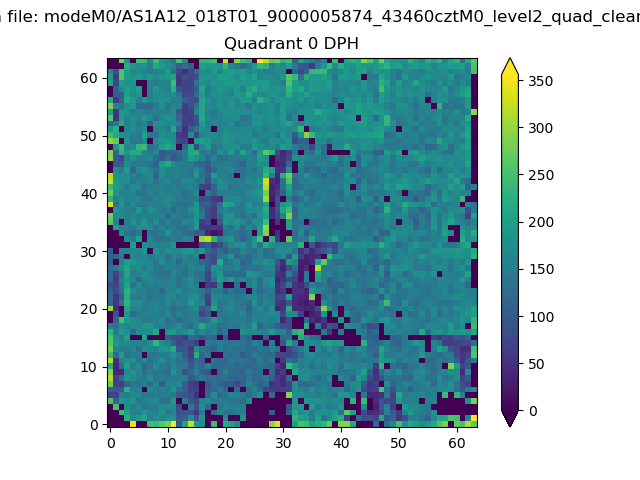 |
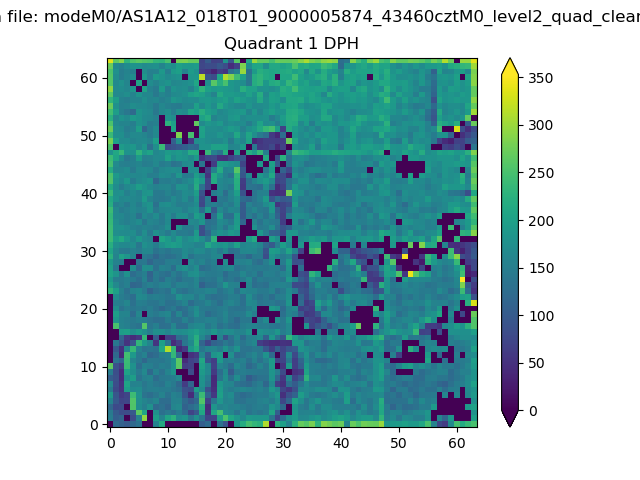 |
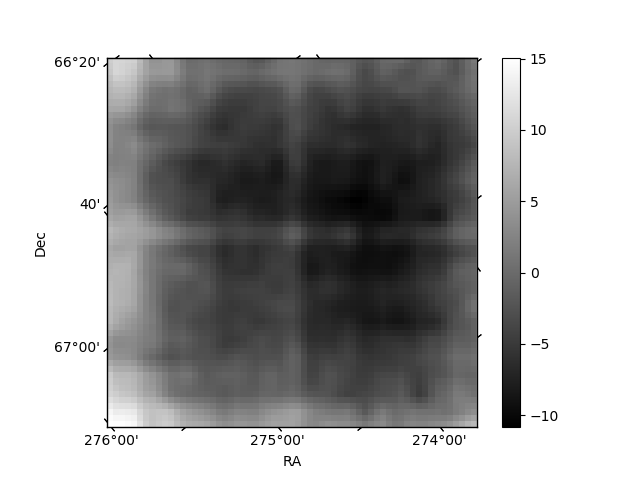
Quadrant B |
|---|---|---|---|
| Quadrant D | 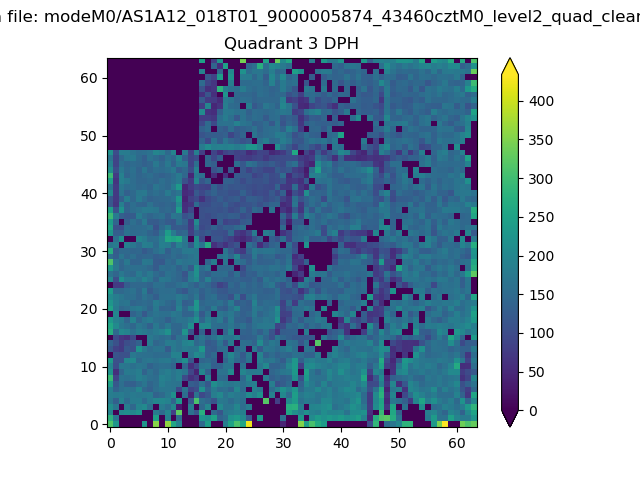 |
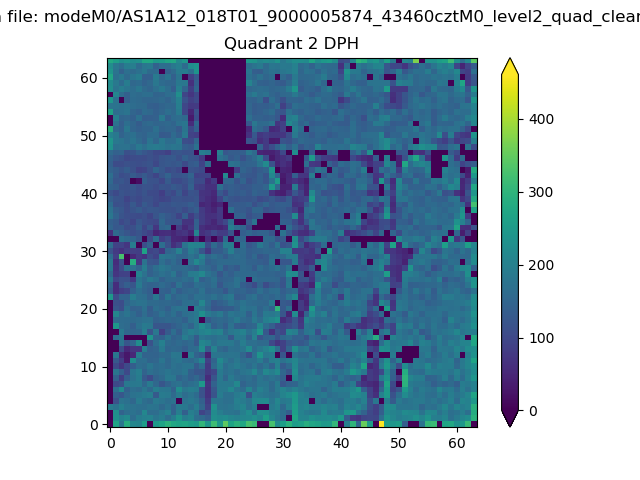 |
Quadrant C |
| Plot type | Count rate plots | Images |
|---|---|---|
| Comparison with Poisson distribution Blue bars denote a histogram of data divided into 1 sec bins. Red curve is a Poisson curve with rate = median count rate of data. |
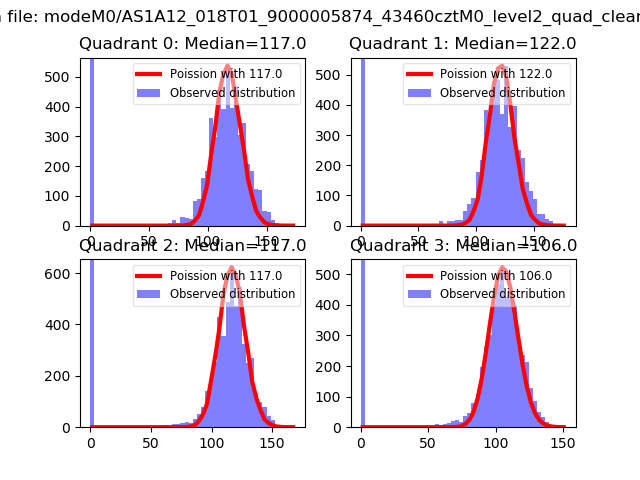 |
 |
| Quadrant-wise count rates Data is divided into 100 sec bins |
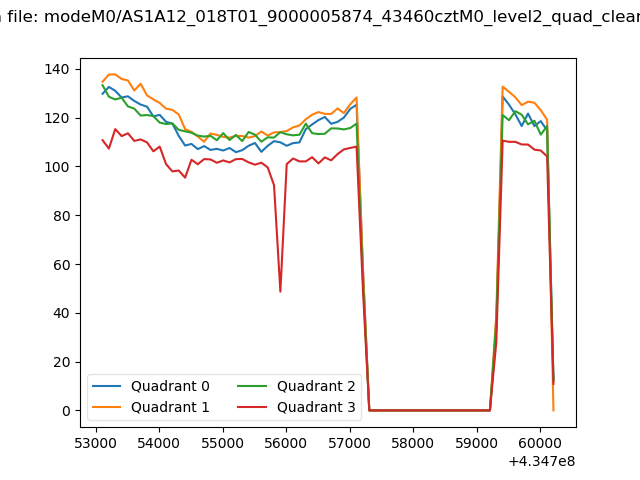 |
|
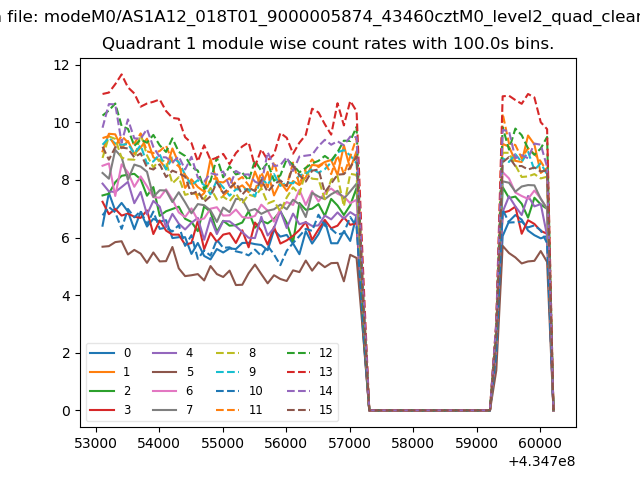
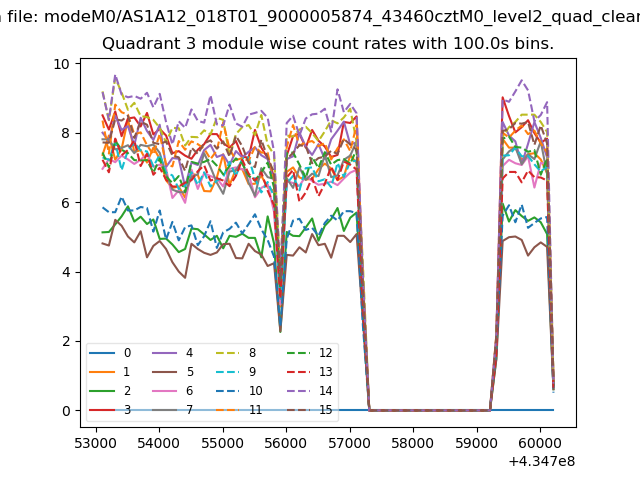
| Module-wise count rates for Quadrant A Data is divided into 100 sec bins |
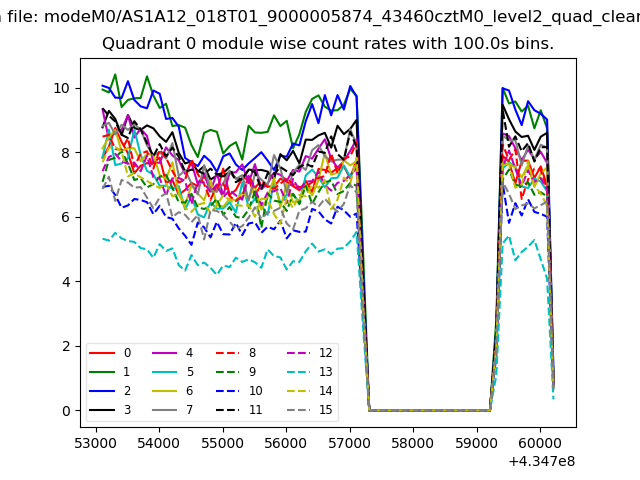 |
 |
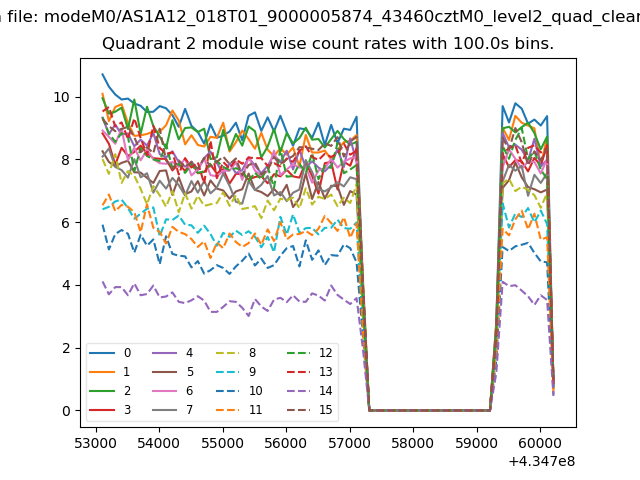
| Module-wise count rates for Quadrant B Data is divided into 100 sec bins |
 |
 |
| Module-wise count rates for Quadrant C Data is divided into 100 sec bins |
 |
 |
| Module-wise count rates for Quadrant D Data is divided into 100 sec bins |
 |
 |
| Parameter | Plot |
|---|---|
| CZT HV Monitor | 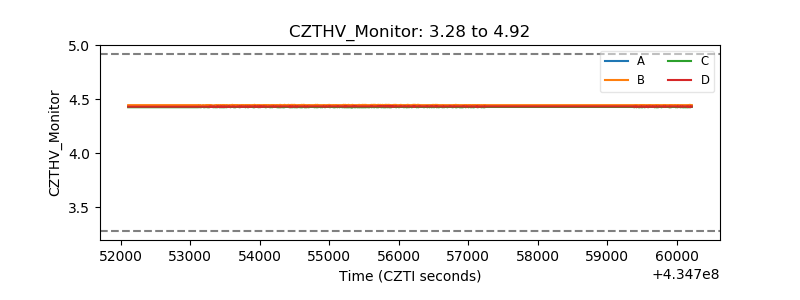 |
| D_VDD | 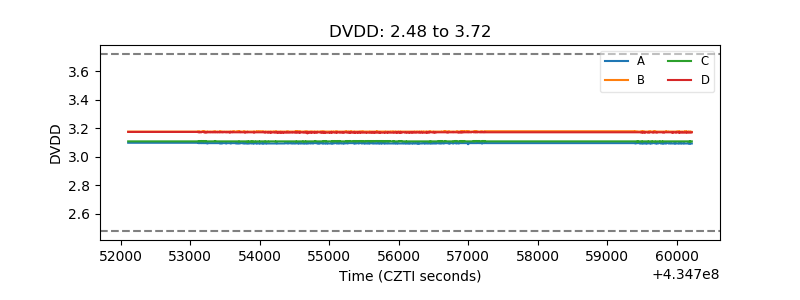 |
| Temperature 1 | 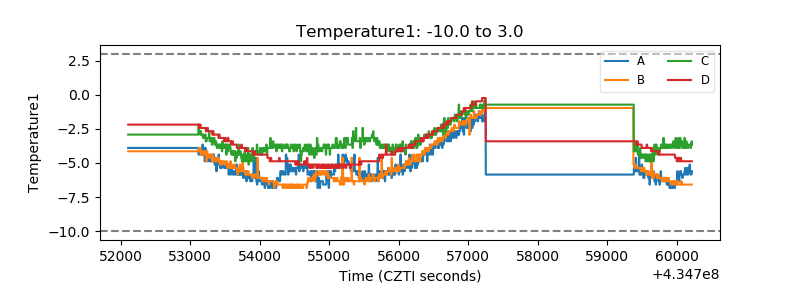 |
| Veto HV Monitor | 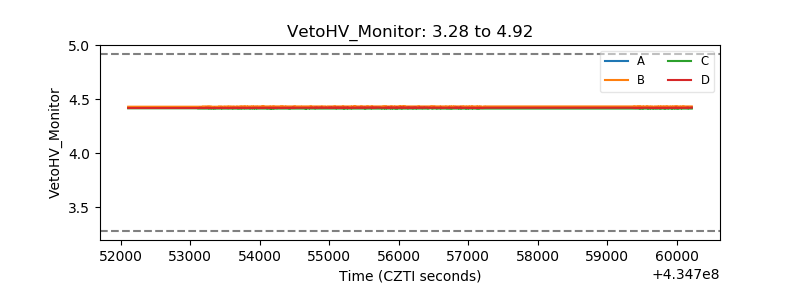 |
| Veto LLD | 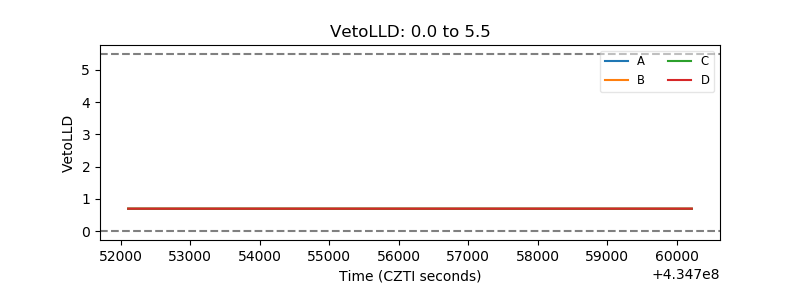 |
| Alpha Counter | 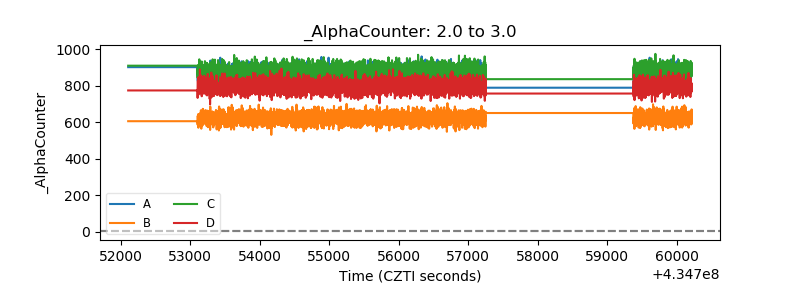 |
| _CPM_Rate | 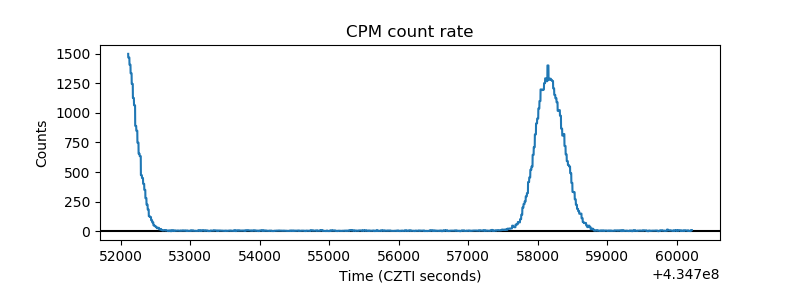 |
| CZT Counter | 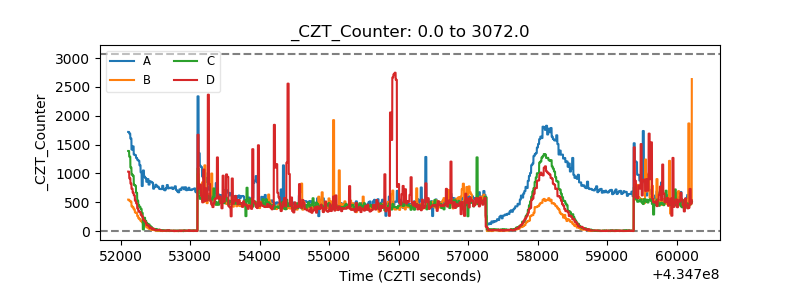 |
| +2.5 Volts monitor | 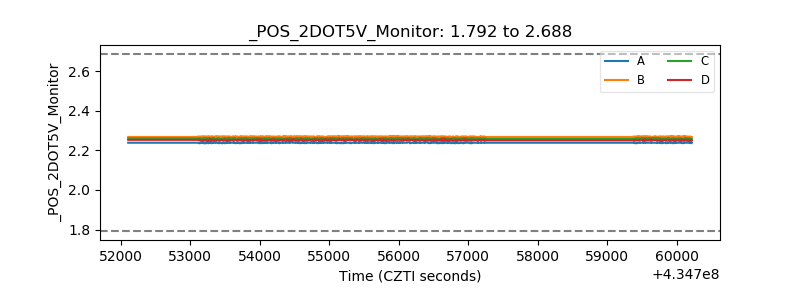 |
| +5 Volts monitor | 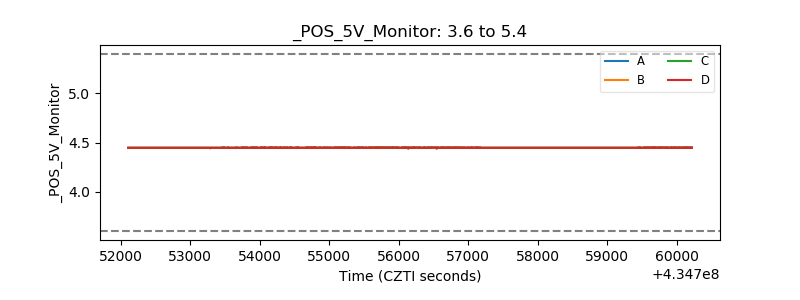 |
| _ROLL_ROT |  |
| _Roll_DEC | 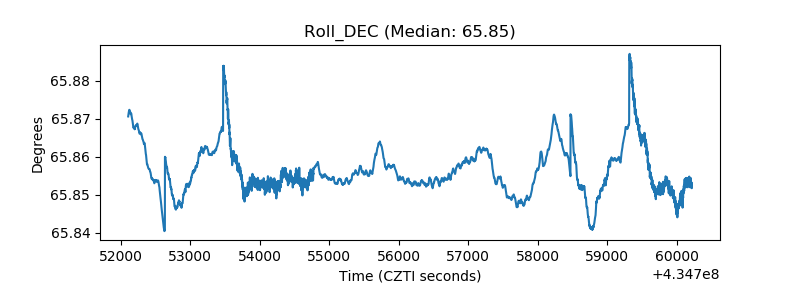 |
| _Roll_RA | 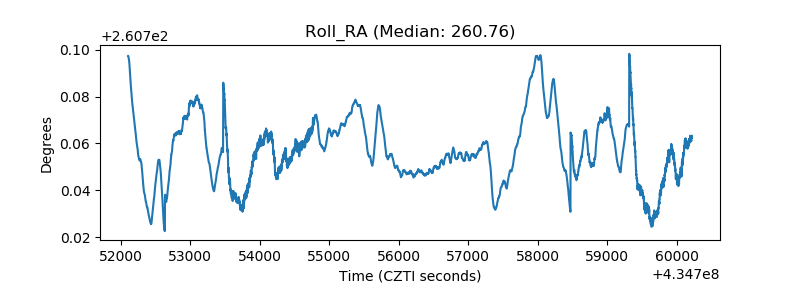 |
| Veto Counter | 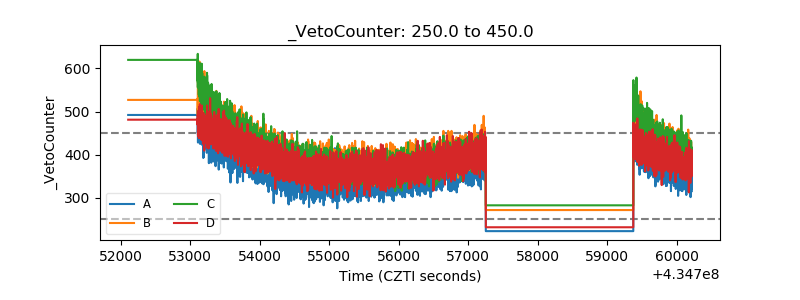 |