| Param | Original file | Final file |
|---|---|---|
| Filename | modeM0/AS1A12_018T01_9000005874_43461cztM0_level2.fits | modeM0/AS1A12_018T01_9000005874_43461cztM0_level2_quad_clean.evt |
| Size (bytes) | 330,652,800 | 87,076,800 |
| Size | 315.3 MB | 83.0 MB |
| Events in quadrant A | 3,341,019 | 577,228 |
| Events in quadrant B | 3,093,278 | 593,019 |
| Events in quadrant C | 2,380,413 | 580,582 |
| Events in quadrant D | 3,021,397 | 522,772 |
| Mode M0 | |||
|---|---|---|---|
| Quadrant | BADHDUFLAG | Total packets | Discarded packets |
| A | 0 | 13363 | 2 |
| B | 0 | 12749 | 2 |
| C | 0 | 10481 | 2 |
| D | 0 | 12703 | 2 |
| Mode M9 | |||
|---|---|---|---|
| Quadrant | BADHDUFLAG | Total packets | Discarded packets |
| A | 0 | 31 | 0 |
| B | 0 | 32 | 0 |
| C | 0 | 32 | 0 |
| D | 0 | 32 | 0 |
| Mode SS | |||
|---|---|---|---|
| Quadrant | BADHDUFLAG | Total packets | Discarded packets |
| A | 0 | 106 | 0 |
| B | 0 | 106 | 0 |
| C | 0 | 106 | 0 |
| D | 0 | 106 | 0 |
| Quadrant | Total seconds | Saturated seconds | Saturation percentage |
|---|---|---|---|
| A | 5181 | 58 | 1.119475% |
| B | 5181 | 139 | 2.682880% |
| C | 5181 | 3 | 0.057904% |
| D | 5181 | 85 | 1.640610% |
Noise dominated data is calculated using 1-second bins in cleaned event files. If a bin has >2000 counts, and if more than 50% of those come from <1% of pixels, then it is considered to be noise-dominated and hence unusable.
| Quadrant | # 1 sec bins | Bins with >0 counts | Bins with >2000 counts | High rate bins dominated by noise | Noise dominated (total time) | Noise dominated (detector-on time) | Marked lightcurve |
|---|---|---|---|---|---|---|---|
| A | 7304 | 5182 | 41 | 41 | 0.56% | 0.79% | 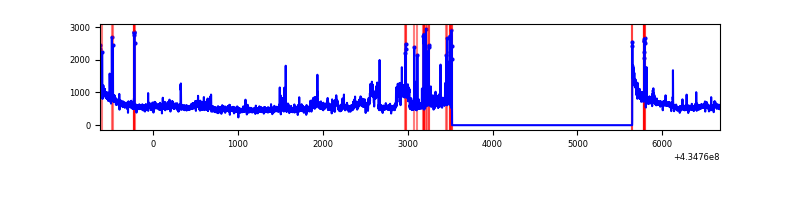 |
| B | 7304 | 5182 | 105 | 105 | 1.44% | 2.03% | 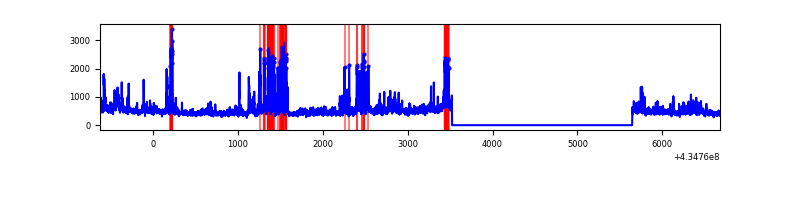 |
| C | 7304 | 5182 | 1 | 1 | 0.01% | 0.02% | 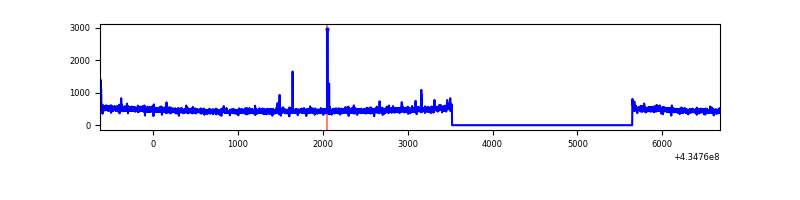 |
| D | 7304 | 5182 | 97 | 97 | 1.33% | 1.87% | 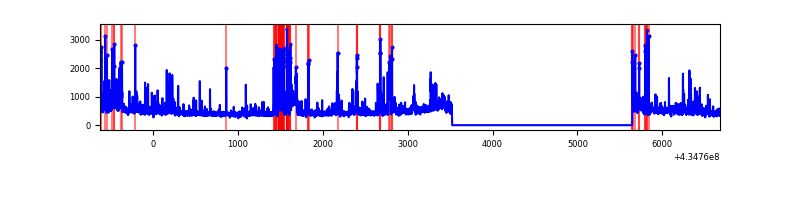 |
Top three noisy pixels from each quadrant. If the there are fewer than three noisy pixels in the level2.evt file, extra rows are filled as -1
| Pixel properties | Quadrant properties | ||||||
|---|---|---|---|---|---|---|---|
| Quadrant | DetID | PixID | Counts | Sigma | Mean | Median | Sigma |
| A | 10 | 83 | 572325 | 5056.75 | 548 | 537 | 113.1 |
| A | 15 | 237 | 333210 | 2942.08 | 548 | 537 | 113.1 |
| A | 15 | 222 | 286540 | 2529.34 | 548 | 537 | 113.1 |
| B | 0 | 189 | 568518 | 5387.86 | 550 | 535 | 105.4 |
| B | 0 | 199 | 169745 | 1605.12 | 550 | 535 | 105.4 |
| B | 0 | 245 | 165731 | 1567.04 | 550 | 535 | 105.4 |
| C | 15 | 214 | 228989 | 1795.96 | 543 | 547 | 127.2 |
| C | 3 | 233 | 17391 | 132.42 | 543 | 547 | 127.2 |
| C | 14 | 254 | 10163 | 75.6 | 543 | 547 | 127.2 |
| D | 1 | 52 | 416152 | 3218.73 | 532 | 517 | 129.1 |
| D | 13 | 249 | 318779 | 2464.66 | 532 | 517 | 129.1 |
| D | 7 | 96 | 60151 | 461.81 | 532 | 517 | 129.1 |
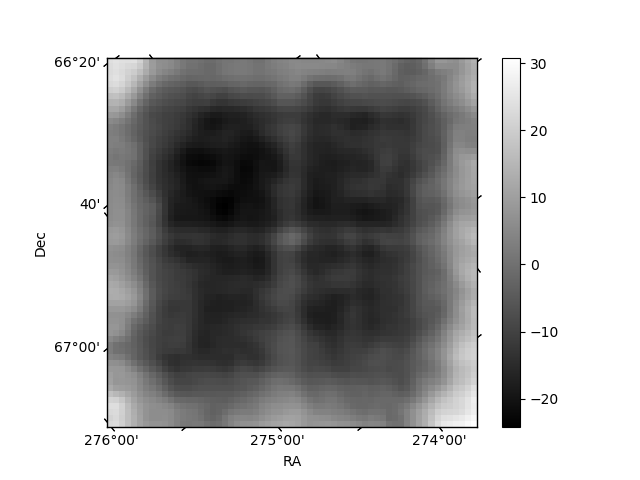
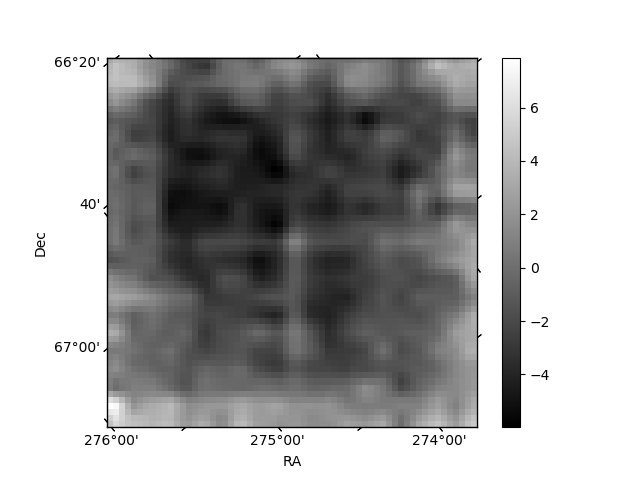
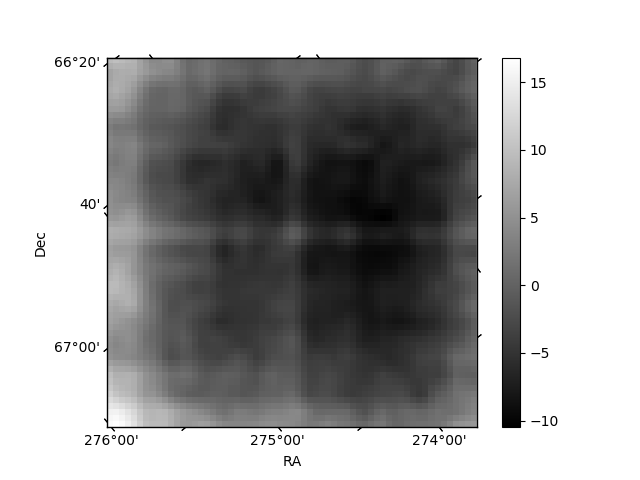
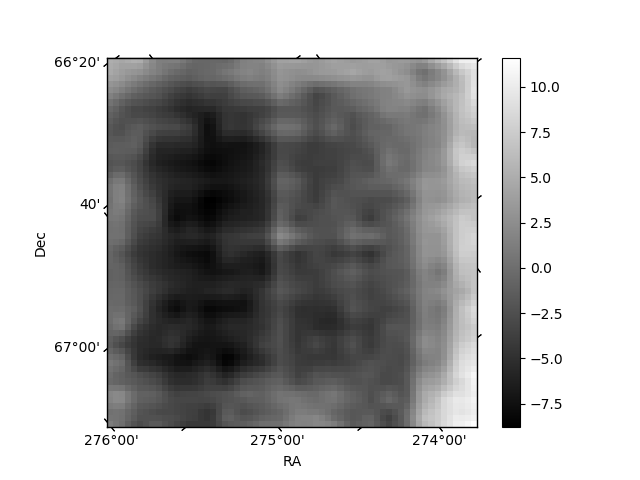
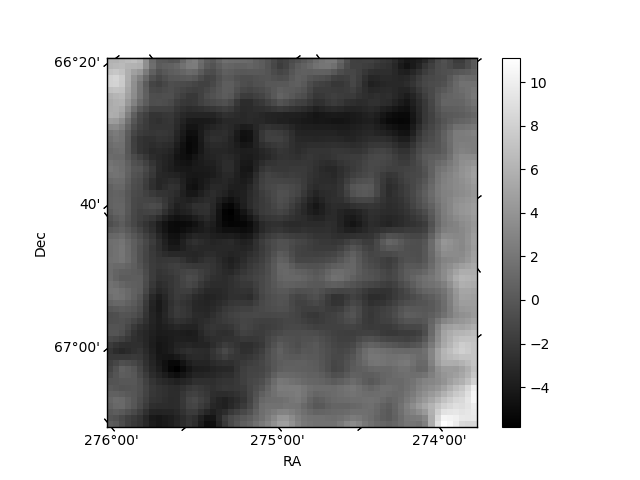
Histogram calculated using DETX and DETY for each event in the final _common_clean file
| Quadrant A | 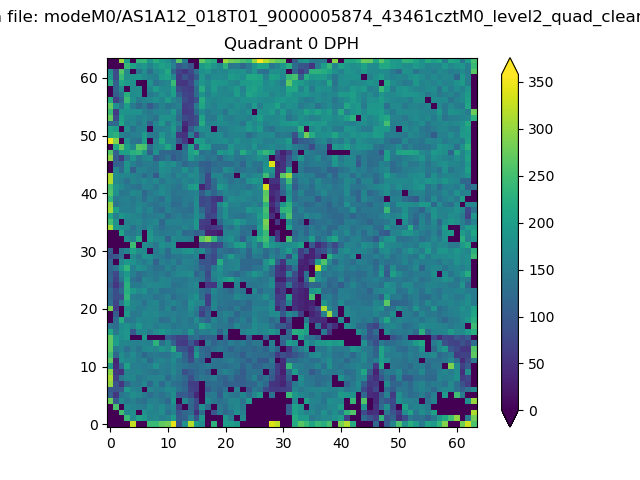 |
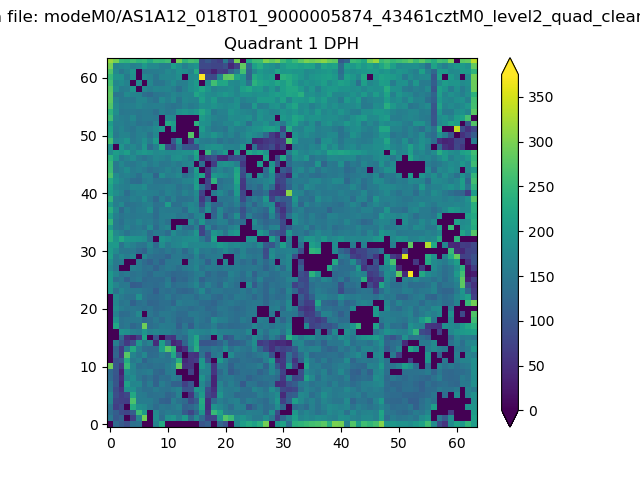 |
Quadrant B |
|---|---|---|---|
| Quadrant D | 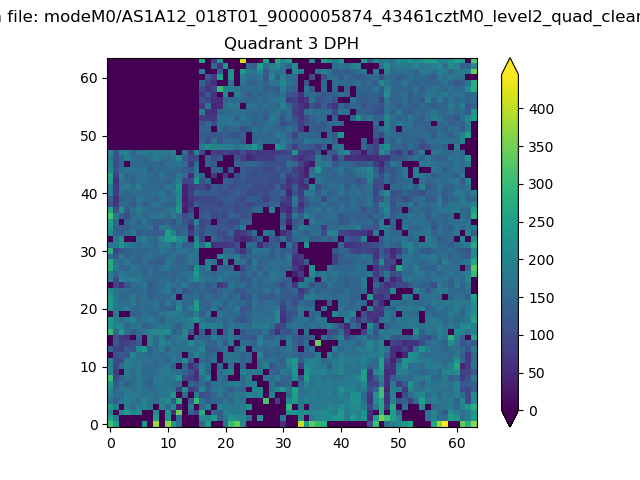 |
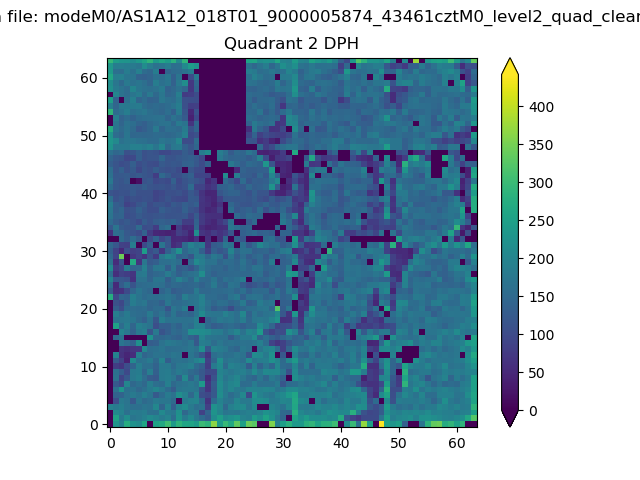 |
Quadrant C |
| Plot type | Count rate plots | Images |
|---|---|---|
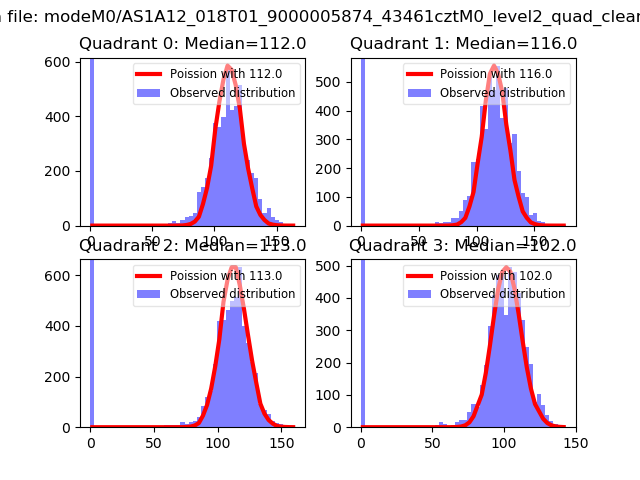
| Comparison with Poisson distribution Blue bars denote a histogram of data divided into 1 sec bins. Red curve is a Poisson curve with rate = median count rate of data. |
 |
 |
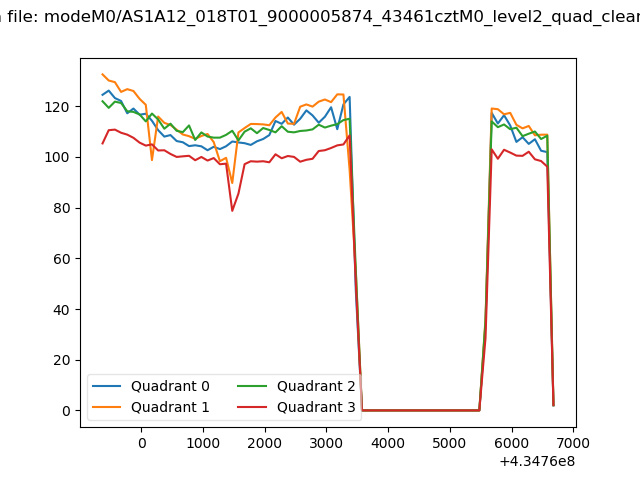
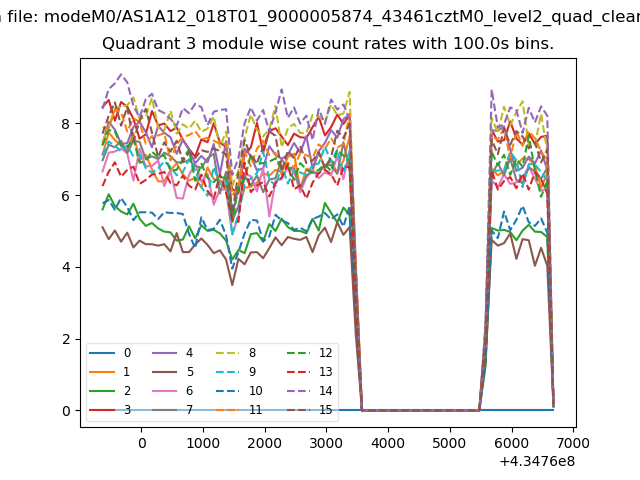
| Quadrant-wise count rates Data is divided into 100 sec bins |
 |
|
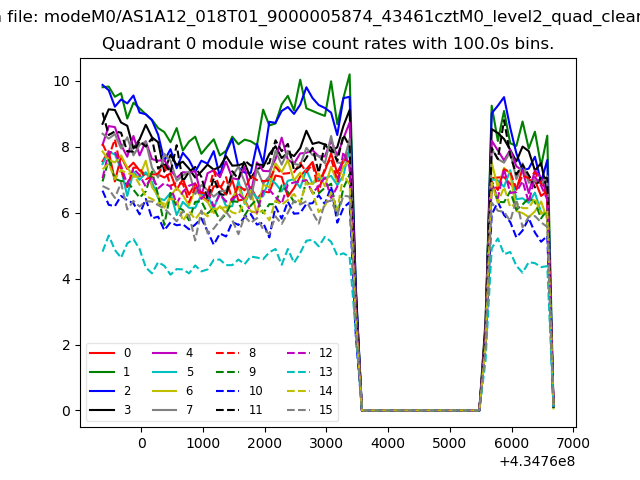
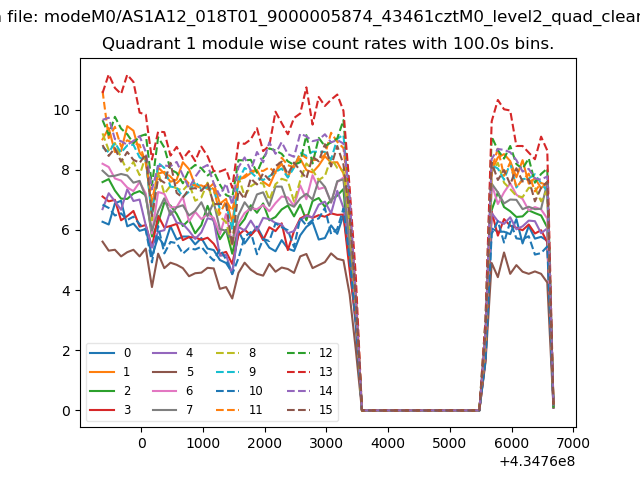
| Module-wise count rates for Quadrant A Data is divided into 100 sec bins |
 |
 |
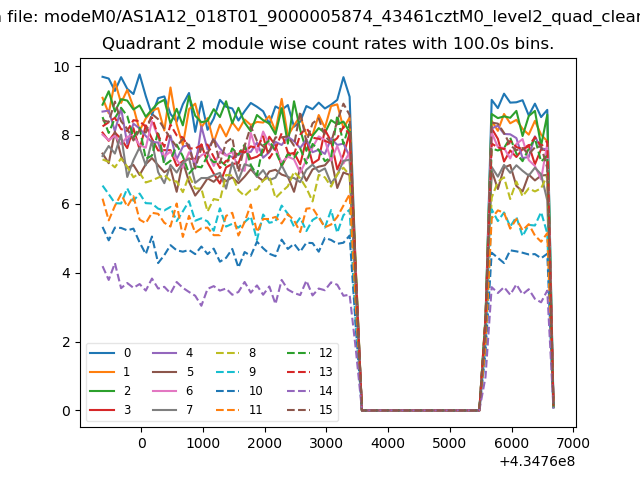
| Module-wise count rates for Quadrant B Data is divided into 100 sec bins |
 |
 |
| Module-wise count rates for Quadrant C Data is divided into 100 sec bins |
 |
 |
| Module-wise count rates for Quadrant D Data is divided into 100 sec bins |
 |
 |
| Parameter | Plot |
|---|---|
| CZT HV Monitor | 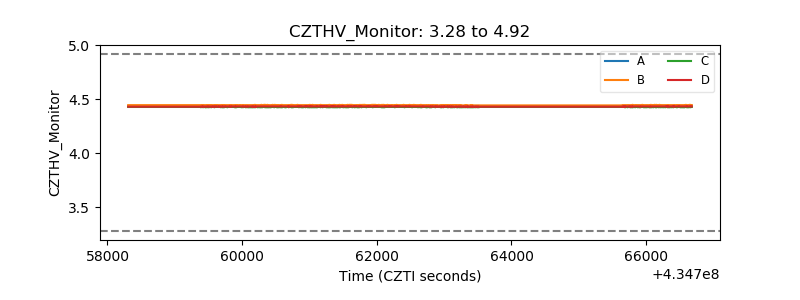 |
| D_VDD | 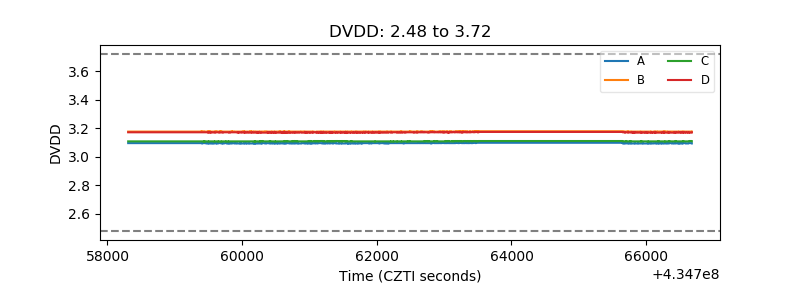 |
| Temperature 1 | 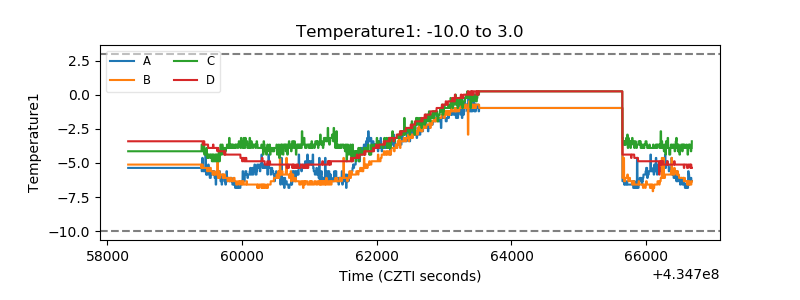 |
| Veto HV Monitor | 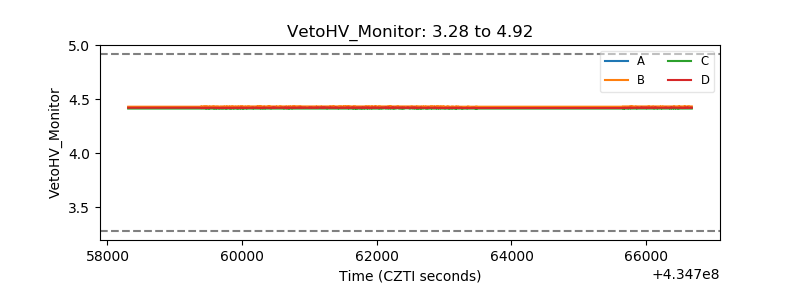 |
| Veto LLD | 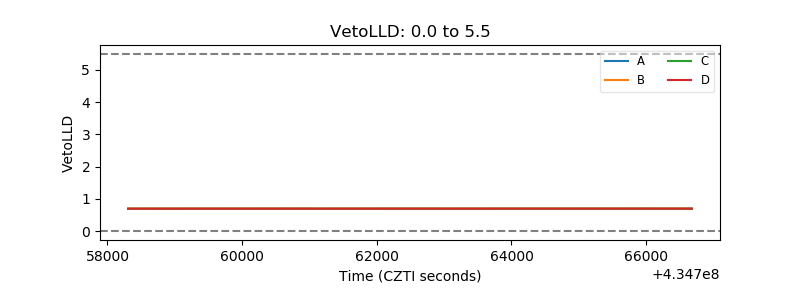 |
| Alpha Counter | 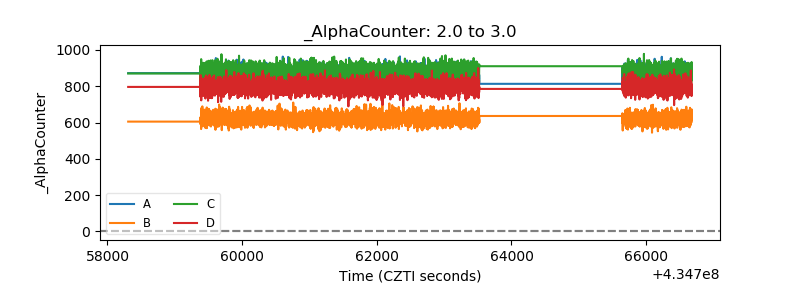 |
| _CPM_Rate | 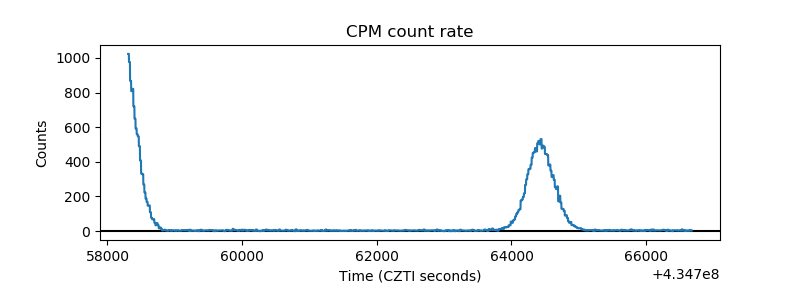 |
| CZT Counter | 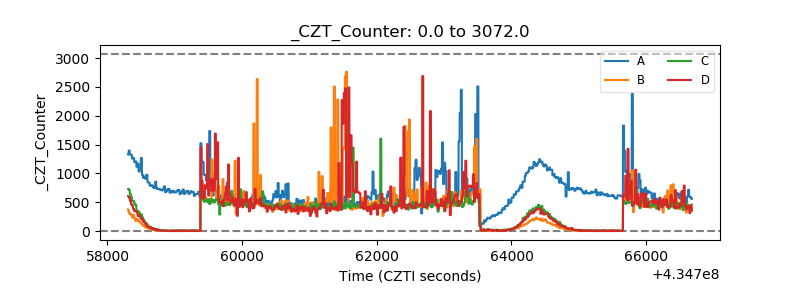 |
| +2.5 Volts monitor |  |
| +5 Volts monitor | 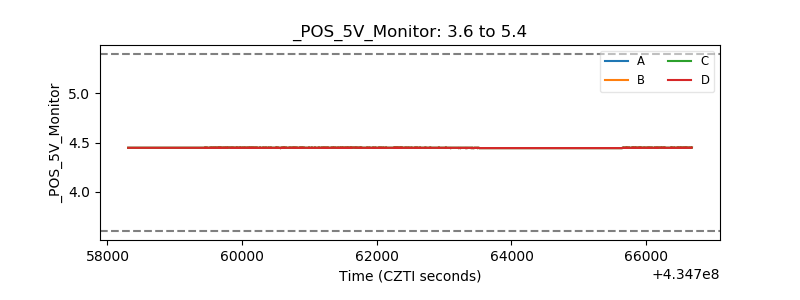 |
| _ROLL_ROT | 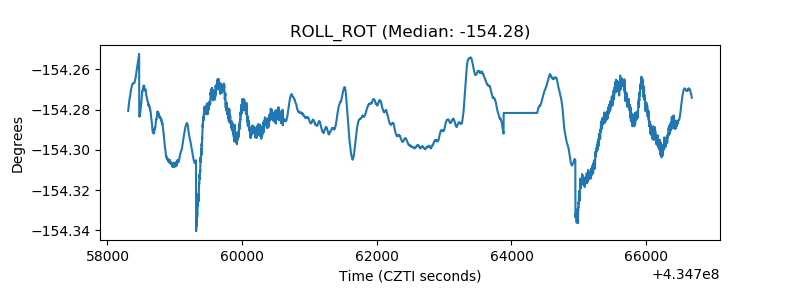 |
| _Roll_DEC | 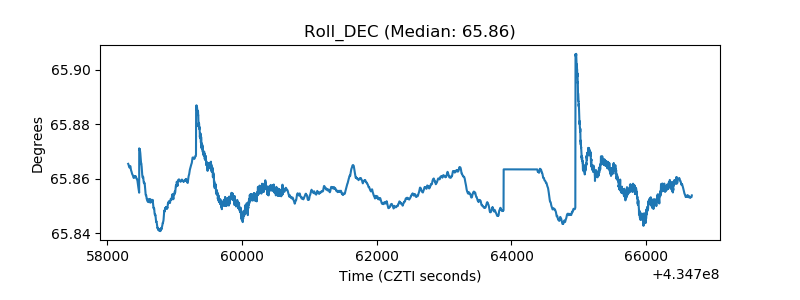 |
| _Roll_RA | 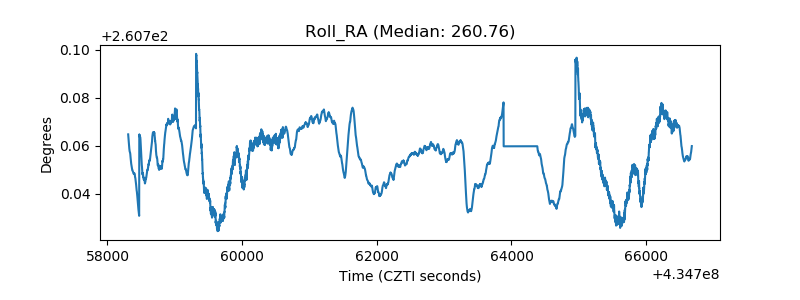 |
| Veto Counter | 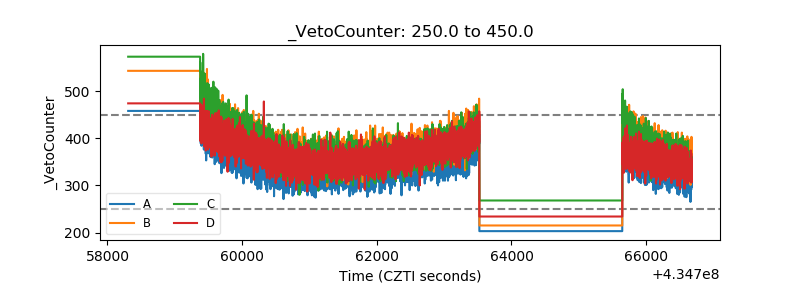 |