| Param | Original file | Final file |
|---|---|---|
| Filename | modeM0/AS1A12_018T01_9000005874_43462cztM0_level2.fits | modeM0/AS1A12_018T01_9000005874_43462cztM0_level2_quad_clean.evt |
| Size (bytes) | 322,191,360 | 85,173,120 |
| Size | 307.3 MB | 81.2 MB |
| Events in quadrant A | 3,369,430 | 557,117 |
| Events in quadrant B | 2,725,877 | 586,572 |
| Events in quadrant C | 2,354,893 | 565,171 |
| Events in quadrant D | 3,066,182 | 501,694 |
| Mode M0 | |||
|---|---|---|---|
| Quadrant | BADHDUFLAG | Total packets | Discarded packets |
| A | 0 | 13338 | 2 |
| B | 0 | 11704 | 2 |
| C | 0 | 10571 | 2 |
| D | 0 | 13061 | 2 |
| Mode M9 | |||
|---|---|---|---|
| Quadrant | BADHDUFLAG | Total packets | Discarded packets |
| A | 0 | 32 | 0 |
| B | 0 | 33 | 0 |
| C | 0 | 33 | 0 |
| D | 0 | 33 | 0 |
| Mode SS | |||
|---|---|---|---|
| Quadrant | BADHDUFLAG | Total packets | Discarded packets |
| A | 0 | 108 | 0 |
| B | 0 | 108 | 0 |
| C | 0 | 108 | 0 |
| D | 0 | 108 | 0 |
| Quadrant | Total seconds | Saturated seconds | Saturation percentage |
|---|---|---|---|
| A | 5260 | 122 | 2.319392% |
| B | 5259 | 22 | 0.418330% |
| C | 5259 | 3 | 0.057045% |
| D | 5259 | 176 | 3.346644% |
Noise dominated data is calculated using 1-second bins in cleaned event files. If a bin has >2000 counts, and if more than 50% of those come from <1% of pixels, then it is considered to be noise-dominated and hence unusable.
| Quadrant | # 1 sec bins | Bins with >0 counts | Bins with >2000 counts | High rate bins dominated by noise | Noise dominated (total time) | Noise dominated (detector-on time) | Marked lightcurve |
|---|---|---|---|---|---|---|---|
| A | 7263 | 5261 | 107 | 107 | 1.47% | 2.03% | 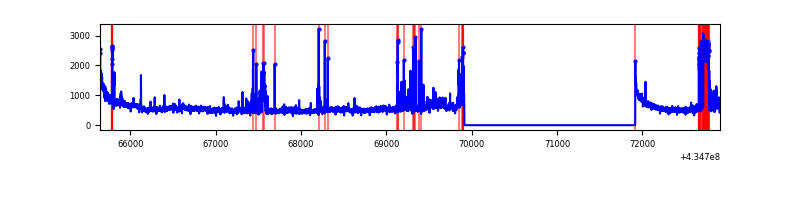 |
| B | 7262 | 5260 | 13 | 13 | 0.18% | 0.25% | 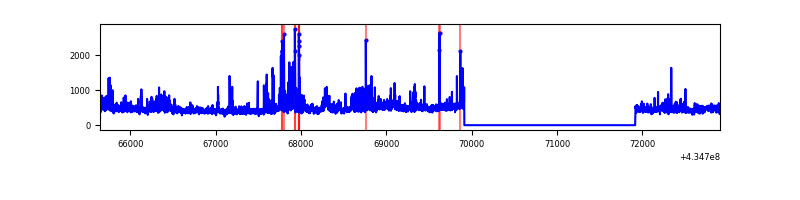 |
| C | 7262 | 5260 | 0 | 0 | 0.00% | 0.00% | 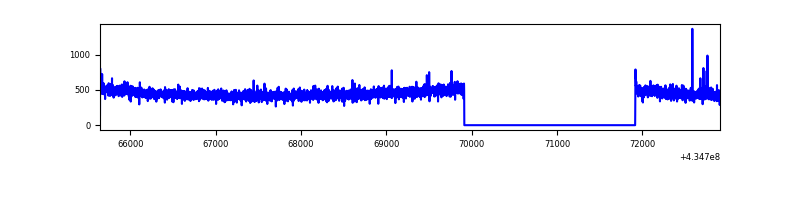 |
| D | 7262 | 5260 | 157 | 157 | 2.16% | 2.98% | 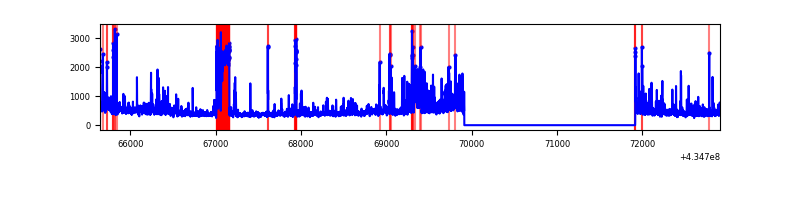 |
Top three noisy pixels from each quadrant. If the there are fewer than three noisy pixels in the level2.evt file, extra rows are filled as -1
| Pixel properties | Quadrant properties | ||||||
|---|---|---|---|---|---|---|---|
| Quadrant | DetID | PixID | Counts | Sigma | Mean | Median | Sigma |
| A | 10 | 83 | 568162 | 5025.87 | 546 | 534 | 112.9 |
| A | 15 | 237 | 459806 | 4066.46 | 546 | 534 | 112.9 |
| A | 15 | 222 | 204529 | 1806.2 | 546 | 534 | 112.9 |
| B | 0 | 199 | 219921 | 2048.25 | 551 | 535 | 107.1 |
| B | 0 | 189 | 211068 | 1965.59 | 551 | 535 | 107.1 |
| B | 0 | 245 | 63726 | 589.97 | 551 | 535 | 107.1 |
| C | 15 | 214 | 232465 | 1835.33 | 540 | 541 | 126.4 |
| C | 3 | 233 | 8798 | 65.34 | 540 | 541 | 126.4 |
| C | 14 | 254 | 6489 | 47.07 | 540 | 541 | 126.4 |
| D | 13 | 249 | 360105 | 2776.76 | 526 | 509 | 129.5 |
| D | 1 | 52 | 318821 | 2457.97 | 526 | 509 | 129.5 |
| D | 9 | 49 | 213868 | 1647.54 | 526 | 509 | 129.5 |
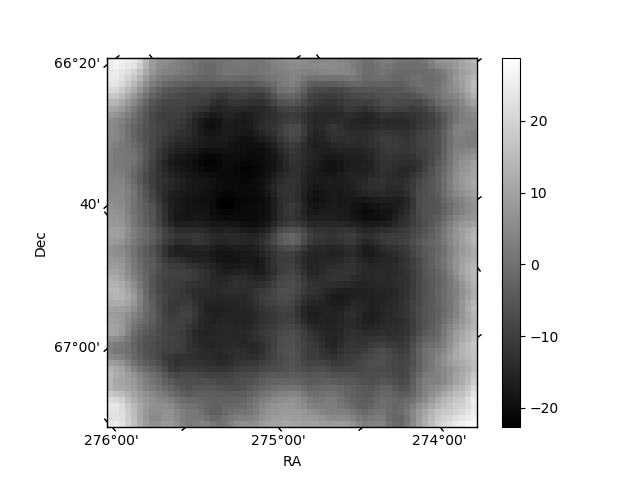
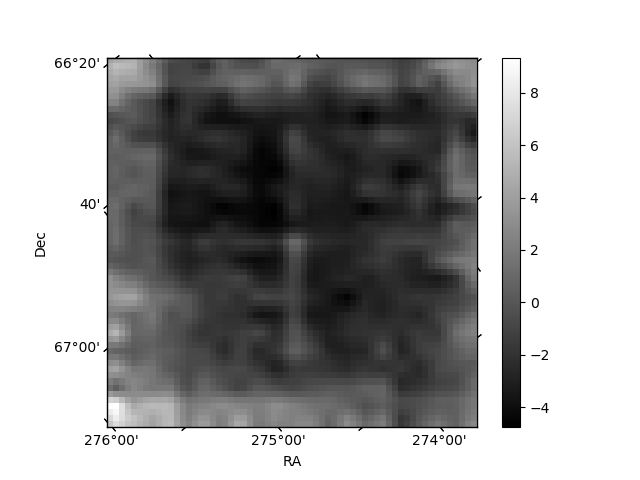
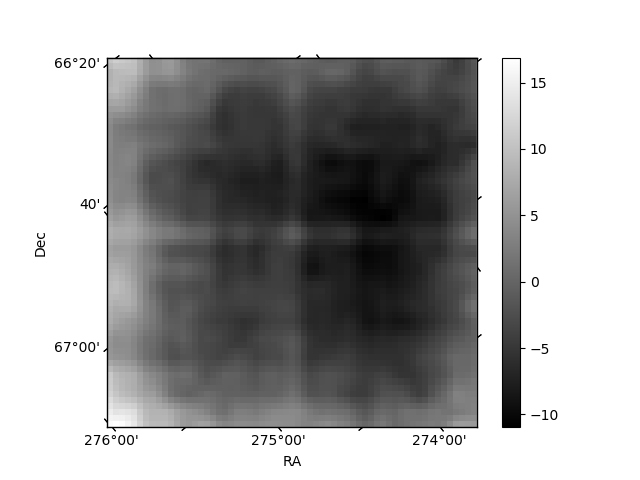
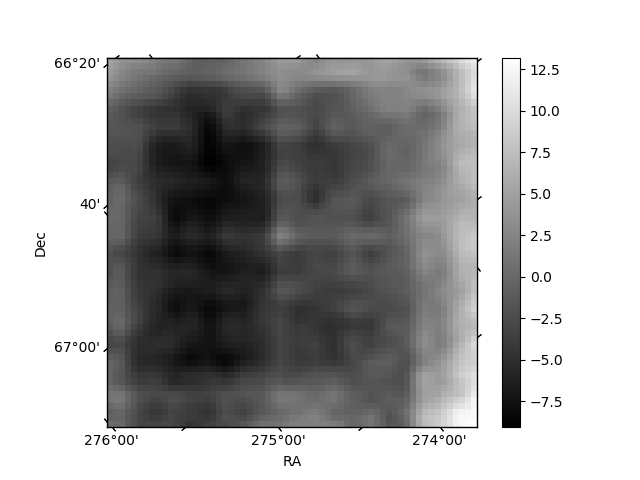
Histogram calculated using DETX and DETY for each event in the final _common_clean file
| Quadrant A | 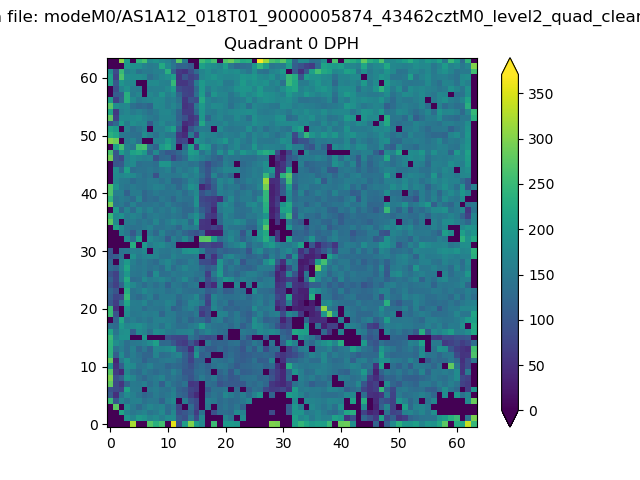 |
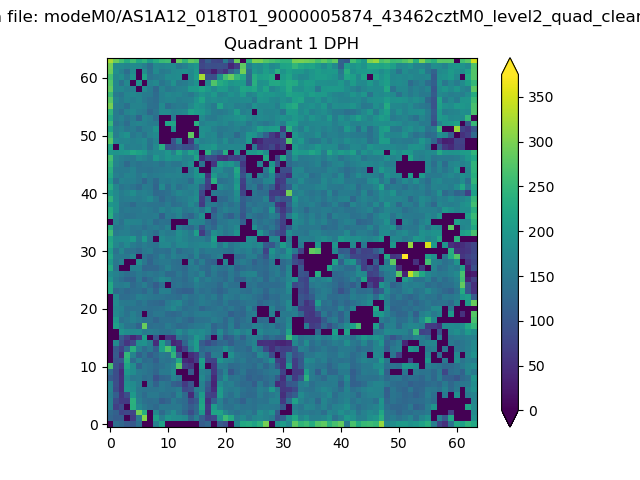 |
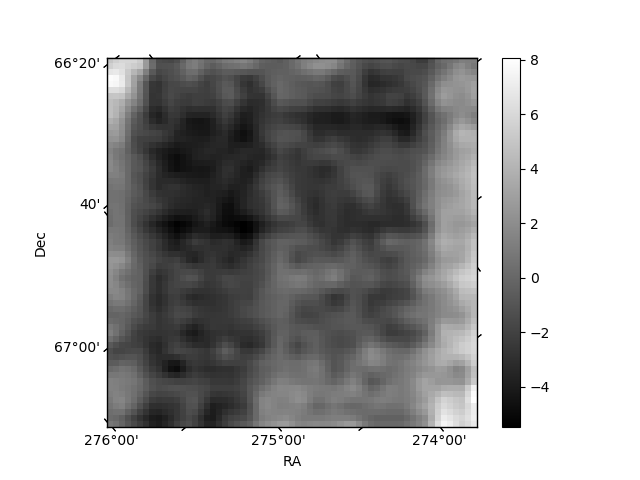
Quadrant B |
|---|---|---|---|
| Quadrant D | 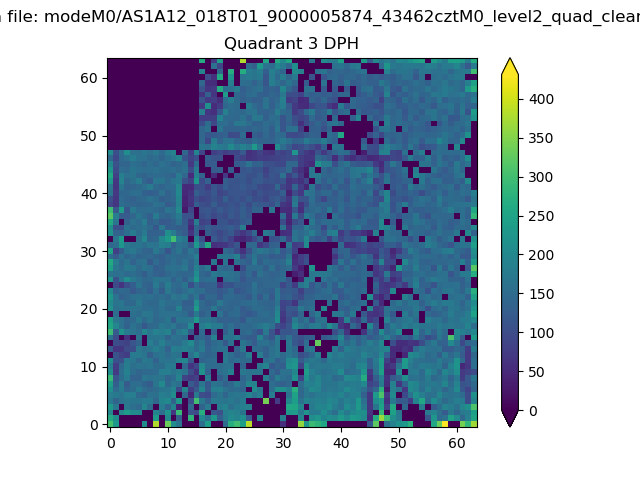 |
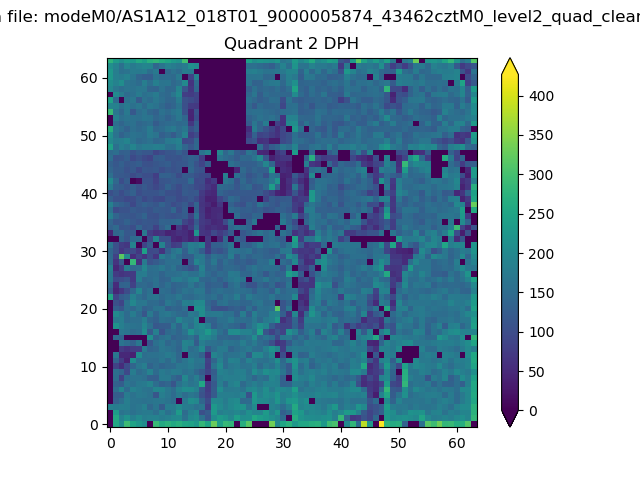 |
Quadrant C |
| Plot type | Count rate plots | Images |
|---|---|---|
| Comparison with Poisson distribution Blue bars denote a histogram of data divided into 1 sec bins. Red curve is a Poisson curve with rate = median count rate of data. |
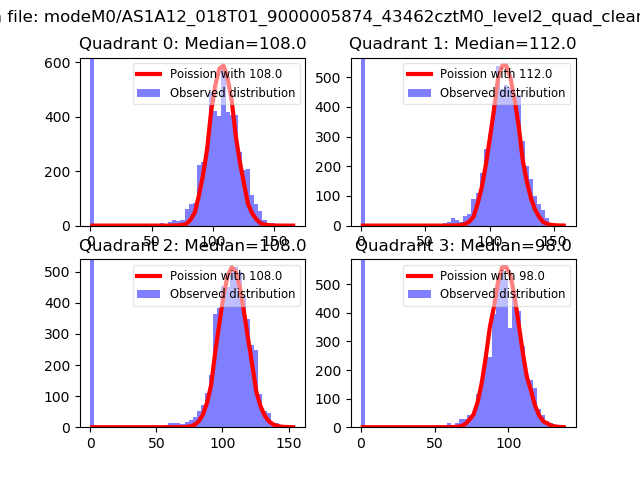 |
 |
| Quadrant-wise count rates Data is divided into 100 sec bins |
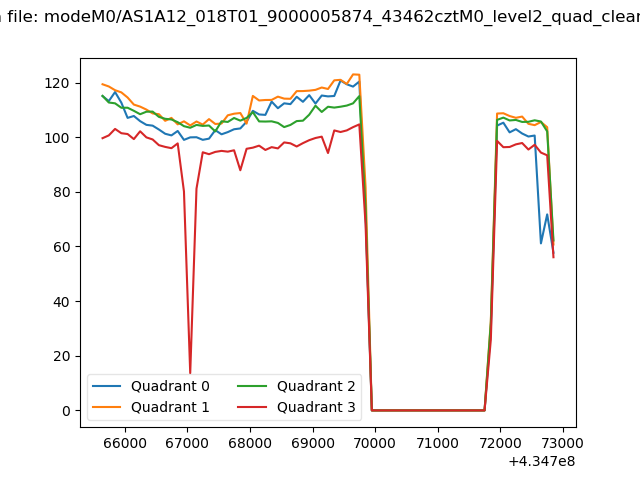 |
|
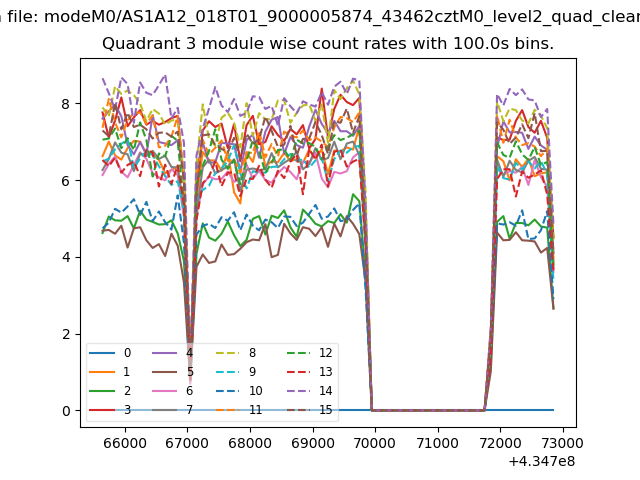
| Module-wise count rates for Quadrant A Data is divided into 100 sec bins |
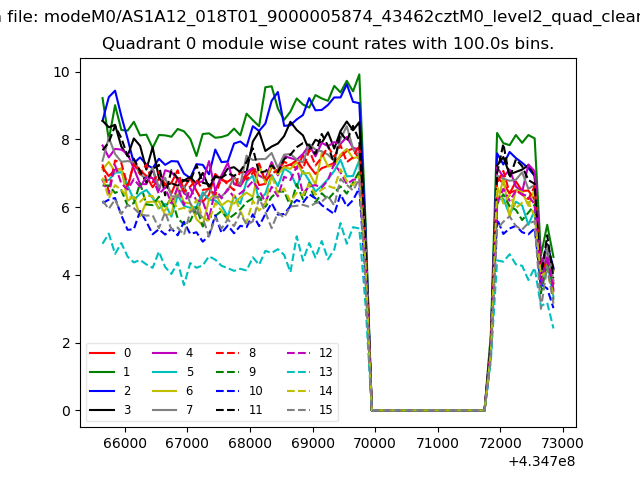 |
 |
| Module-wise count rates for Quadrant B Data is divided into 100 sec bins |
 |
 |
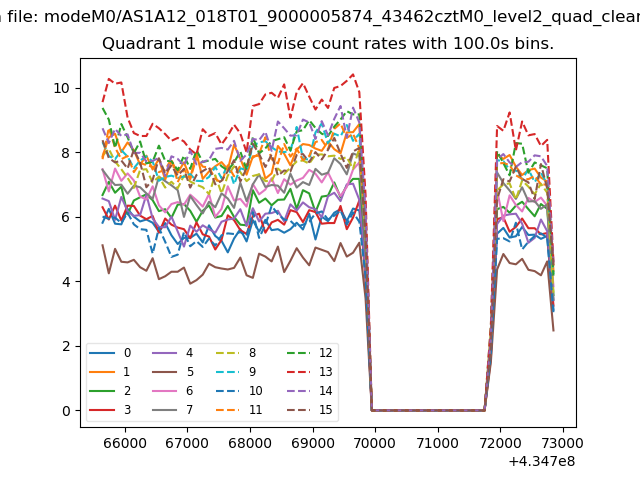
| Module-wise count rates for Quadrant C Data is divided into 100 sec bins |
 |
 |
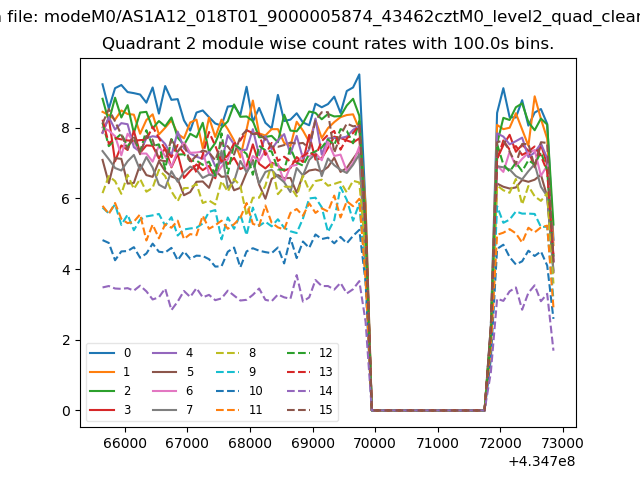
| Module-wise count rates for Quadrant D Data is divided into 100 sec bins |
 |
 |
| Parameter | Plot |
|---|---|
| CZT HV Monitor | 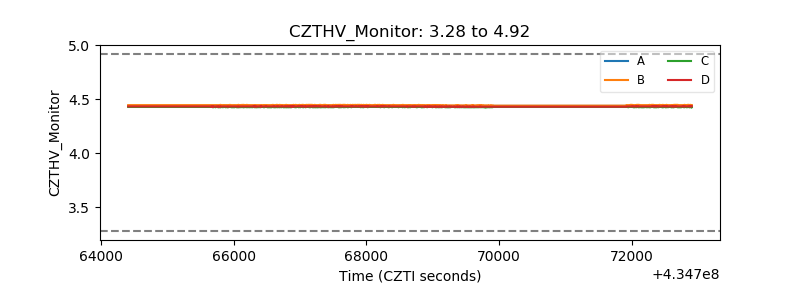 |
| D_VDD | 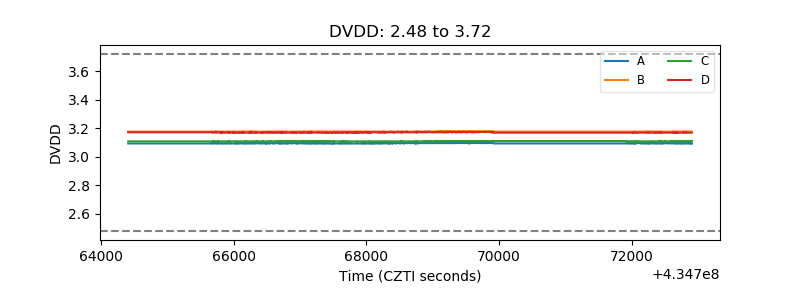 |
| Temperature 1 | 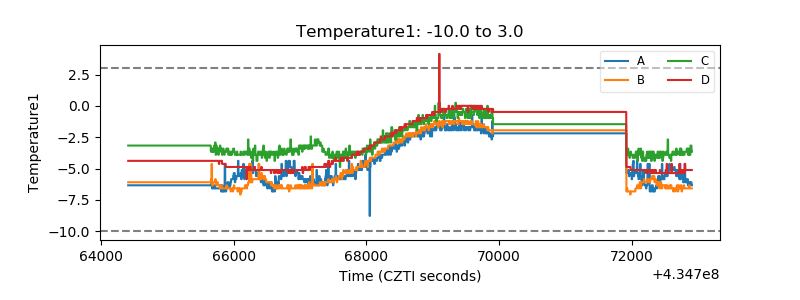 |
| Veto HV Monitor | 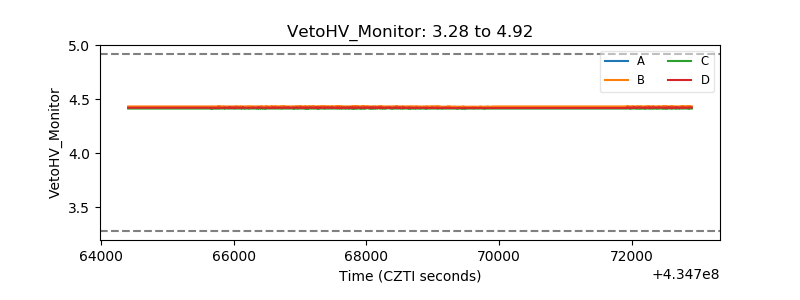 |
| Veto LLD | 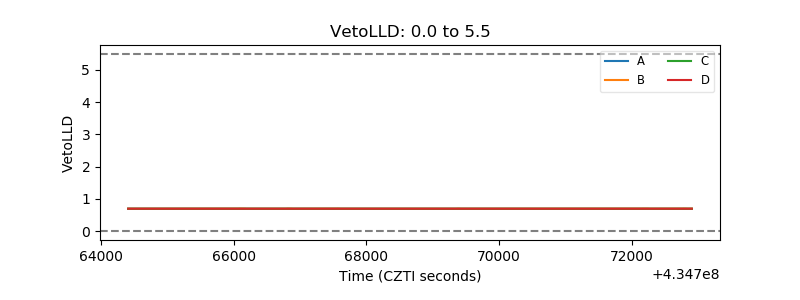 |
| Alpha Counter | 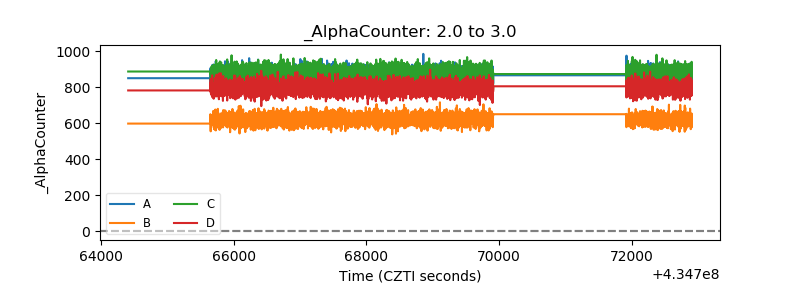 |
| _CPM_Rate | 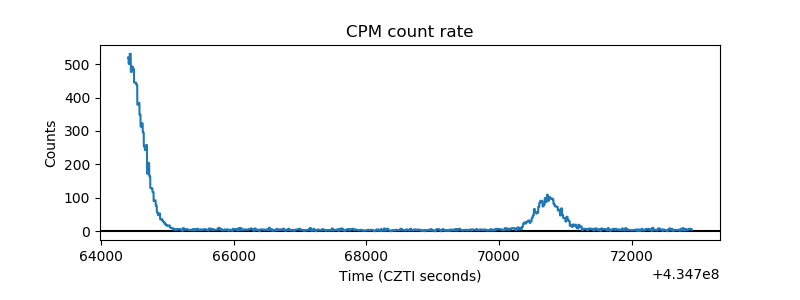 |
| CZT Counter | 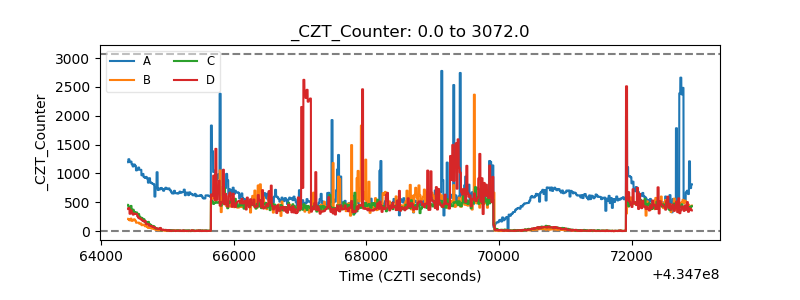 |
| +2.5 Volts monitor | 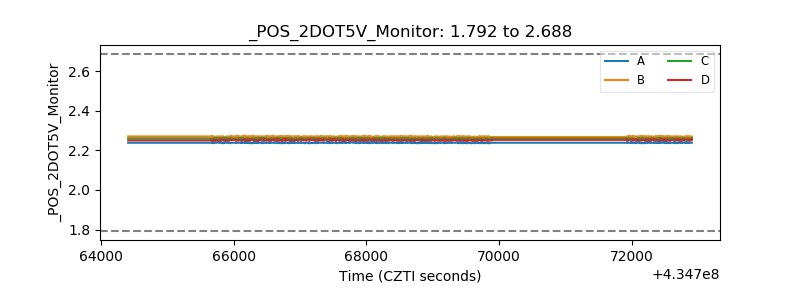 |
| +5 Volts monitor | 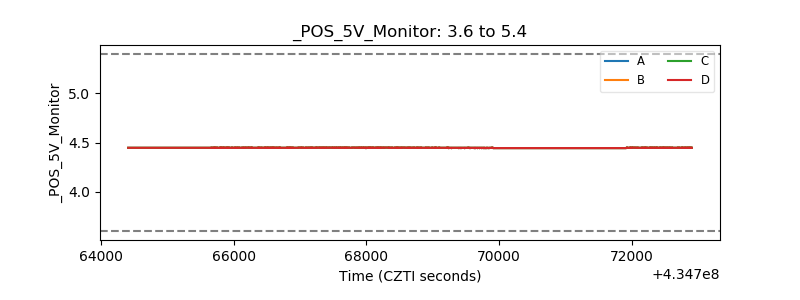 |
| _ROLL_ROT | 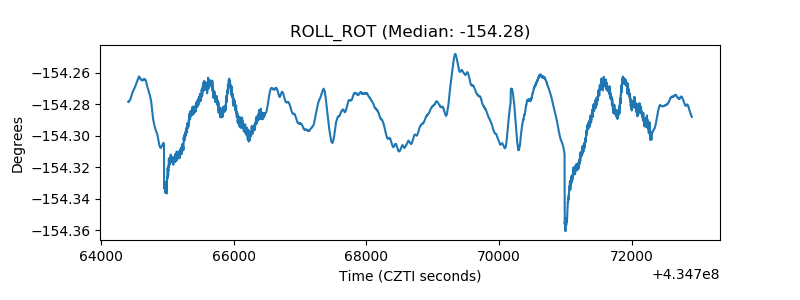 |
| _Roll_DEC | 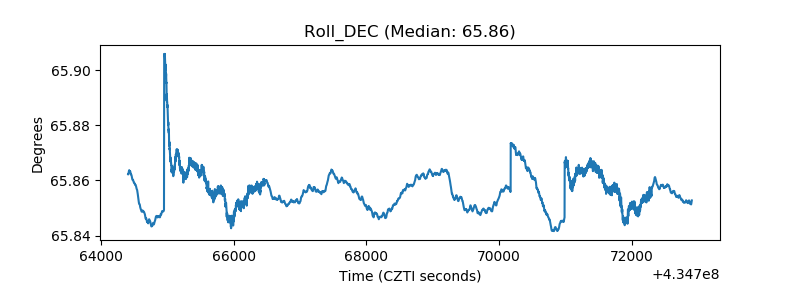 |
| _Roll_RA | 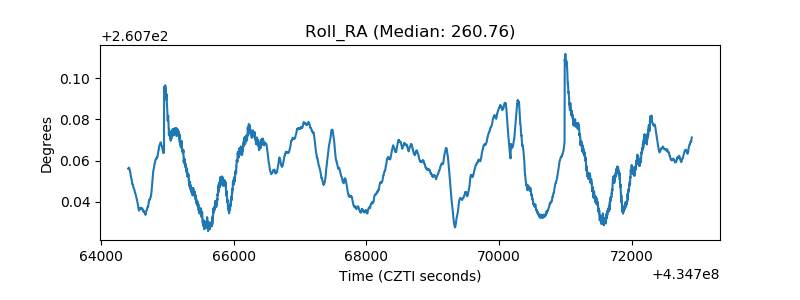 |
| Veto Counter | 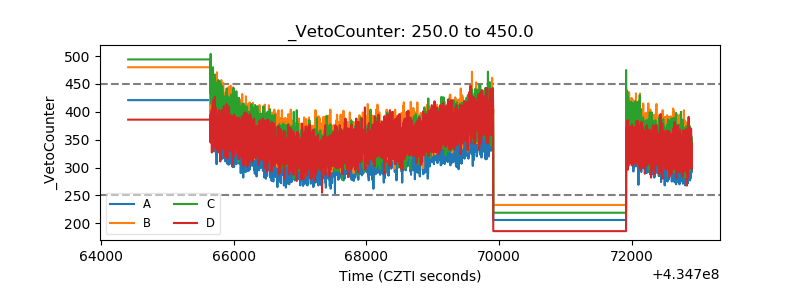 |