| Param | Original file | Final file |
|---|---|---|
| Filename | modeM0/AS1A12_018T01_9000005874_43463cztM0_level2.fits | modeM0/AS1A12_018T01_9000005874_43463cztM0_level2_quad_clean.evt |
| Size (bytes) | 339,275,520 | 87,261,120 |
| Size | 323.6 MB | 83.2 MB |
| Events in quadrant A | 3,999,075 | 566,158 |
| Events in quadrant B | 2,839,636 | 598,618 |
| Events in quadrant C | 2,465,124 | 572,700 |
| Events in quadrant D | 2,830,330 | 523,106 |
| Mode M0 | |||
|---|---|---|---|
| Quadrant | BADHDUFLAG | Total packets | Discarded packets |
| A | 0 | 15702 | 6 |
| B | 0 | 12185 | 2 |
| C | 0 | 11006 | 2 |
| D | 0 | 12501 | 2 |
| Mode M9 | |||
|---|---|---|---|
| Quadrant | BADHDUFLAG | Total packets | Discarded packets |
| A | 0 | 28 | 0 |
| B | 0 | 29 | 0 |
| C | 0 | 29 | 0 |
| D | 0 | 29 | 0 |
| Mode SS | |||
|---|---|---|---|
| Quadrant | BADHDUFLAG | Total packets | Discarded packets |
| A | 0 | 110 | 0 |
| B | 0 | 110 | 0 |
| C | 0 | 110 | 0 |
| D | 0 | 110 | 0 |
| Quadrant | Total seconds | Saturated seconds | Saturation percentage |
|---|---|---|---|
| A | 5453 | 190 | 3.484321% |
| B | 5453 | 13 | 0.238401% |
| C | 5453 | 3 | 0.055016% |
| D | 5453 | 52 | 0.953604% |
Noise dominated data is calculated using 1-second bins in cleaned event files. If a bin has >2000 counts, and if more than 50% of those come from <1% of pixels, then it is considered to be noise-dominated and hence unusable.
| Quadrant | # 1 sec bins | Bins with >0 counts | Bins with >2000 counts | High rate bins dominated by noise | Noise dominated (total time) | Noise dominated (detector-on time) | Marked lightcurve |
|---|---|---|---|---|---|---|---|
| A | 7126 | 5454 | 158 | 158 | 2.22% | 2.90% | 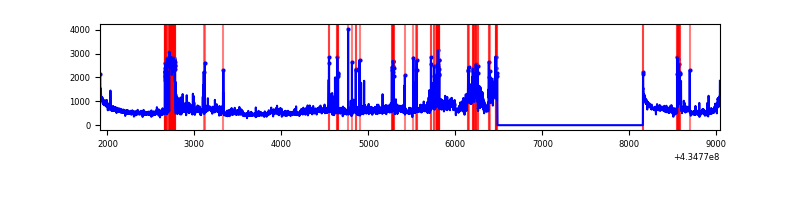 |
| B | 7126 | 5454 | 3 | 3 | 0.04% | 0.06% | 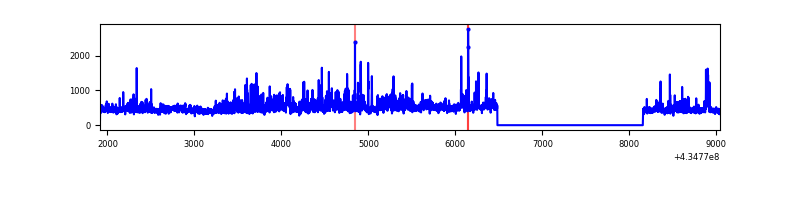 |
| C | 7126 | 5454 | 2 | 2 | 0.03% | 0.04% | 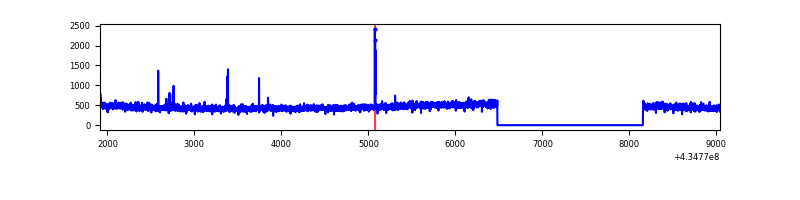 |
| D | 7126 | 5454 | 54 | 54 | 0.76% | 0.99% | 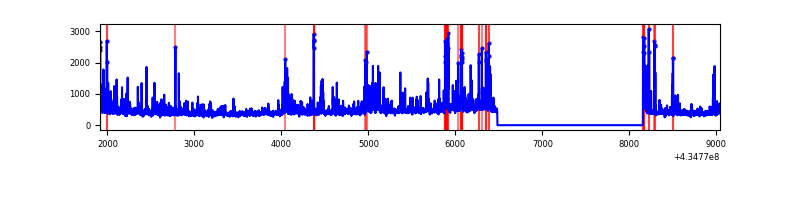 |
Top three noisy pixels from each quadrant. If the there are fewer than three noisy pixels in the level2.evt file, extra rows are filled as -1
| Pixel properties | Quadrant properties | ||||||
|---|---|---|---|---|---|---|---|
| Quadrant | DetID | PixID | Counts | Sigma | Mean | Median | Sigma |
| A | 10 | 83 | 625233 | 5405.2 | 562 | 551 | 115.6 |
| A | 15 | 237 | 612970 | 5299.09 | 562 | 551 | 115.6 |
| A | 15 | 222 | 530582 | 4586.21 | 562 | 551 | 115.6 |
| B | 0 | 245 | 288859 | 2618.31 | 570 | 555 | 110.1 |
| B | 0 | 189 | 101598 | 917.65 | 570 | 555 | 110.1 |
| B | 0 | 199 | 87448 | 789.14 | 570 | 555 | 110.1 |
| C | 15 | 214 | 244454 | 1866.47 | 558 | 559 | 130.7 |
| C | 14 | 254 | 20458 | 152.28 | 558 | 559 | 130.7 |
| C | 3 | 233 | 16017 | 118.3 | 558 | 559 | 130.7 |
| D | 1 | 52 | 310052 | 2263.89 | 556 | 537 | 136.7 |
| D | 9 | 49 | 119474 | 869.94 | 556 | 537 | 136.7 |
| D | 1 | 47 | 74691 | 542.38 | 556 | 537 | 136.7 |
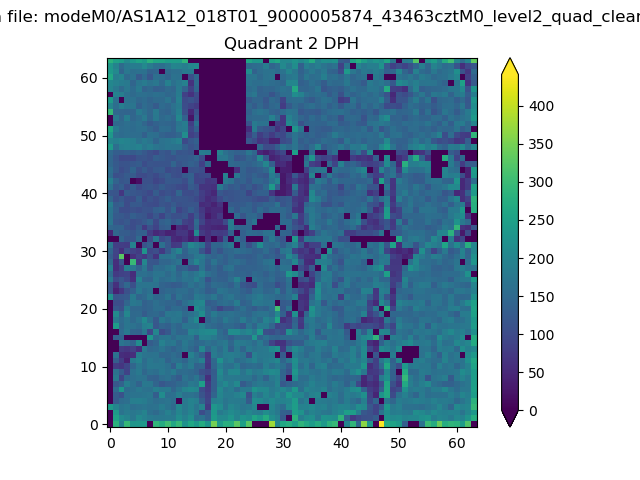
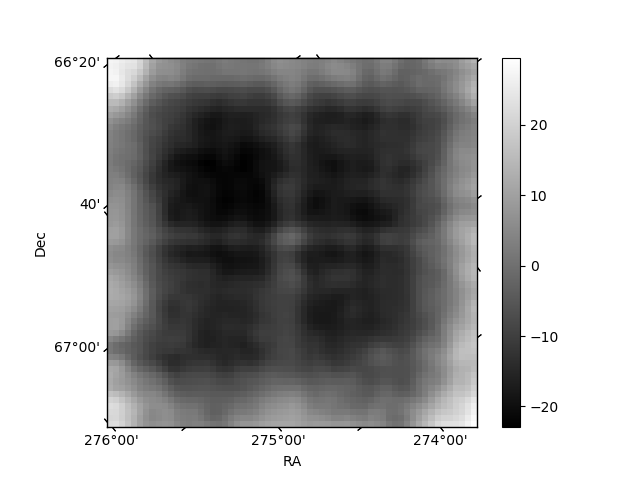
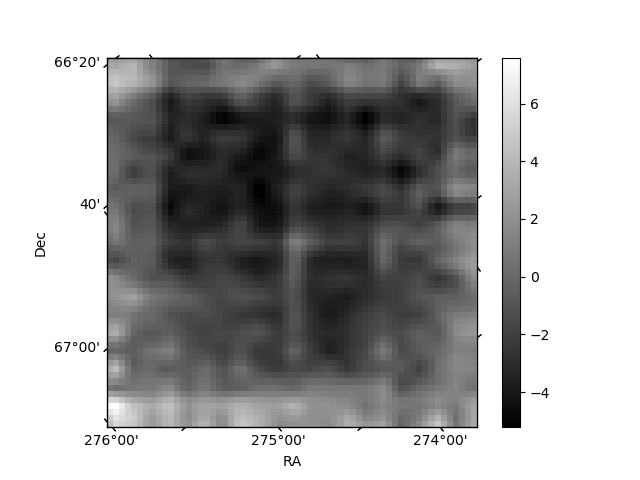
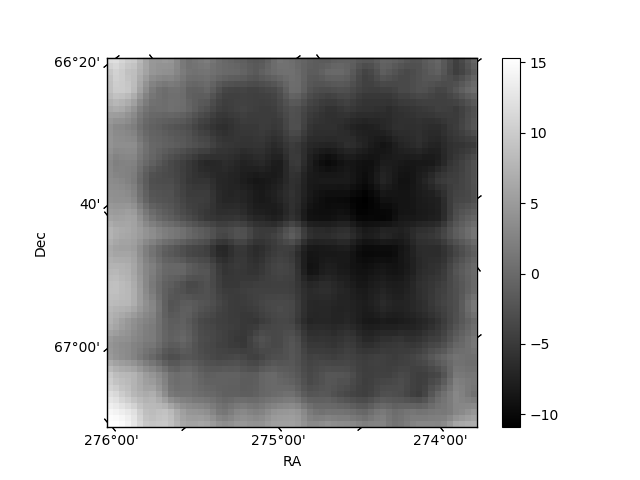
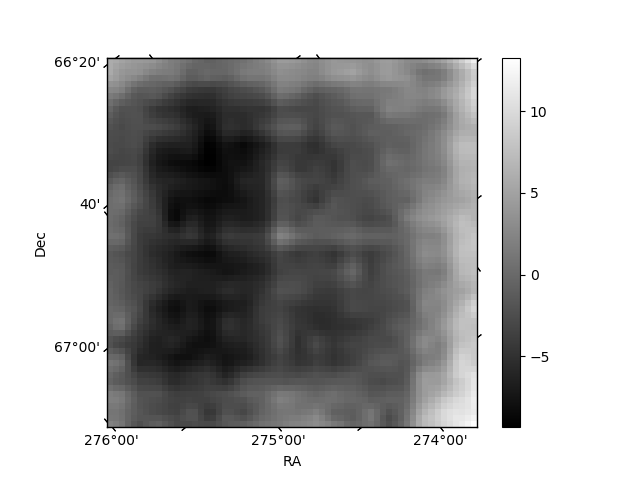
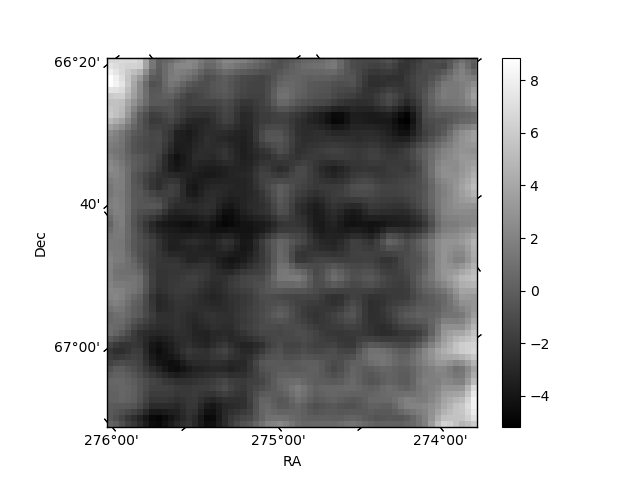
Histogram calculated using DETX and DETY for each event in the final _common_clean file
| Quadrant A | 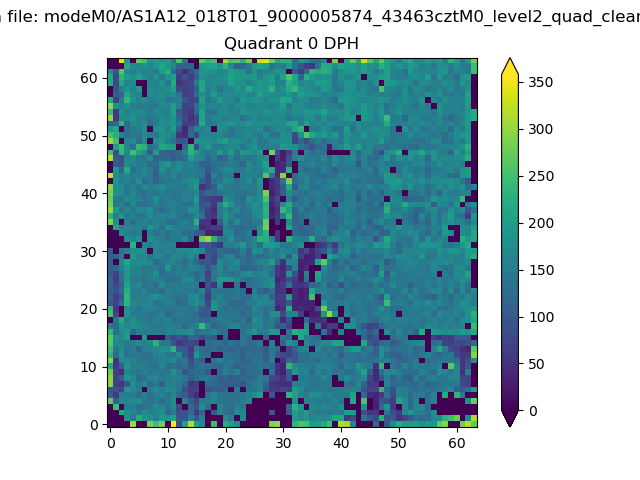 |
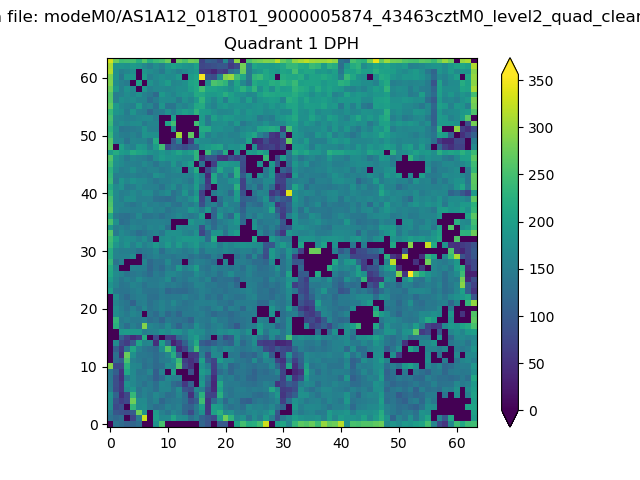 |
Quadrant B |
|---|---|---|---|
| Quadrant D | 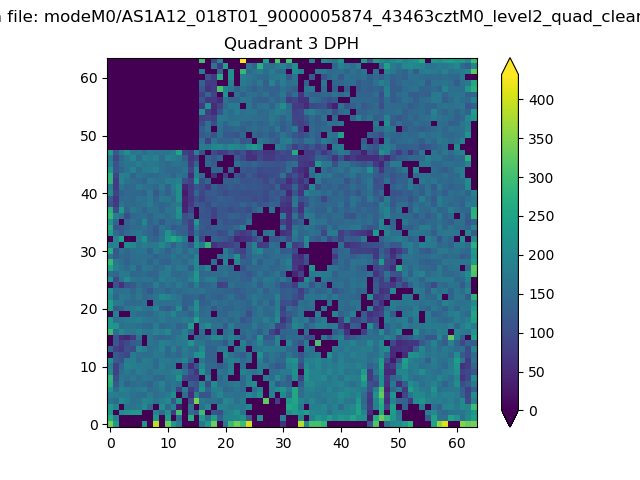 |
 |
Quadrant C |
| Plot type | Count rate plots | Images |
|---|---|---|
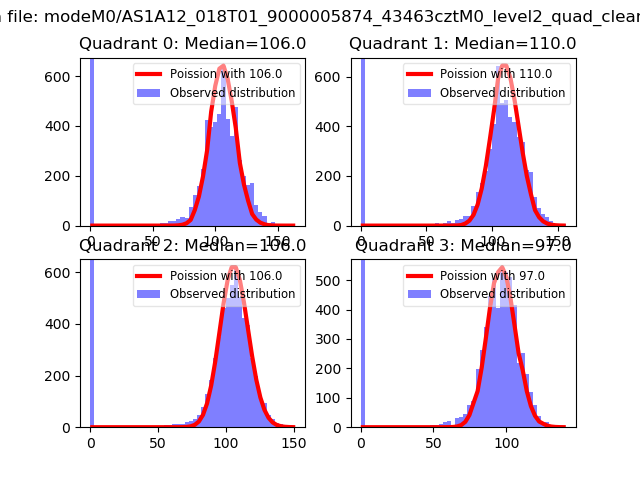
| Comparison with Poisson distribution Blue bars denote a histogram of data divided into 1 sec bins. Red curve is a Poisson curve with rate = median count rate of data. |
 |
 |
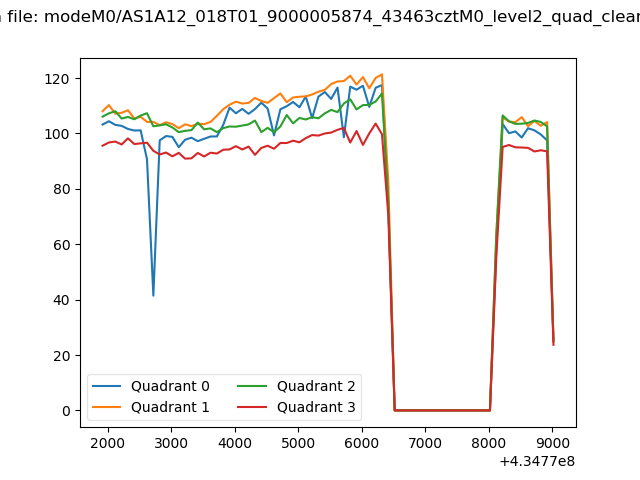
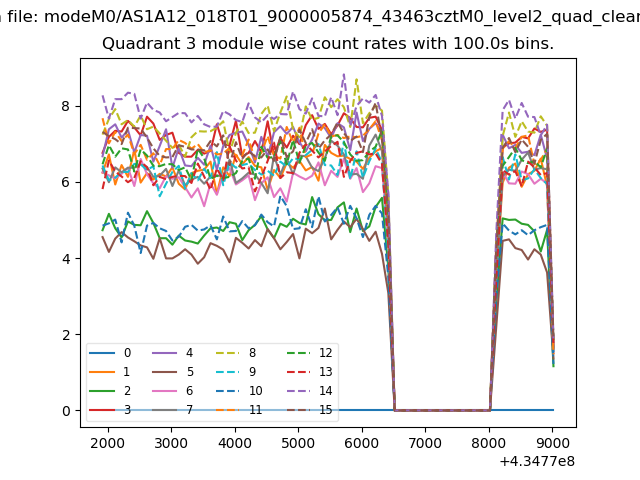
| Quadrant-wise count rates Data is divided into 100 sec bins |
 |
|
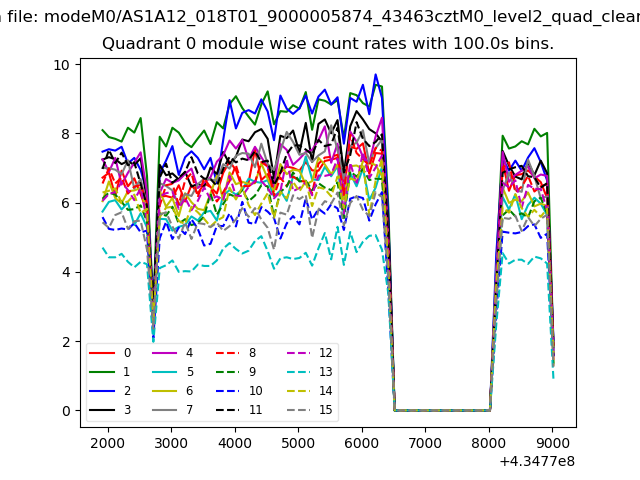
| Module-wise count rates for Quadrant A Data is divided into 100 sec bins |
 |
 |
| Module-wise count rates for Quadrant B Data is divided into 100 sec bins |
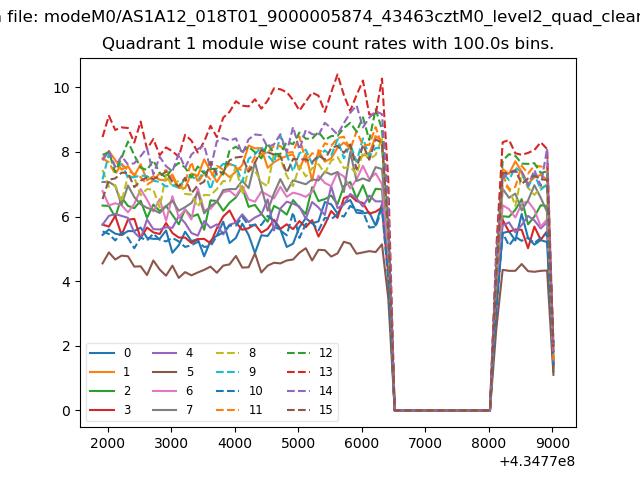 |
 |
| Module-wise count rates for Quadrant C Data is divided into 100 sec bins |
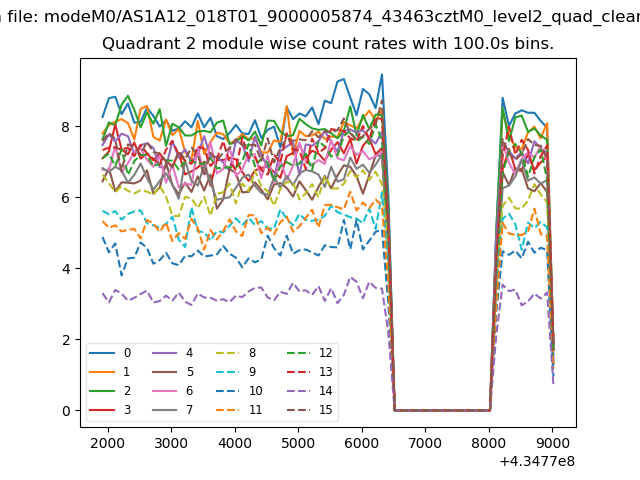 |
 |
| Module-wise count rates for Quadrant D Data is divided into 100 sec bins |
 |
 |
| Parameter | Plot |
|---|---|
| CZT HV Monitor | 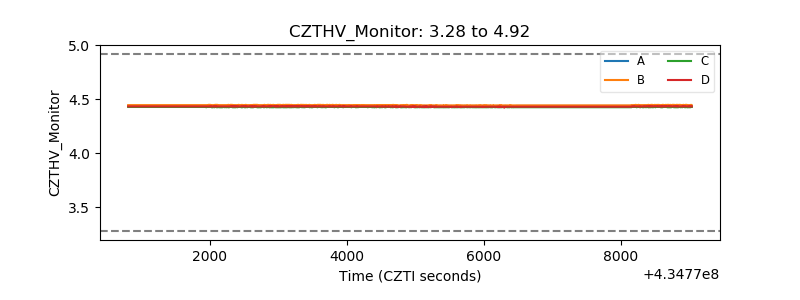 |
| D_VDD | 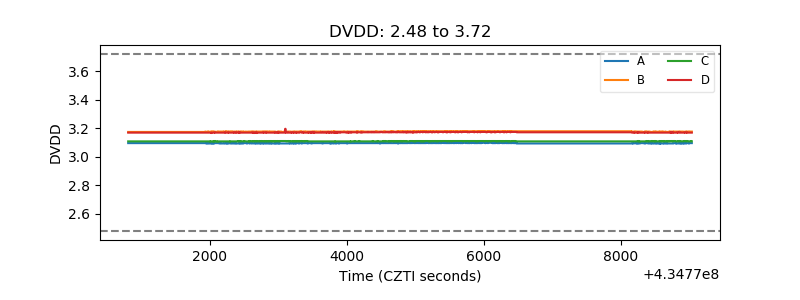 |
| Temperature 1 | 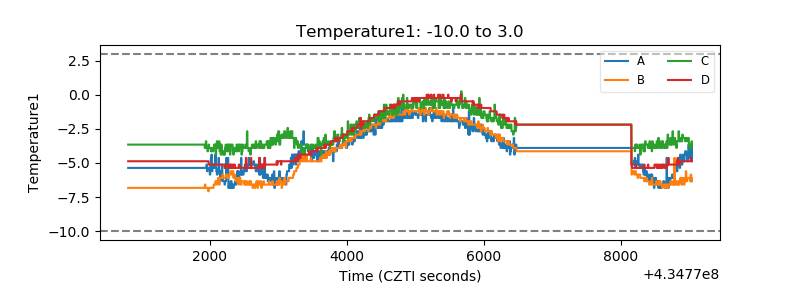 |
| Veto HV Monitor | 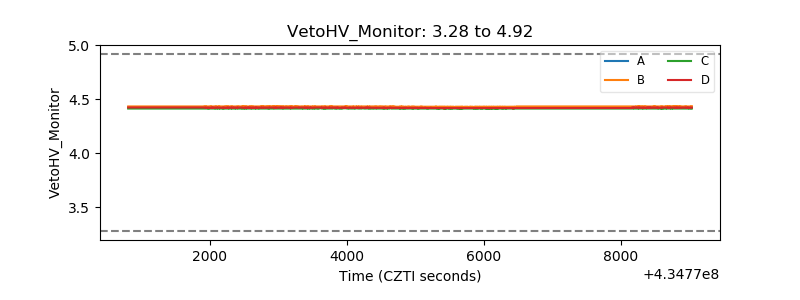 |
| Veto LLD | 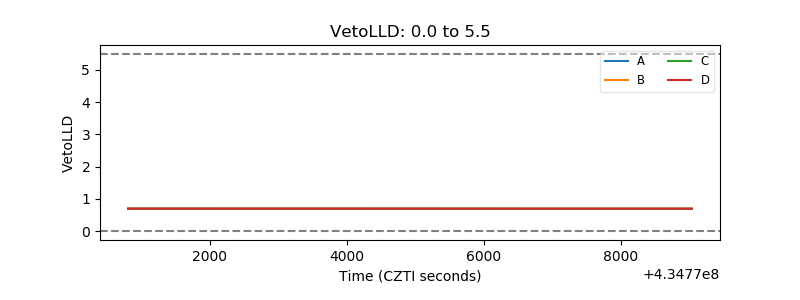 |
| Alpha Counter | 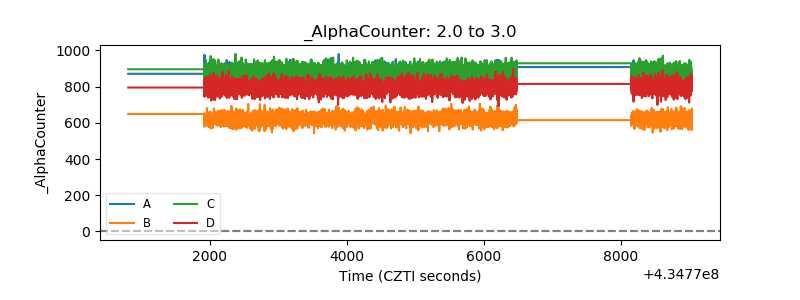 |
| _CPM_Rate | 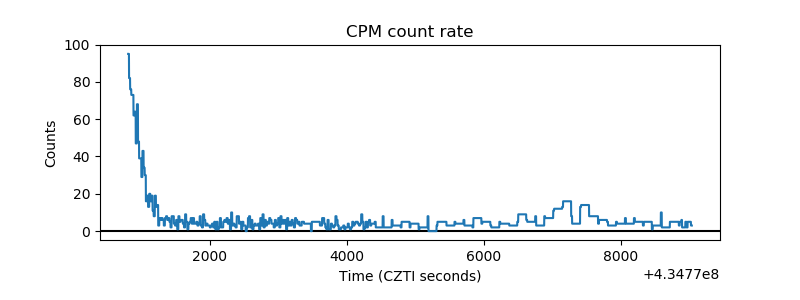 |
| CZT Counter | 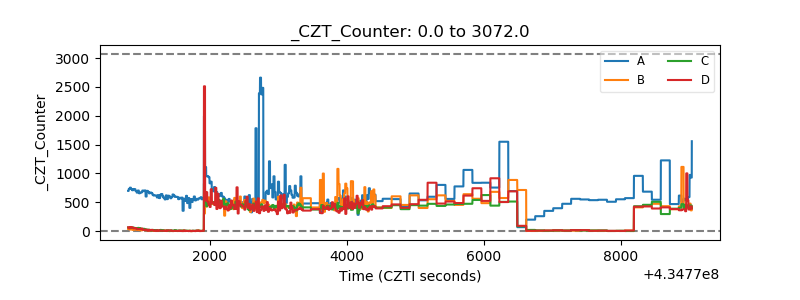 |
| +2.5 Volts monitor | 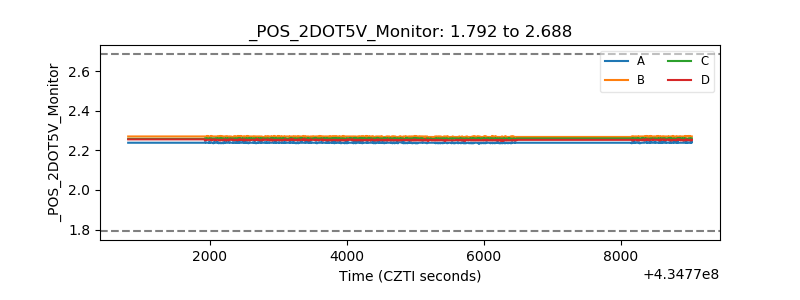 |
| +5 Volts monitor | 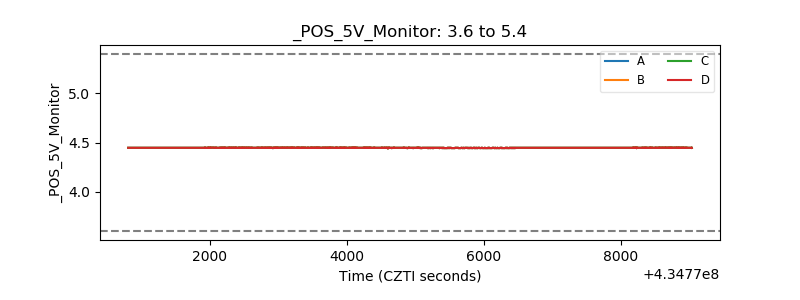 |
| _ROLL_ROT | 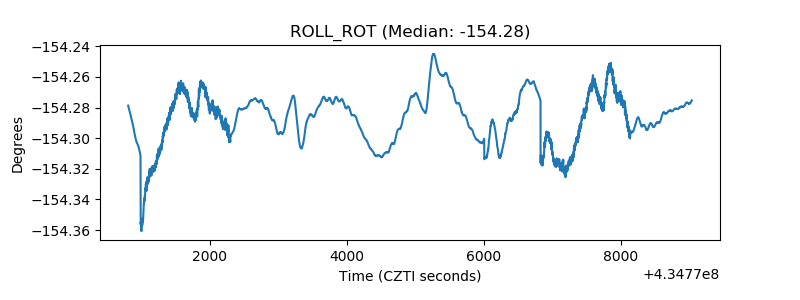 |
| _Roll_DEC | 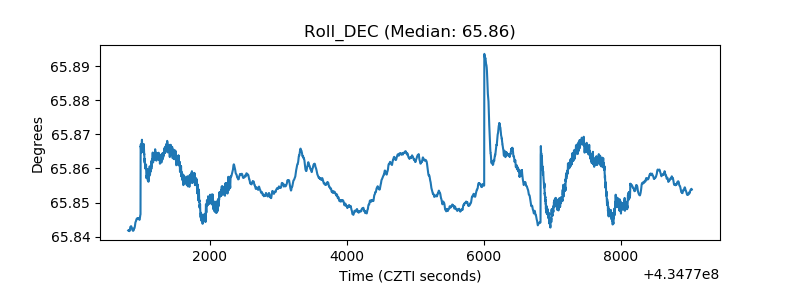 |
| _Roll_RA | 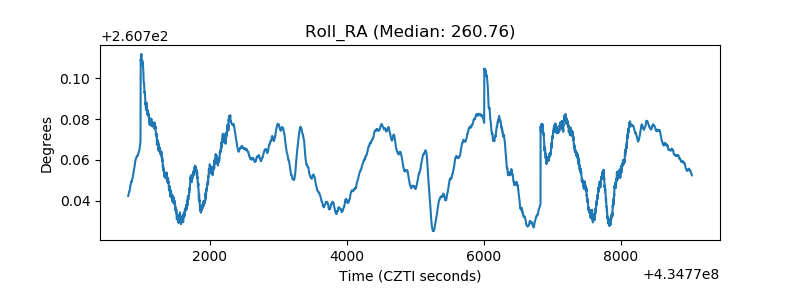 |
| Veto Counter |  |