| Param | Original file | Final file |
|---|---|---|
| Filename | modeM0/AS1A12_018T01_9000005874_43465cztM0_level2.fits | modeM0/AS1A12_018T01_9000005874_43465cztM0_level2_quad_clean.evt |
| Size (bytes) | 408,525,120 | 94,196,160 |
| Size | 389.6 MB | 89.8 MB |
| Events in quadrant A | 5,744,066 | 609,612 |
| Events in quadrant B | 2,948,300 | 651,062 |
| Events in quadrant C | 2,718,164 | 614,524 |
| Events in quadrant D | 3,252,541 | 563,802 |
| Mode M0 | |||
|---|---|---|---|
| Quadrant | BADHDUFLAG | Total packets | Discarded packets |
| A | 0 | 20840 | 2 |
| B | 0 | 12716 | 2 |
| C | 0 | 11943 | 2 |
| D | 0 | 13746 | 2 |
| Mode M9 | |||
|---|---|---|---|
| Quadrant | BADHDUFLAG | Total packets | Discarded packets |
| A | 0 | 13 | 0 |
| B | 0 | 13 | 0 |
| C | 0 | 13 | 0 |
| D | 0 | 13 | 0 |
| Mode SS | |||
|---|---|---|---|
| Quadrant | BADHDUFLAG | Total packets | Discarded packets |
| A | 0 | 122 | 0 |
| B | 0 | 122 | 0 |
| C | 0 | 120 | 0 |
| D | 0 | 120 | 0 |
| Quadrant | Total seconds | Saturated seconds | Saturation percentage |
|---|---|---|---|
| A | 5901 | 949 | 16.082020% |
| B | 5901 | 17 | 0.288087% |
| C | 5902 | 11 | 0.186377% |
| D | 5901 | 71 | 1.203186% |
Noise dominated data is calculated using 1-second bins in cleaned event files. If a bin has >2000 counts, and if more than 50% of those come from <1% of pixels, then it is considered to be noise-dominated and hence unusable.
| Quadrant | # 1 sec bins | Bins with >0 counts | Bins with >2000 counts | High rate bins dominated by noise | Noise dominated (total time) | Noise dominated (detector-on time) | Marked lightcurve |
|---|---|---|---|---|---|---|---|
| A | 7215 | 5902 | 922 | 922 | 12.78% | 15.62% | 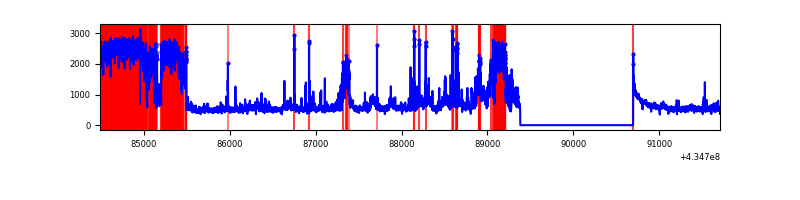 |
| B | 7215 | 5902 | 10 | 10 | 0.14% | 0.17% | 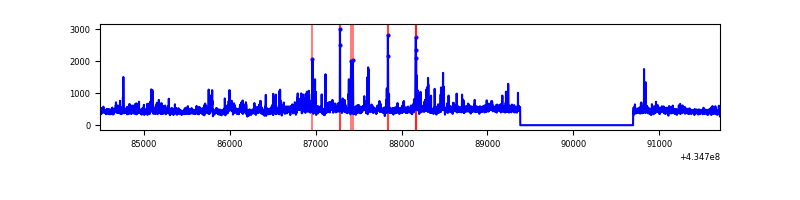 |
| C | 7216 | 5903 | 8 | 8 | 0.11% | 0.14% | 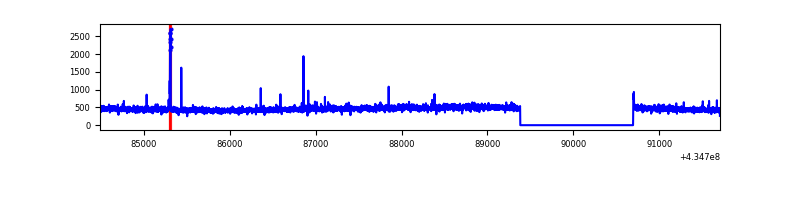 |
| D | 7215 | 5902 | 68 | 68 | 0.94% | 1.15% | 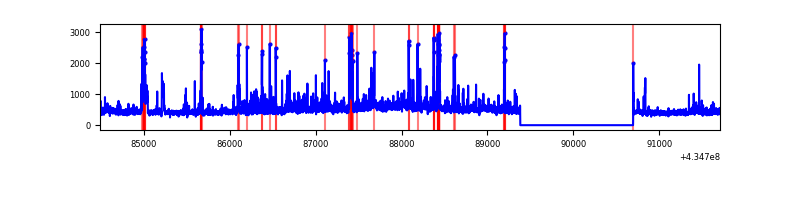 |
Top three noisy pixels from each quadrant. If the there are fewer than three noisy pixels in the level2.evt file, extra rows are filled as -1
| Pixel properties | Quadrant properties | ||||||
|---|---|---|---|---|---|---|---|
| Quadrant | DetID | PixID | Counts | Sigma | Mean | Median | Sigma |
| A | 15 | 237 | 2574007 | 20752.45 | 599 | 586 | 124.0 |
| A | 10 | 83 | 567223 | 4569.44 | 599 | 586 | 124.0 |
| A | 15 | 222 | 261538 | 2104.36 | 599 | 586 | 124.0 |
| B | 0 | 245 | 176304 | 1460.38 | 627 | 609 | 120.3 |
| B | 0 | 199 | 140422 | 1162.13 | 627 | 609 | 120.3 |
| B | 0 | 189 | 107193 | 885.93 | 627 | 609 | 120.3 |
| C | 15 | 214 | 262262 | 1826.71 | 612 | 613 | 143.2 |
| C | 3 | 233 | 33656 | 230.69 | 612 | 613 | 143.2 |
| C | 2 | 16 | 25665 | 174.9 | 612 | 613 | 143.2 |
| D | 2 | 16 | 268802 | 1785.9 | 610 | 593 | 150.2 |
| D | 1 | 52 | 253843 | 1686.29 | 610 | 593 | 150.2 |
| D | 13 | 249 | 162632 | 1078.95 | 610 | 593 | 150.2 |
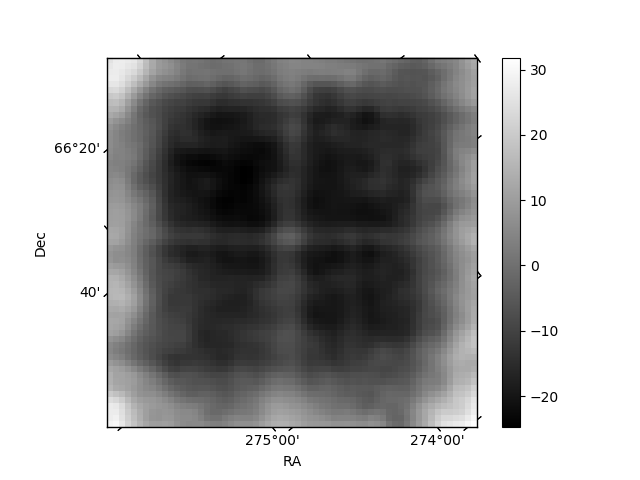
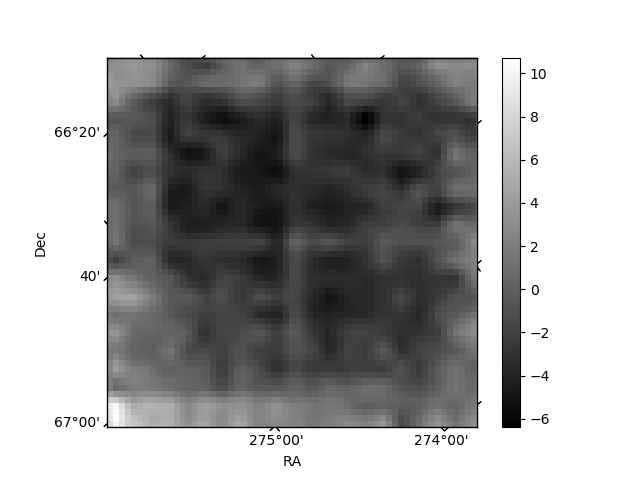
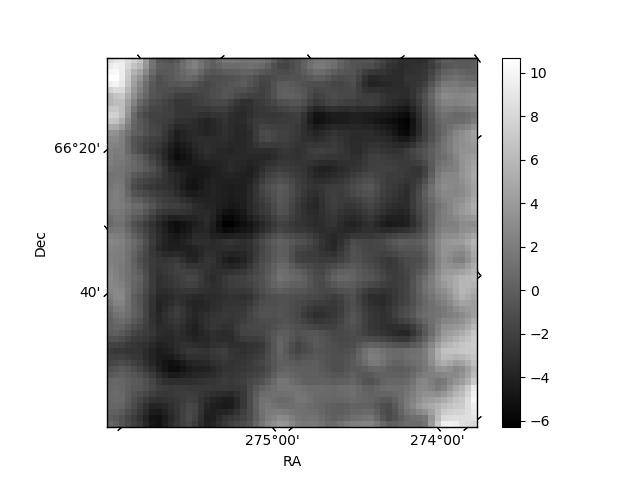
Histogram calculated using DETX and DETY for each event in the final _common_clean file
| Quadrant A | 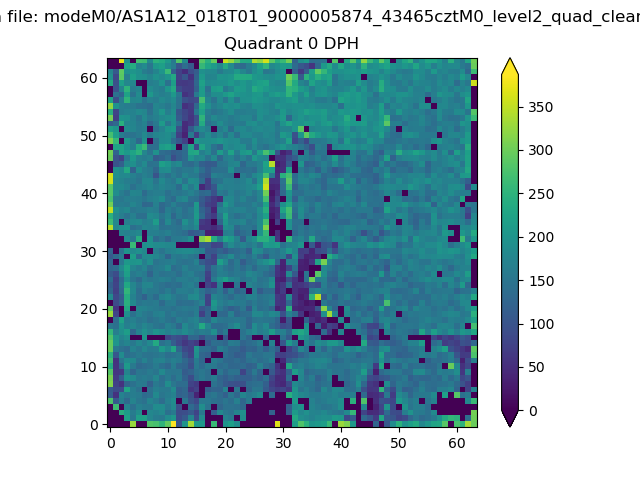 |
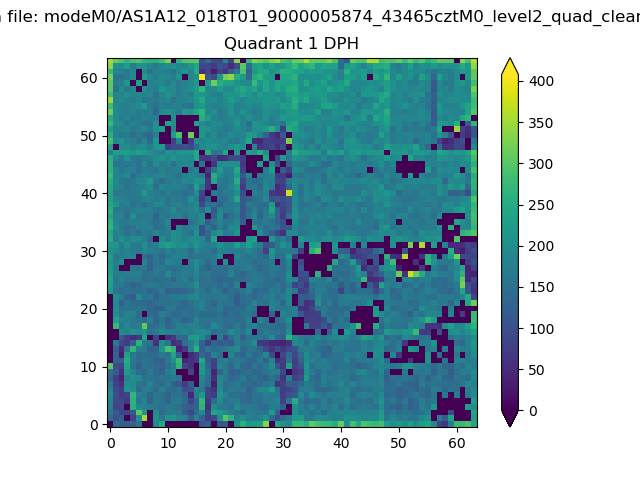 |
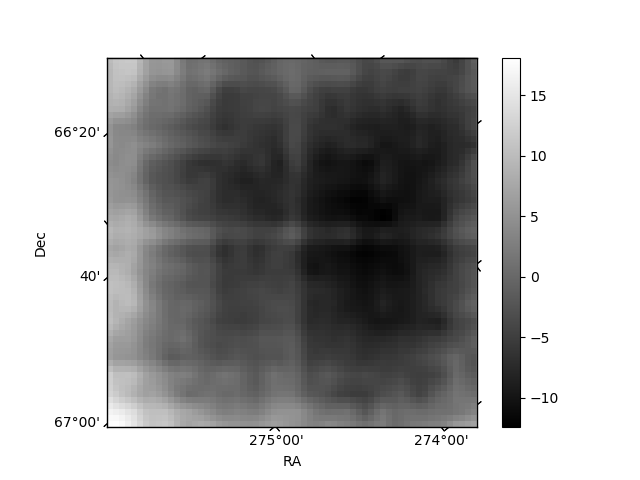
Quadrant B |
|---|---|---|---|
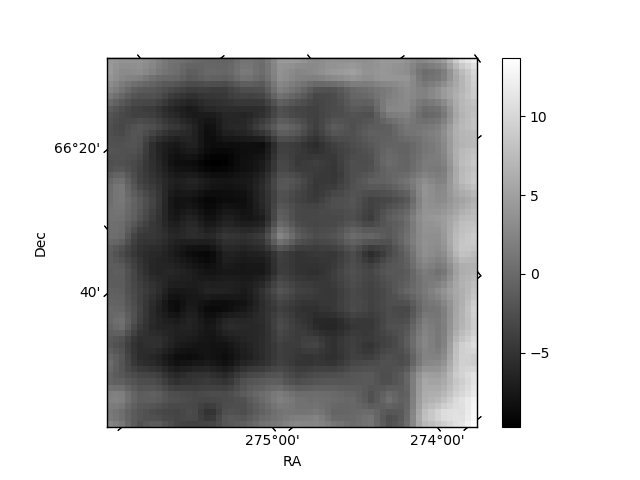
| Quadrant D | 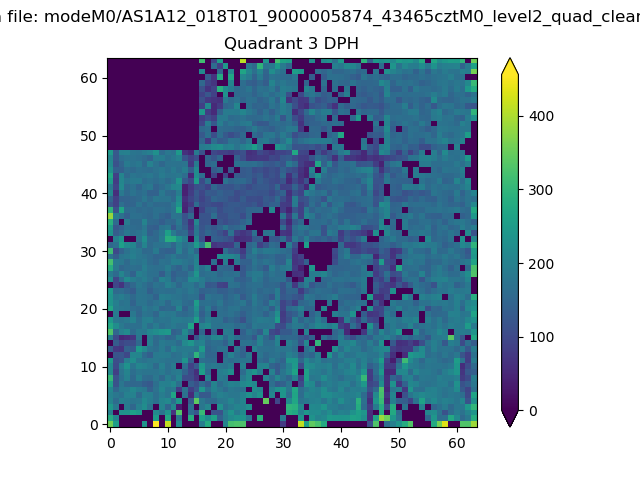 |
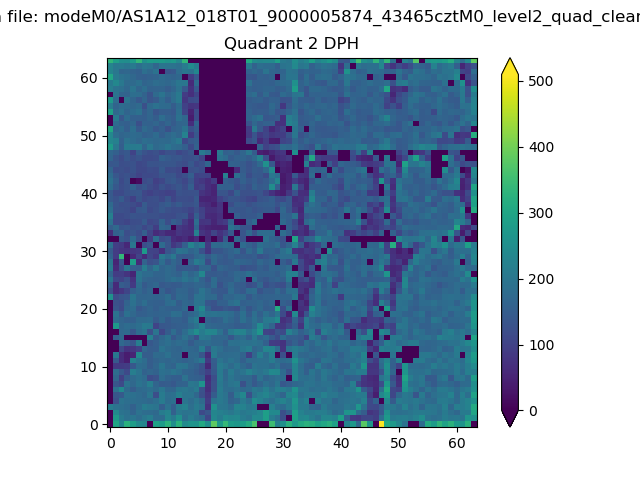 |
Quadrant C |
| Plot type | Count rate plots | Images |
|---|---|---|
| Comparison with Poisson distribution Blue bars denote a histogram of data divided into 1 sec bins. Red curve is a Poisson curve with rate = median count rate of data. |
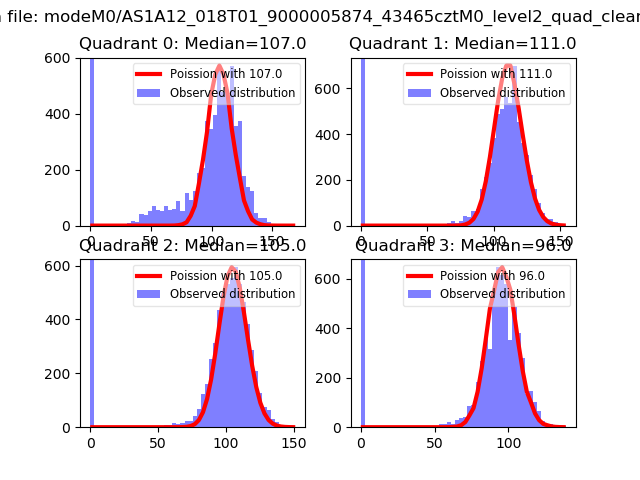 |
 |
| Quadrant-wise count rates Data is divided into 100 sec bins |
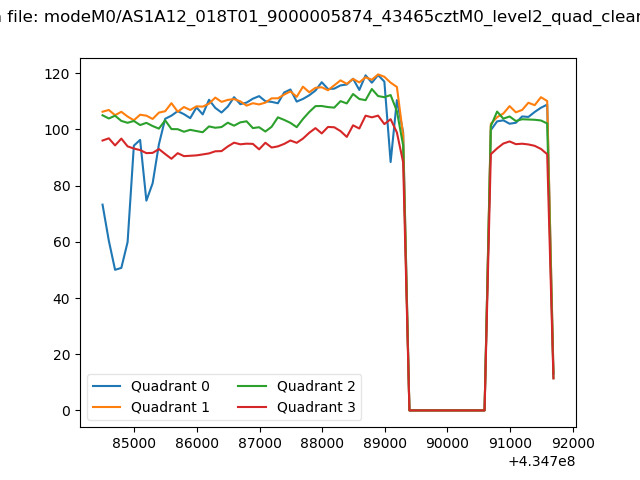 |
|
| Module-wise count rates for Quadrant A Data is divided into 100 sec bins |
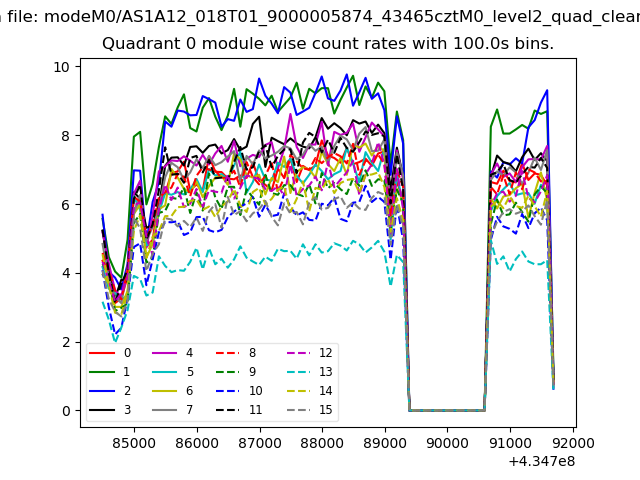 |
 |
| Module-wise count rates for Quadrant B Data is divided into 100 sec bins |
 |
 |
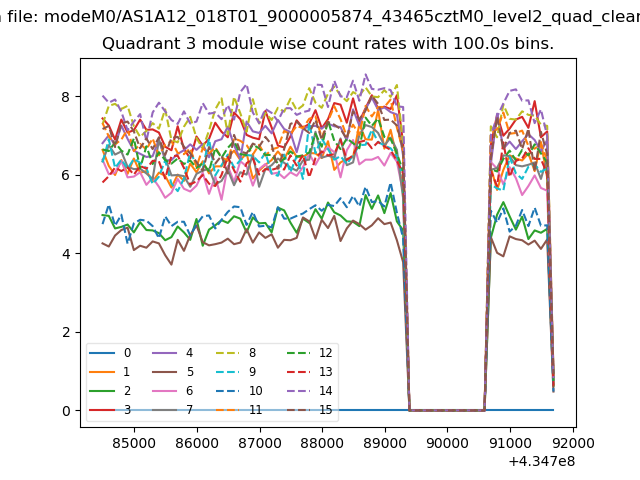
| Module-wise count rates for Quadrant C Data is divided into 100 sec bins |
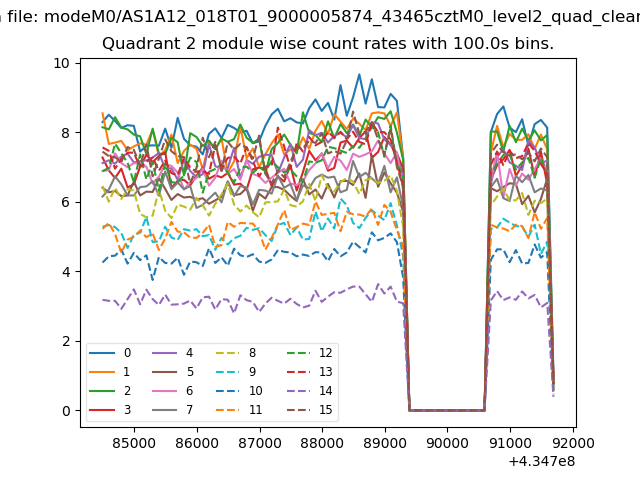 |
 |
| Module-wise count rates for Quadrant D Data is divided into 100 sec bins |
 |
 |
| Parameter | Plot |
|---|---|
| CZT HV Monitor |  |
| D_VDD | 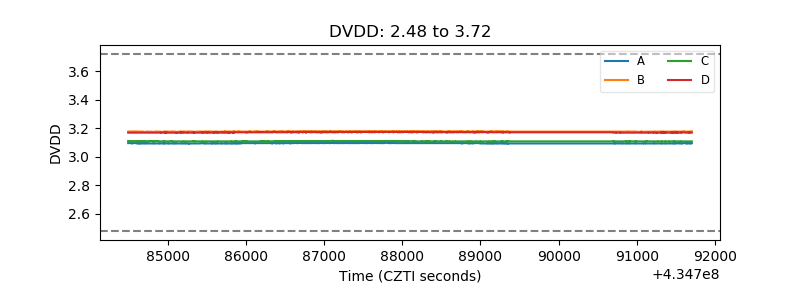 |
| Temperature 1 | 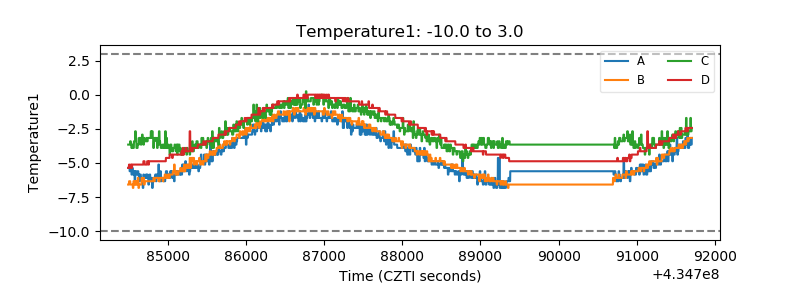 |
| Veto HV Monitor | 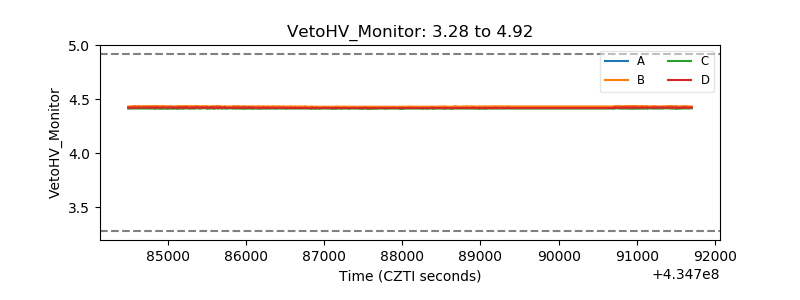 |
| Veto LLD | 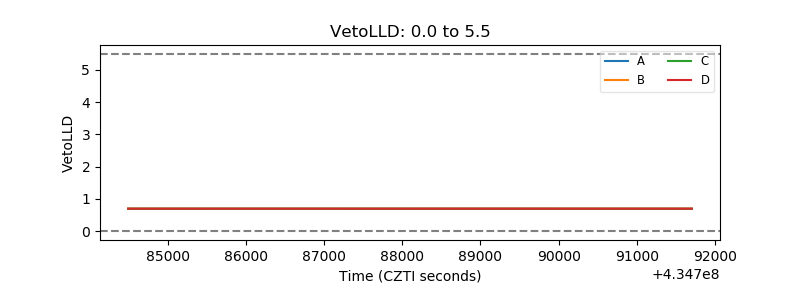 |
| Alpha Counter | 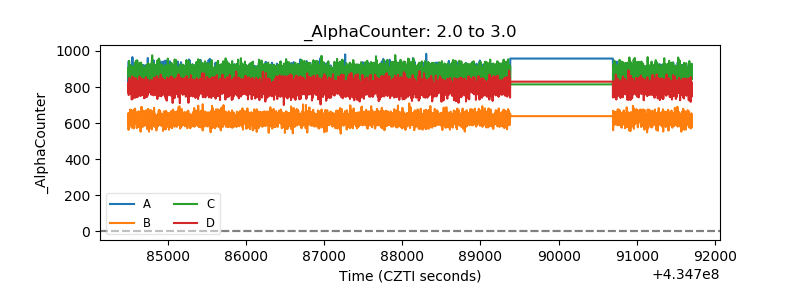 |
| _CPM_Rate | 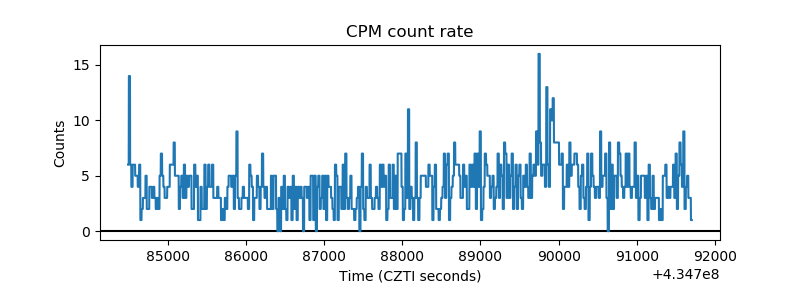 |
| CZT Counter | 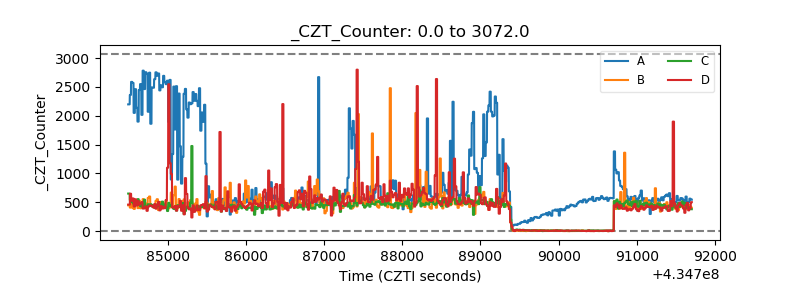 |
| +2.5 Volts monitor | 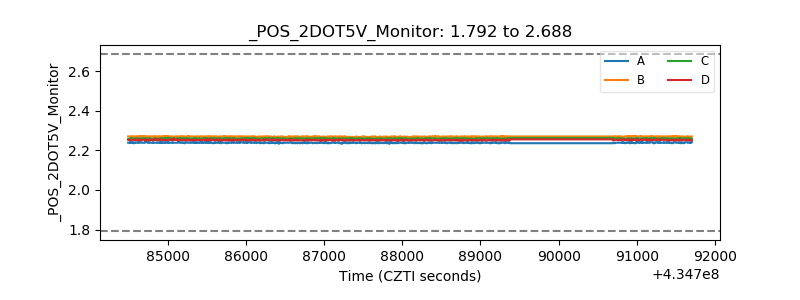 |
| +5 Volts monitor | 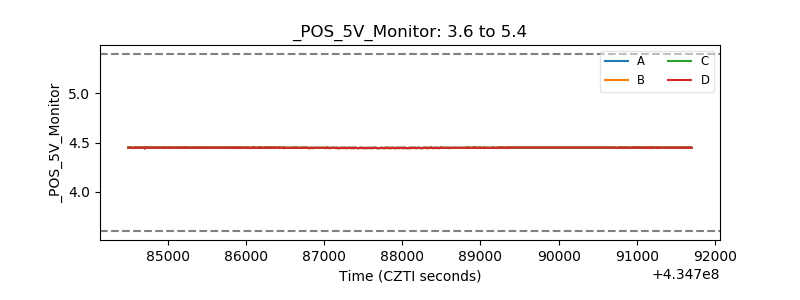 |
| _ROLL_ROT | 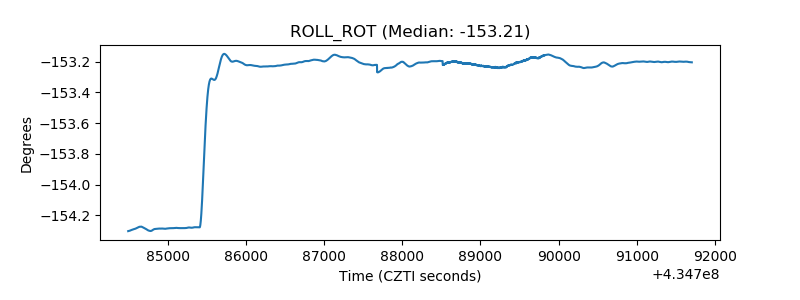 |
| _Roll_DEC | 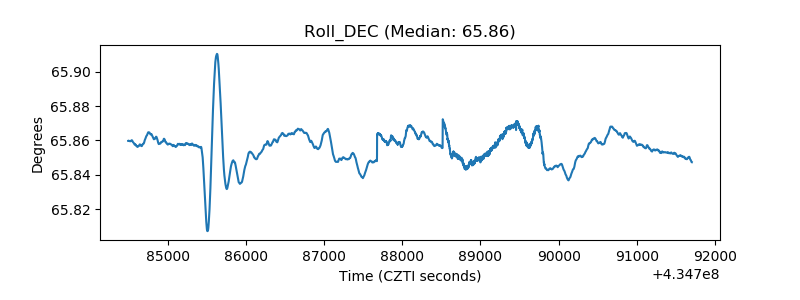 |
| _Roll_RA | 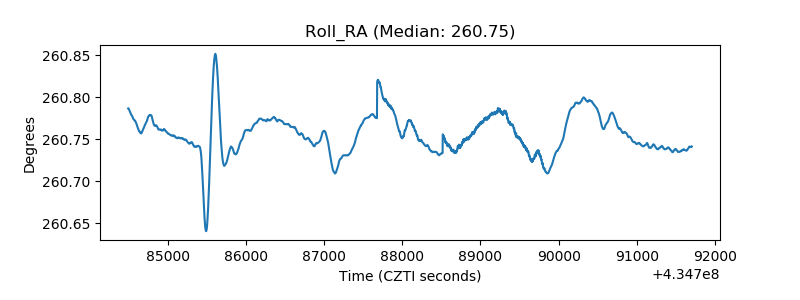 |
| Veto Counter | 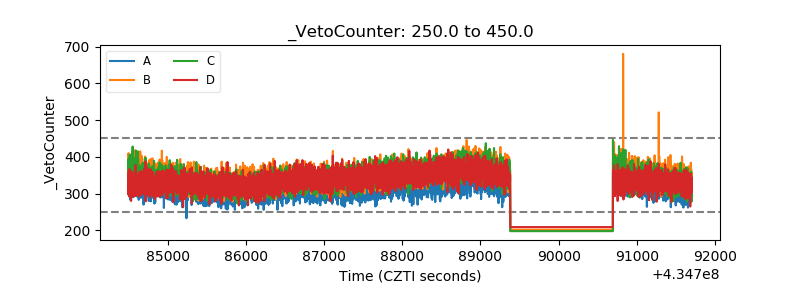 |