| Param | Original file | Final file |
|---|---|---|
| Filename | modeM0/AS1A12_018T01_9000005874_43468cztM0_level2.fits | modeM0/AS1A12_018T01_9000005874_43468cztM0_level2_quad_clean.evt |
| Size (bytes) | 1,172,304,000 | 179,222,400 |
| Size | 1.1 GB | 170.9 MB |
| Events in quadrant A | 9,714,191 | 1,276,463 |
| Events in quadrant B | 6,665,081 | 1,361,247 |
| Events in quadrant C | 5,838,619 | 1,276,146 |
| Events in quadrant D | 20,210,890 | 648,528 |
| Mode M0 | |||
|---|---|---|---|
| Quadrant | BADHDUFLAG | Total packets | Discarded packets |
| A | 0 | 36691 | 3 |
| B | 0 | 28029 | 3 |
| C | 0 | 25407 | 3 |
| D | 0 | 68642 | 8 |
| Mode M9 | |||
|---|---|---|---|
| Quadrant | BADHDUFLAG | Total packets | Discarded packets |
| A | 0 | 29 | 0 |
| B | 0 | 29 | 0 |
| C | 0 | 30 | 0 |
| D | 0 | 30 | 0 |
| Mode SS | |||
|---|---|---|---|
| Quadrant | BADHDUFLAG | Total packets | Discarded packets |
| A | 0 | 256 | 0 |
| B | 0 | 256 | 0 |
| C | 0 | 256 | 0 |
| D | 0 | 256 | 0 |
| Quadrant | Total seconds | Saturated seconds | Saturation percentage |
|---|---|---|---|
| A | 12478 | 824 | 6.603622% |
| B | 12478 | 63 | 0.504889% |
| C | 12478 | 8 | 0.064113% |
| D | 12477 | 5993 | 48.032380% |
Noise dominated data is calculated using 1-second bins in cleaned event files. If a bin has >2000 counts, and if more than 50% of those come from <1% of pixels, then it is considered to be noise-dominated and hence unusable.
| Quadrant | # 1 sec bins | Bins with >0 counts | Bins with >2000 counts | High rate bins dominated by noise | Noise dominated (total time) | Noise dominated (detector-on time) | Marked lightcurve |
|---|---|---|---|---|---|---|---|
| A | 15163 | 12480 | 746 | 746 | 4.92% | 5.98% | 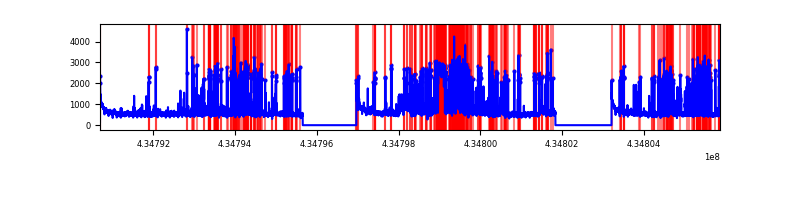 |
| B | 15163 | 12480 | 43 | 43 | 0.28% | 0.34% | 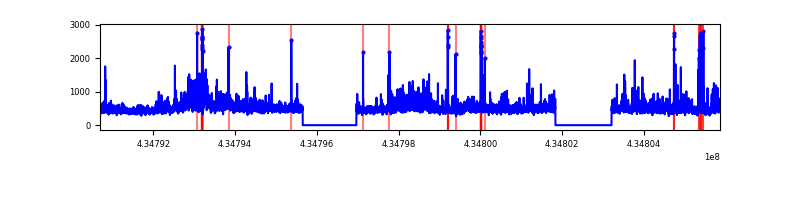 |
| C | 15163 | 12480 | 1 | 1 | 0.01% | 0.01% | 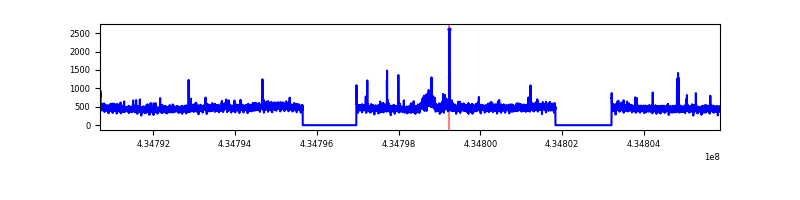 |
| D | 15161 | 12478 | 5889 | 5889 | 38.84% | 47.20% | 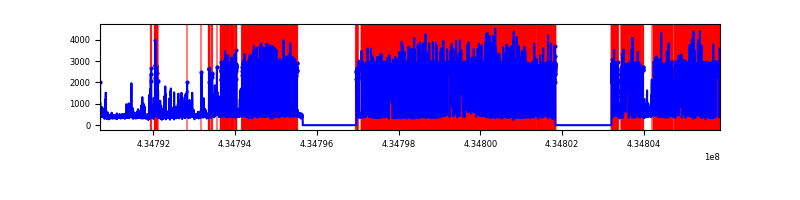 |
Top three noisy pixels from each quadrant. If the there are fewer than three noisy pixels in the level2.evt file, extra rows are filled as -1
| Pixel properties | Quadrant properties | ||||||
|---|---|---|---|---|---|---|---|
| Quadrant | DetID | PixID | Counts | Sigma | Mean | Median | Sigma |
| A | 15 | 237 | 1708575 | 6464.09 | 1291 | 1264 | 264.1 |
| A | 15 | 222 | 1562702 | 5911.79 | 1291 | 1264 | 264.1 |
| A | 10 | 83 | 1282270 | 4850.04 | 1291 | 1264 | 264.1 |
| B | 0 | 199 | 426744 | 1688.76 | 1324 | 1287 | 251.9 |
| B | 0 | 245 | 419300 | 1659.21 | 1324 | 1287 | 251.9 |
| B | 0 | 189 | 249856 | 986.64 | 1324 | 1287 | 251.9 |
| C | 15 | 214 | 549987 | 1831.1 | 1291 | 1298 | 299.6 |
| C | 3 | 233 | 174764 | 578.9 | 1291 | 1298 | 299.6 |
| C | 14 | 254 | 37706 | 121.5 | 1291 | 1298 | 299.6 |
| D | 1 | 52 | 15776972 | 69153.62 | 930 | 901 | 228.1 |
| D | 13 | 249 | 231177 | 1009.4 | 930 | 901 | 228.1 |
| D | 12 | 233 | 139499 | 607.54 | 930 | 901 | 228.1 |
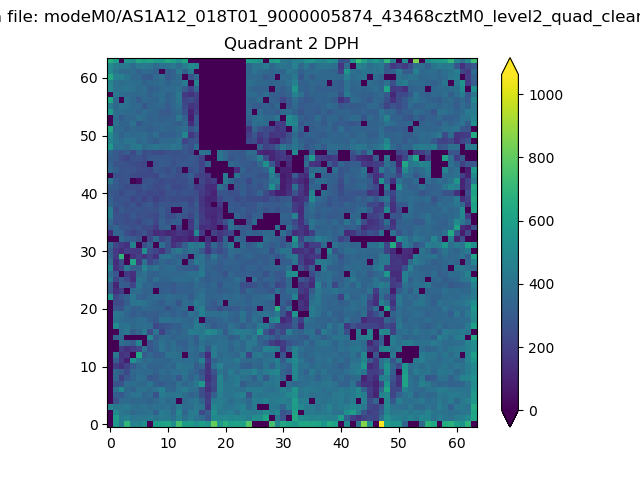
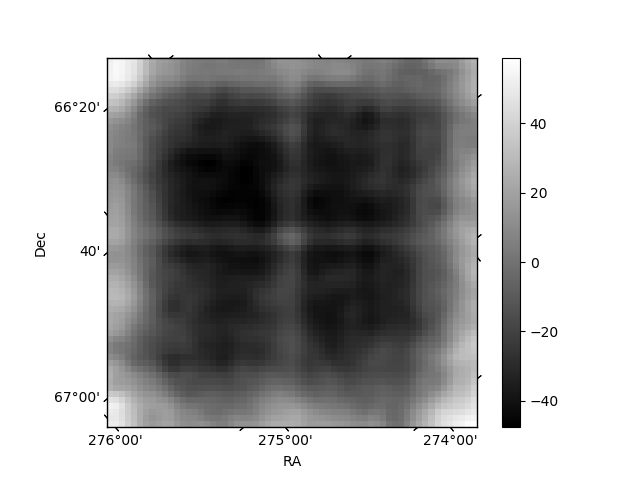
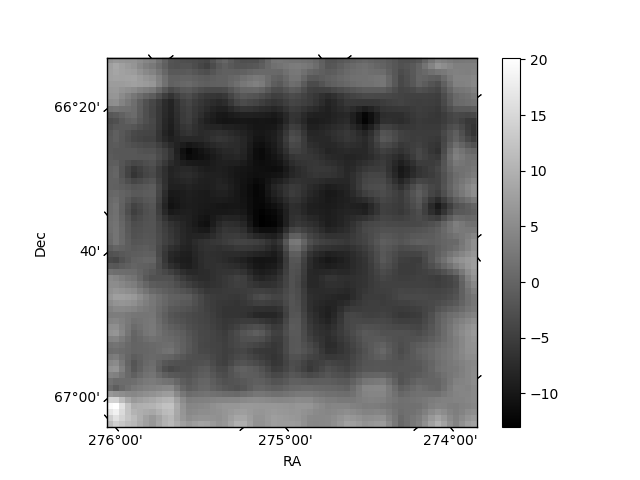
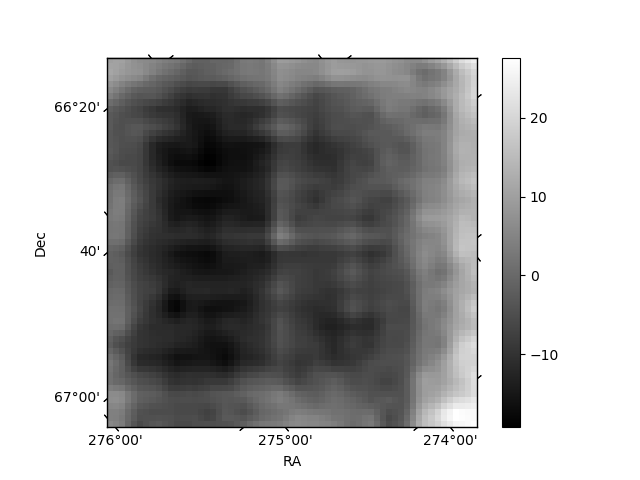
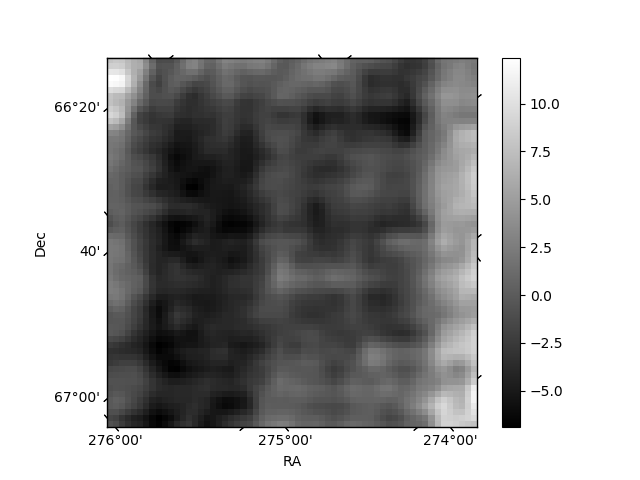
Histogram calculated using DETX and DETY for each event in the final _common_clean file
| Quadrant A | 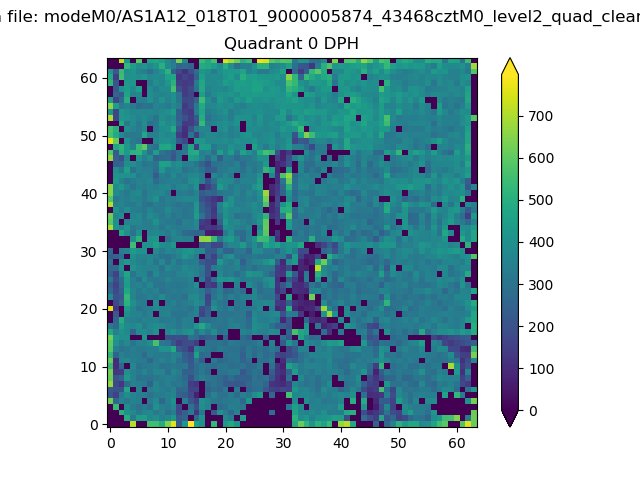 |
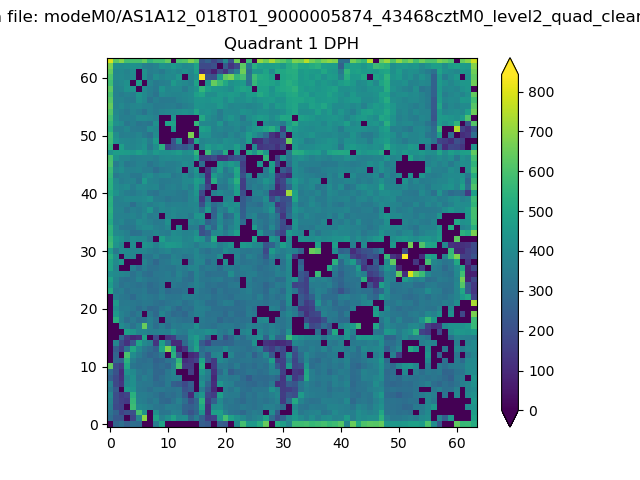 |
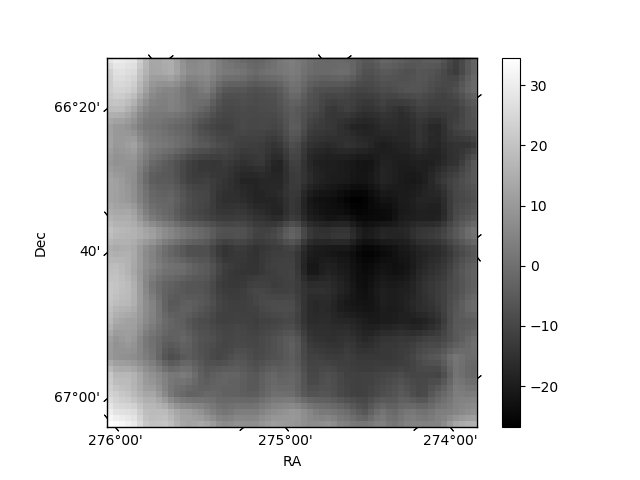
Quadrant B |
|---|---|---|---|
| Quadrant D | 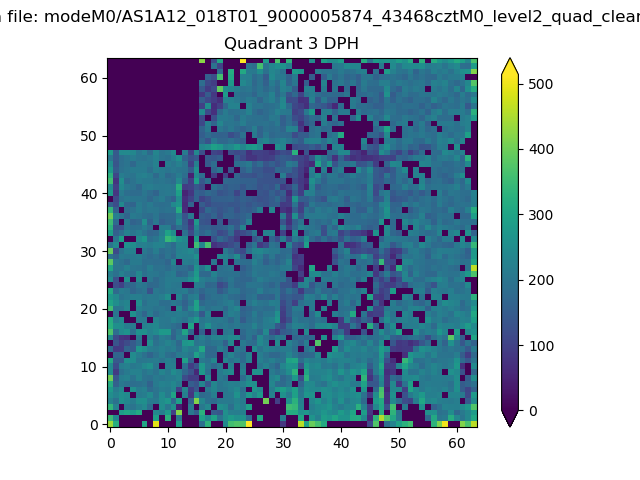 |
 |
Quadrant C |
| Plot type | Count rate plots | Images |
|---|---|---|
| Comparison with Poisson distribution Blue bars denote a histogram of data divided into 1 sec bins. Red curve is a Poisson curve with rate = median count rate of data. |
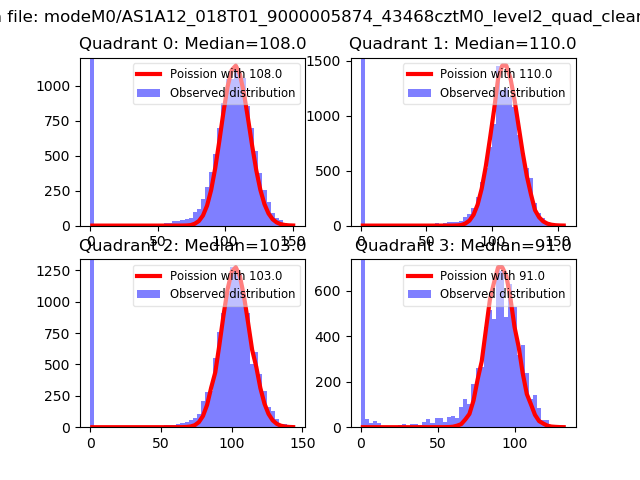 |
 |
| Quadrant-wise count rates Data is divided into 100 sec bins |
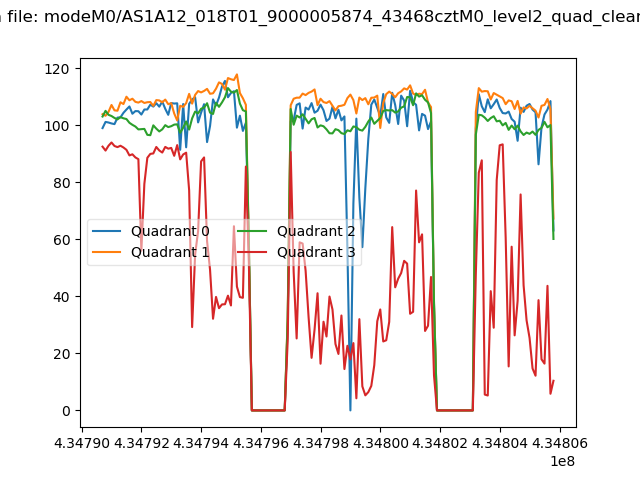 |
|
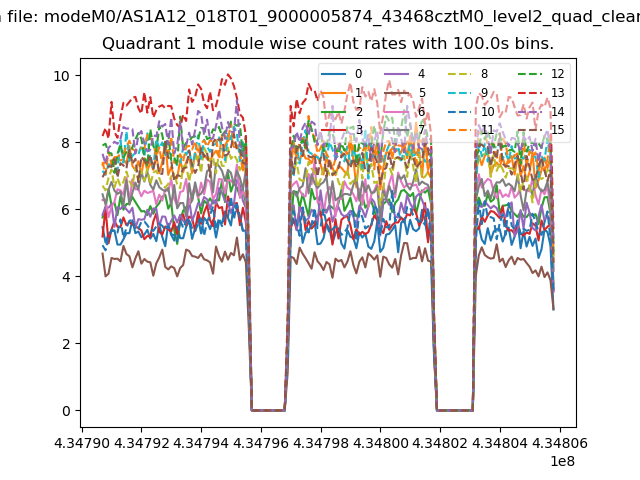
| Module-wise count rates for Quadrant A Data is divided into 100 sec bins |
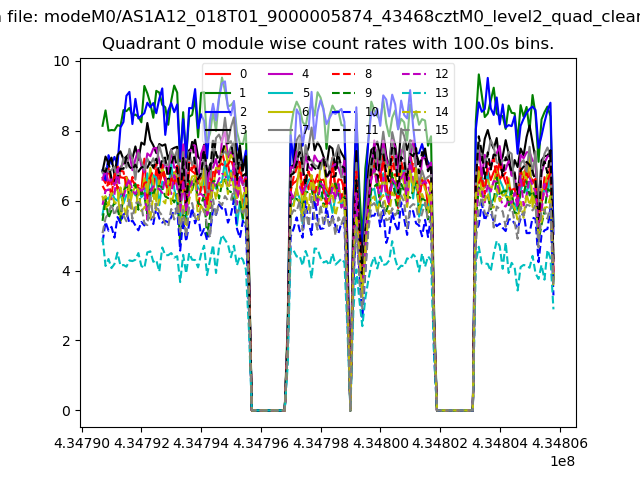 |
 |
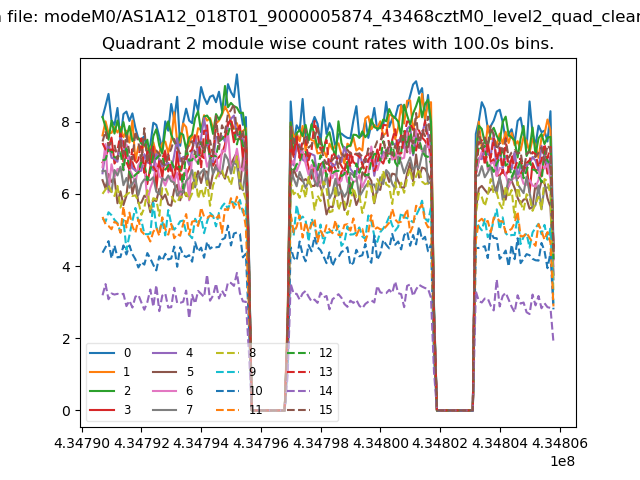
| Module-wise count rates for Quadrant B Data is divided into 100 sec bins |
 |
 |
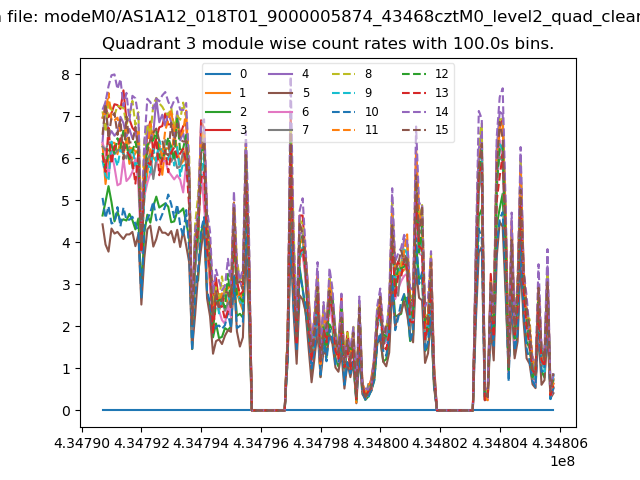
| Module-wise count rates for Quadrant C Data is divided into 100 sec bins |
 |
 |
| Module-wise count rates for Quadrant D Data is divided into 100 sec bins |
 |
 |
| Parameter | Plot |
|---|---|
| CZT HV Monitor |  |
| D_VDD | 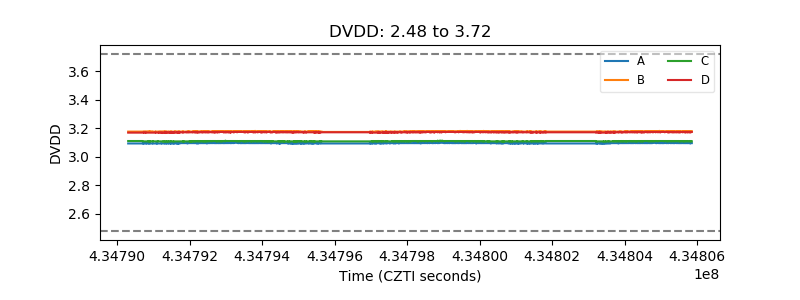 |
| Temperature 1 | 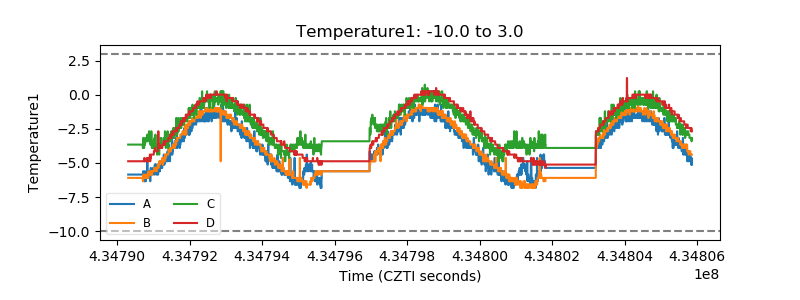 |
| Veto HV Monitor | 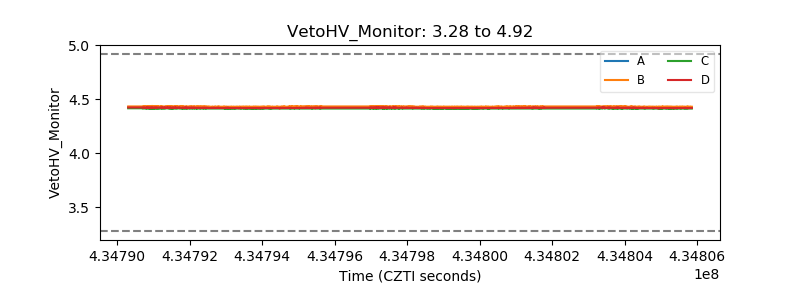 |
| Veto LLD | 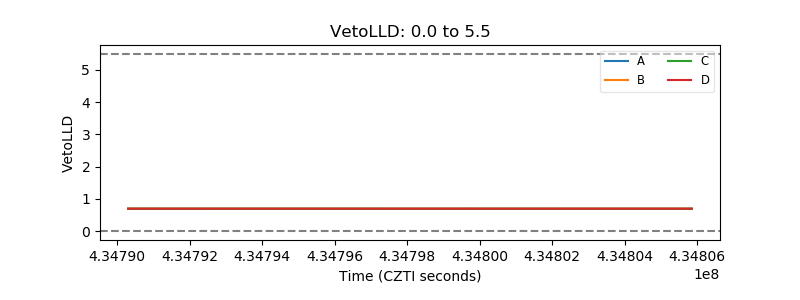 |
| Alpha Counter | 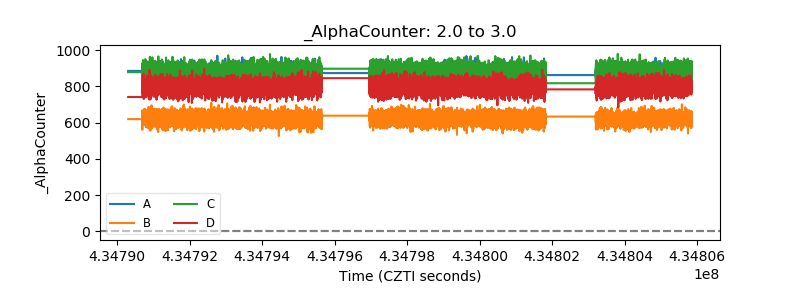 |
| _CPM_Rate | 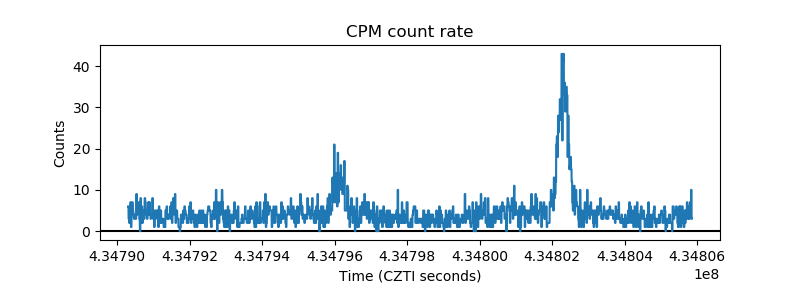 |
| CZT Counter | 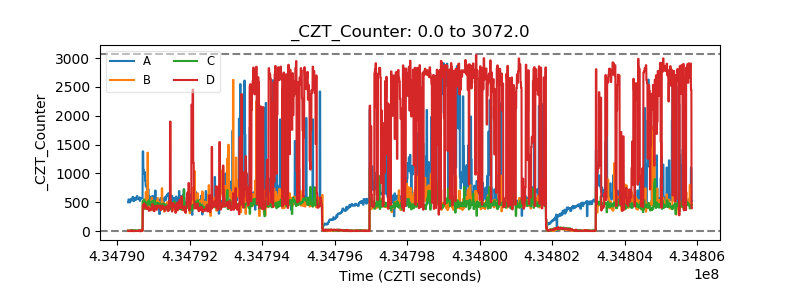 |
| +2.5 Volts monitor | 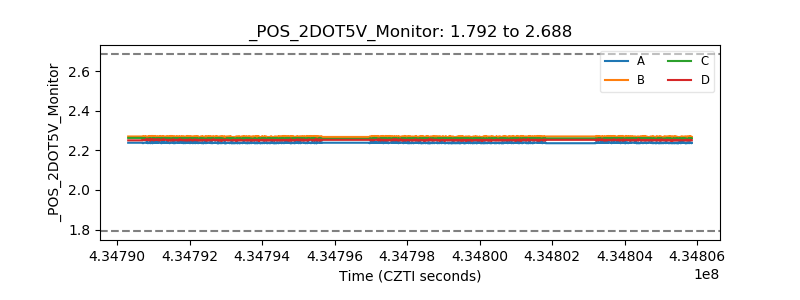 |
| +5 Volts monitor | 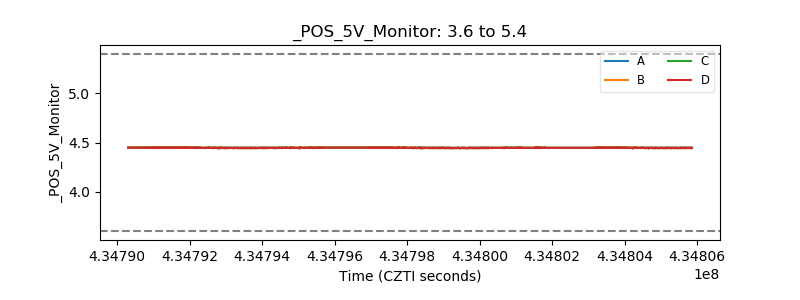 |
| _ROLL_ROT | 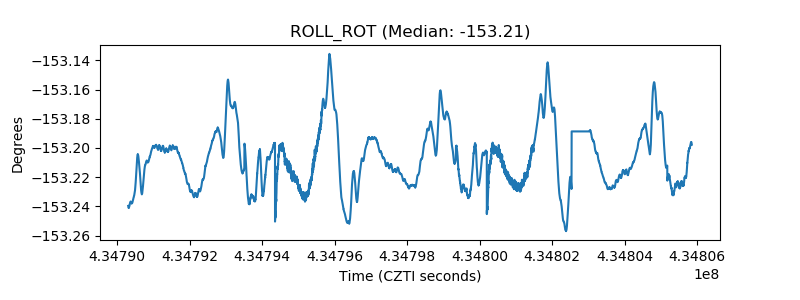 |
| _Roll_DEC | 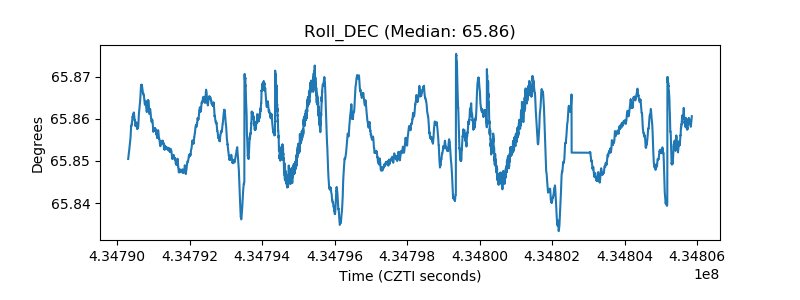 |
| _Roll_RA | 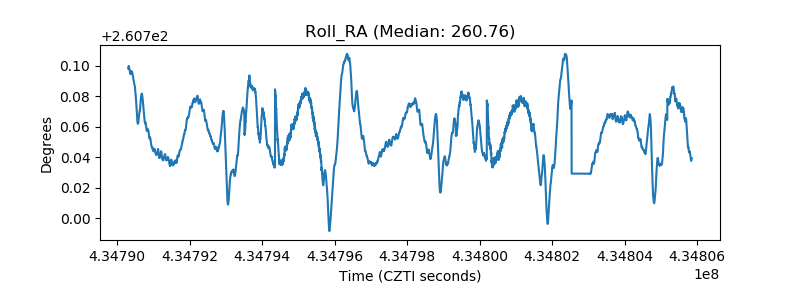 |
| Veto Counter | 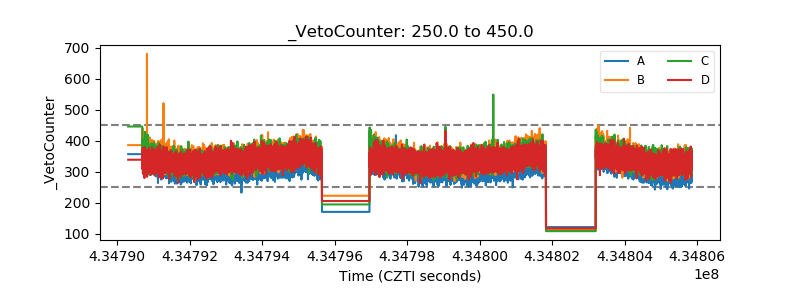 |