| Param | Original file | Final file |
|---|---|---|
| Filename | modeM0/AS1A12_018T01_9000005874_43469cztM0_level2.fits | modeM0/AS1A12_018T01_9000005874_43469cztM0_level2_quad_clean.evt |
| Size (bytes) | 759,867,840 | 126,662,400 |
| Size | 724.7 MB | 120.8 MB |
| Events in quadrant A | 5,811,022 | 917,733 |
| Events in quadrant B | 4,299,563 | 944,118 |
| Events in quadrant C | 4,118,220 | 888,326 |
| Events in quadrant D | 13,237,900 | 492,580 |
| Mode M0 | |||
|---|---|---|---|
| Quadrant | BADHDUFLAG | Total packets | Discarded packets |
| A | 0 | 22744 | 2 |
| B | 0 | 18424 | 2 |
| C | 0 | 17633 | 2 |
| D | 0 | 45126 | 4 |
| Mode M9 | |||
|---|---|---|---|
| Quadrant | BADHDUFLAG | Total packets | Discarded packets |
| A | 0 | 31 | 0 |
| B | 0 | 31 | 0 |
| C | 0 | 31 | 0 |
| D | 0 | 31 | 0 |
| Mode SS | |||
|---|---|---|---|
| Quadrant | BADHDUFLAG | Total packets | Discarded packets |
| A | 0 | 174 | 0 |
| B | 0 | 174 | 0 |
| C | 0 | 174 | 0 |
| D | 0 | 174 | 0 |
| Quadrant | Total seconds | Saturated seconds | Saturation percentage |
|---|---|---|---|
| A | 8525 | 232 | 2.721408% |
| B | 8525 | 22 | 0.258065% |
| C | 8526 | 11 | 0.129017% |
| D | 8525 | 3652 | 42.838710% |
Noise dominated data is calculated using 1-second bins in cleaned event files. If a bin has >2000 counts, and if more than 50% of those come from <1% of pixels, then it is considered to be noise-dominated and hence unusable.
| Quadrant | # 1 sec bins | Bins with >0 counts | Bins with >2000 counts | High rate bins dominated by noise | Noise dominated (total time) | Noise dominated (detector-on time) | Marked lightcurve |
|---|---|---|---|---|---|---|---|
| A | 11631 | 8527 | 193 | 193 | 1.66% | 2.26% | 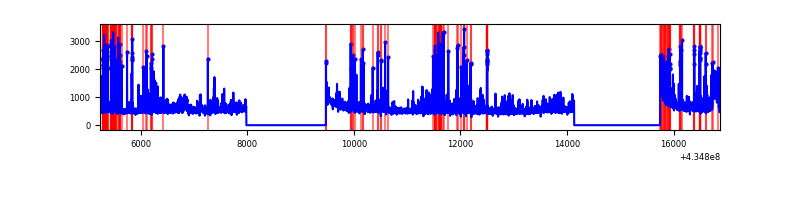 |
| B | 11631 | 8527 | 10 | 10 | 0.09% | 0.12% | 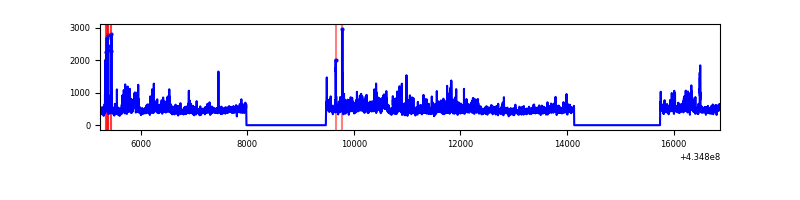 |
| C | 11632 | 8528 | 7 | 7 | 0.06% | 0.08% | 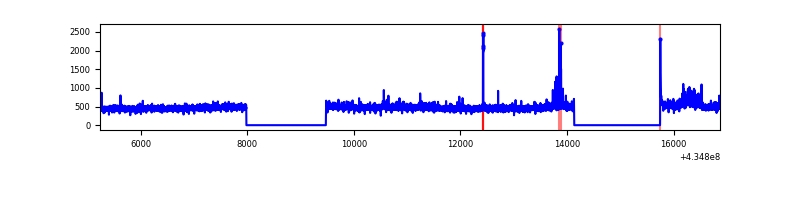 |
| D | 11631 | 8527 | 3607 | 3607 | 31.01% | 42.30% |  |
Top three noisy pixels from each quadrant. If the there are fewer than three noisy pixels in the level2.evt file, extra rows are filled as -1
| Pixel properties | Quadrant properties | ||||||
|---|---|---|---|---|---|---|---|
| Quadrant | DetID | PixID | Counts | Sigma | Mean | Median | Sigma |
| A | 15 | 222 | 906063 | 4899.2 | 901 | 883 | 184.8 |
| A | 10 | 83 | 888256 | 4802.82 | 901 | 883 | 184.8 |
| A | 15 | 237 | 474068 | 2561.07 | 901 | 883 | 184.8 |
| B | 0 | 245 | 283843 | 1629.66 | 910 | 886 | 173.6 |
| B | 0 | 189 | 170064 | 974.36 | 910 | 886 | 173.6 |
| B | 3 | 112 | 75792 | 431.41 | 910 | 886 | 173.6 |
| C | 15 | 214 | 372029 | 1766.89 | 894 | 896 | 210.0 |
| C | 3 | 233 | 199577 | 945.88 | 894 | 896 | 210.0 |
| C | 14 | 254 | 44961 | 209.78 | 894 | 896 | 210.0 |
| D | 1 | 52 | 8854203 | 54087.82 | 652 | 633 | 163.7 |
| D | 2 | 16 | 644447 | 3933.16 | 652 | 633 | 163.7 |
| D | 12 | 233 | 528741 | 3226.29 | 652 | 633 | 163.7 |
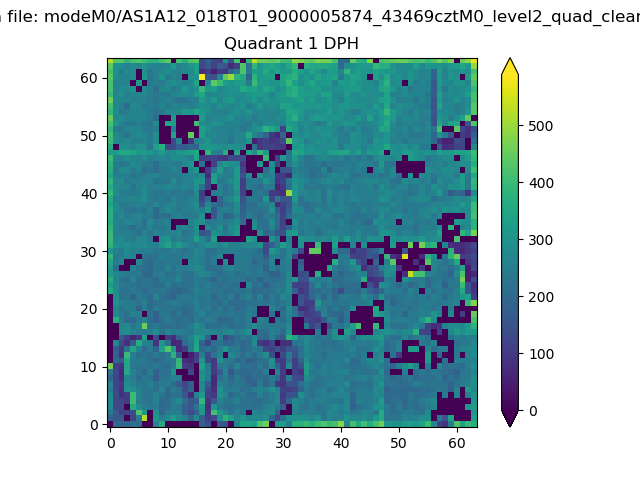
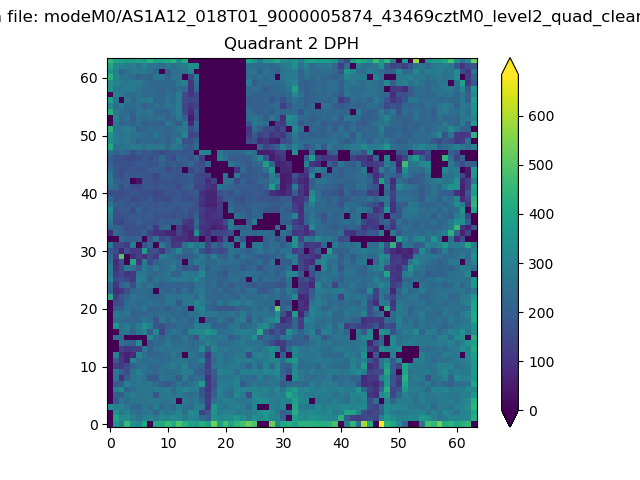
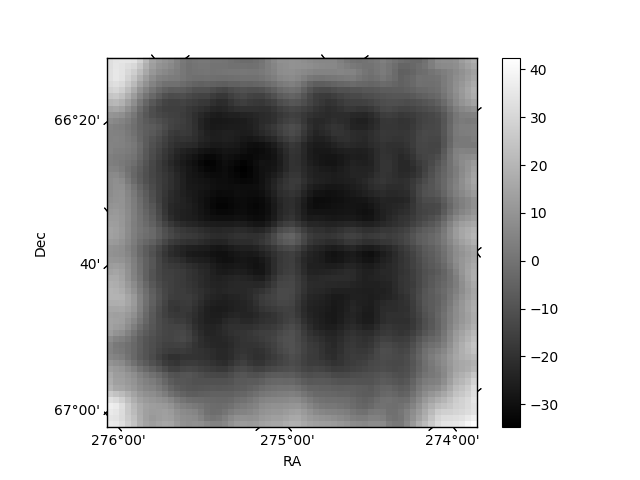
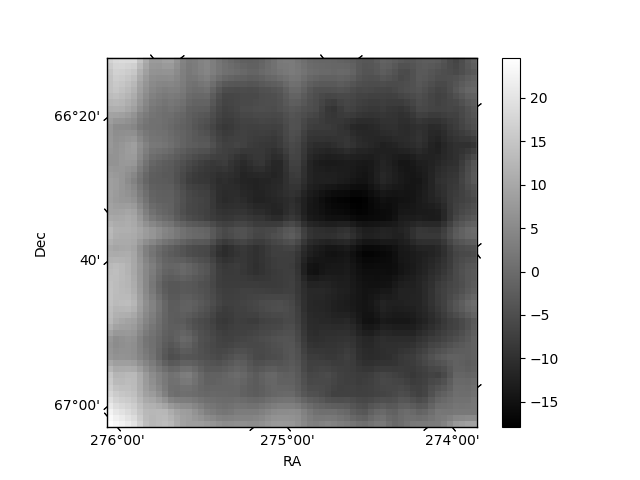
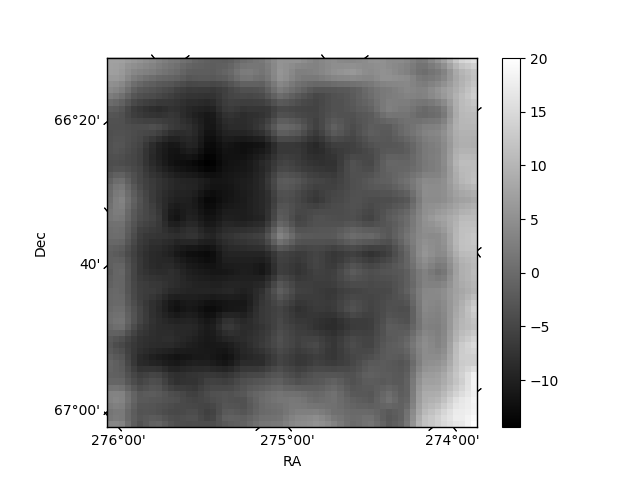
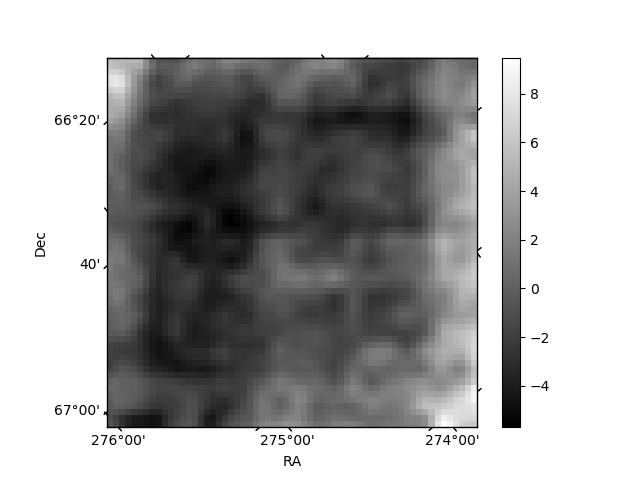
Histogram calculated using DETX and DETY for each event in the final _common_clean file
| Quadrant A | 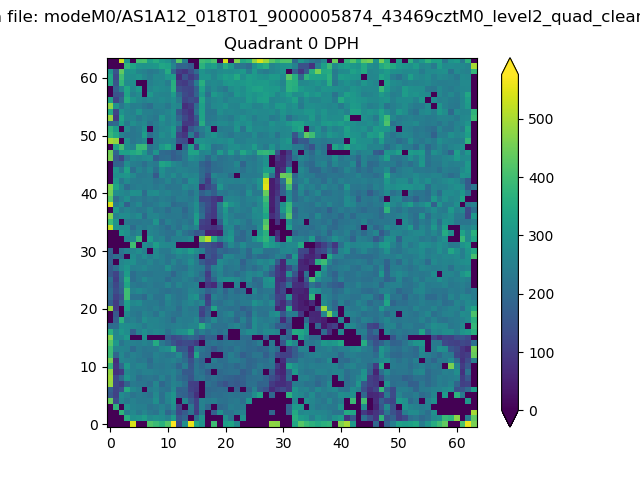 |
 |
Quadrant B |
|---|---|---|---|
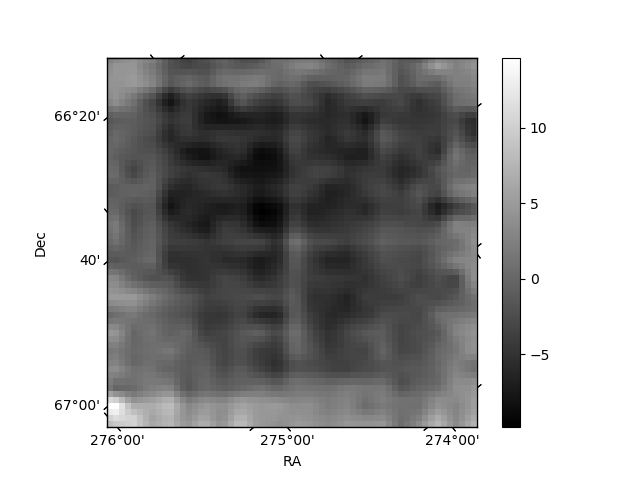
| Quadrant D | 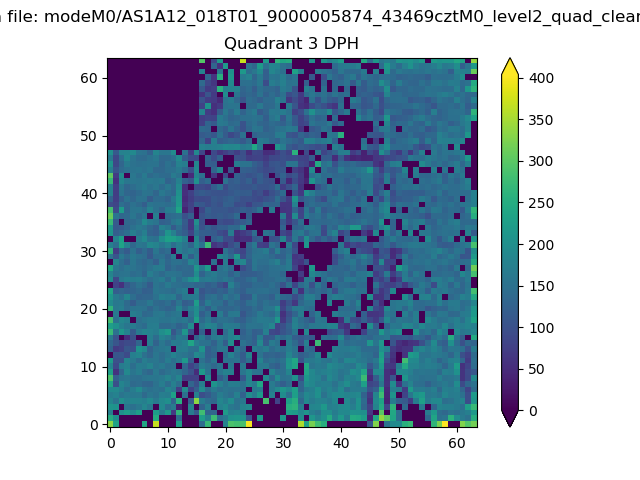 |
 |
Quadrant C |
| Plot type | Count rate plots | Images |
|---|---|---|
| Comparison with Poisson distribution Blue bars denote a histogram of data divided into 1 sec bins. Red curve is a Poisson curve with rate = median count rate of data. |
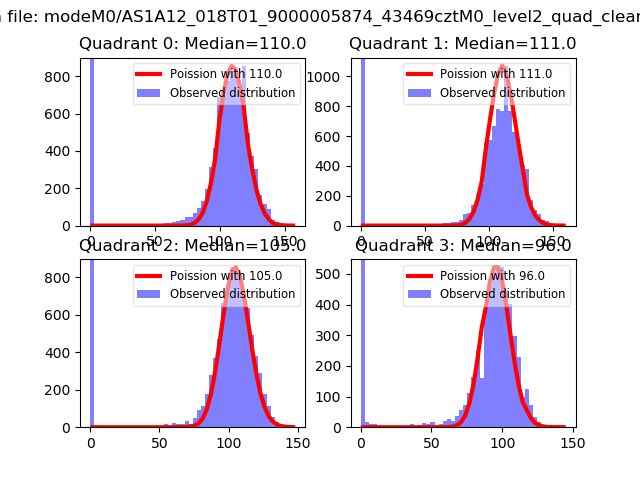 |
 |
| Quadrant-wise count rates Data is divided into 100 sec bins |
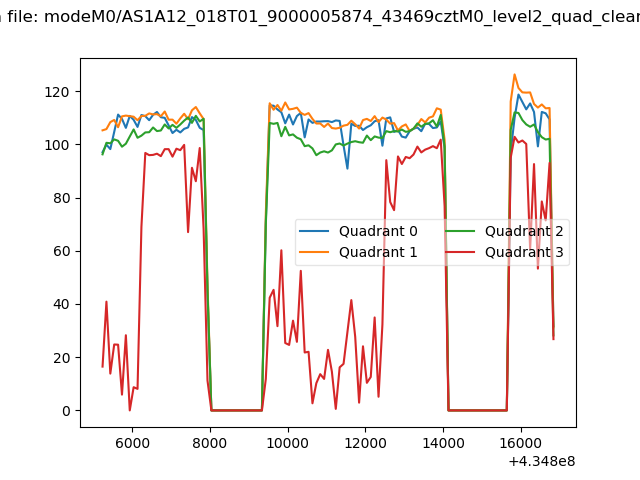 |
|
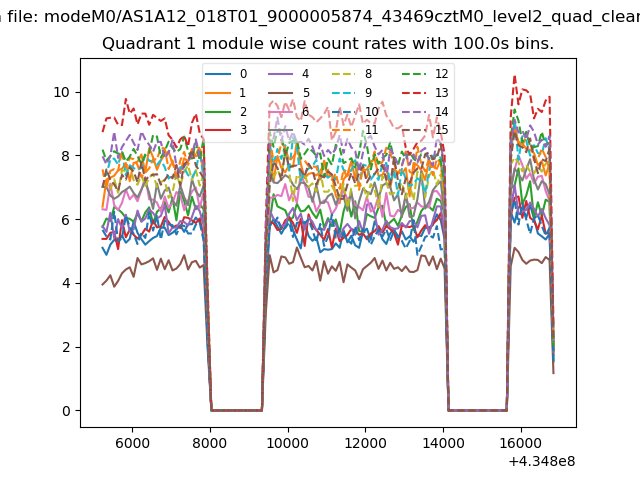
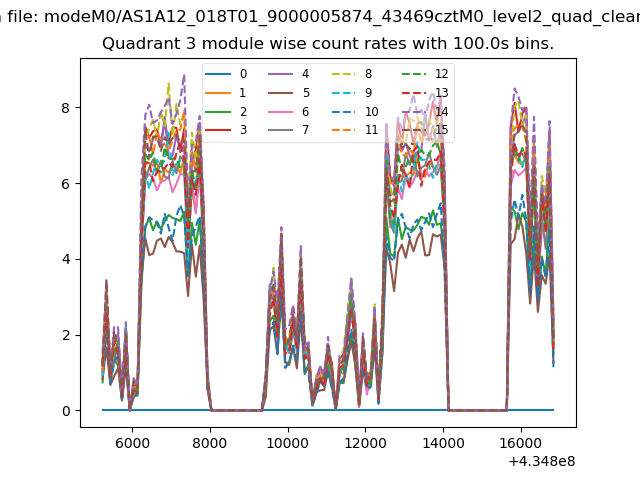
| Module-wise count rates for Quadrant A Data is divided into 100 sec bins |
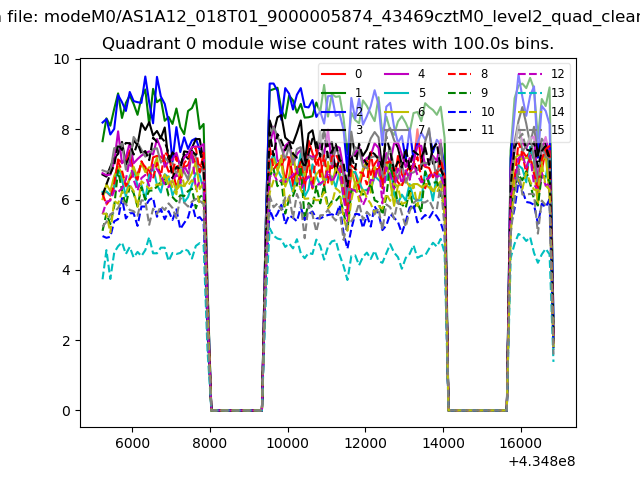 |
 |
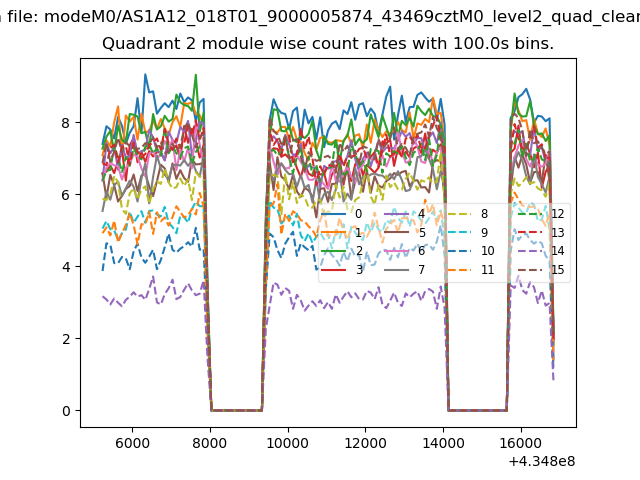
| Module-wise count rates for Quadrant B Data is divided into 100 sec bins |
 |
 |
| Module-wise count rates for Quadrant C Data is divided into 100 sec bins |
 |
 |
| Module-wise count rates for Quadrant D Data is divided into 100 sec bins |
 |
 |
| Parameter | Plot |
|---|---|
| CZT HV Monitor |  |
| D_VDD | 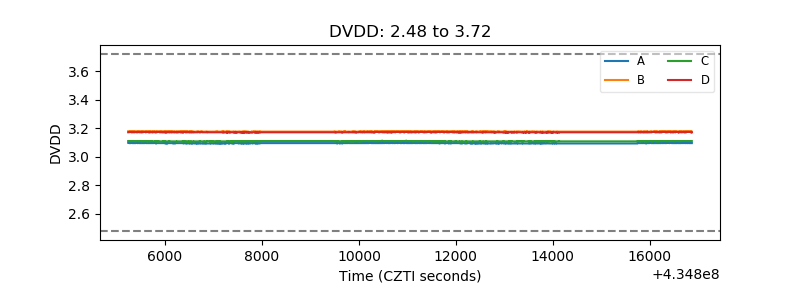 |
| Temperature 1 | 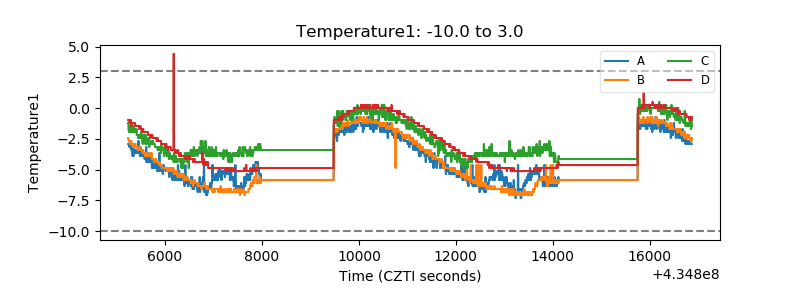 |
| Veto HV Monitor | 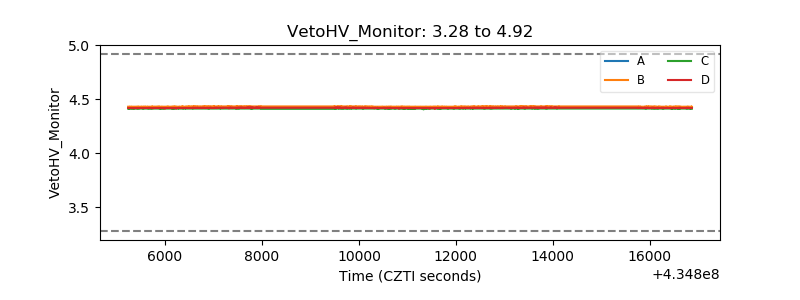 |
| Veto LLD | 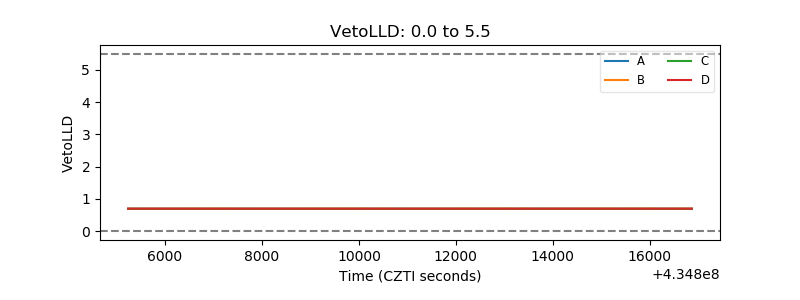 |
| Alpha Counter | 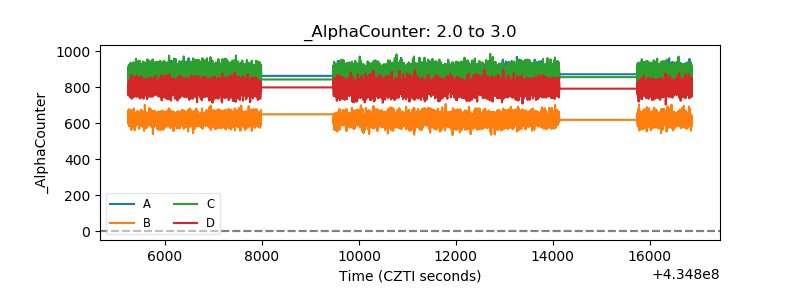 |
| _CPM_Rate | 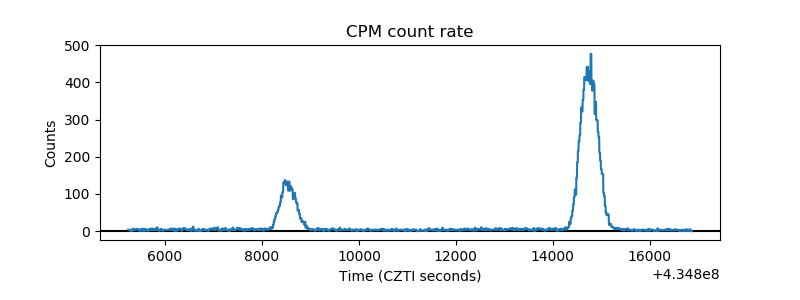 |
| CZT Counter | 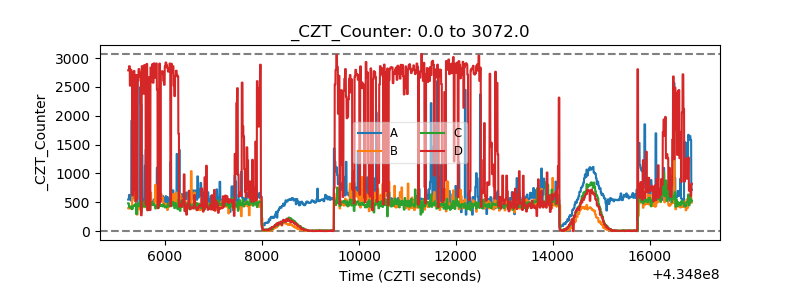 |
| +2.5 Volts monitor | 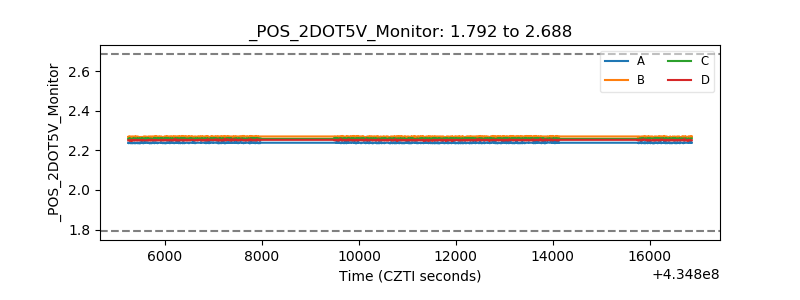 |
| +5 Volts monitor | 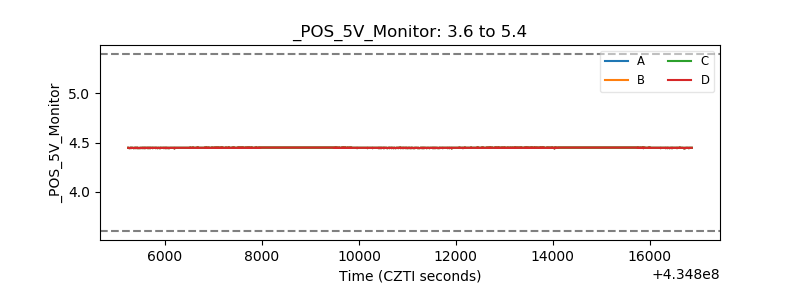 |
| _ROLL_ROT | 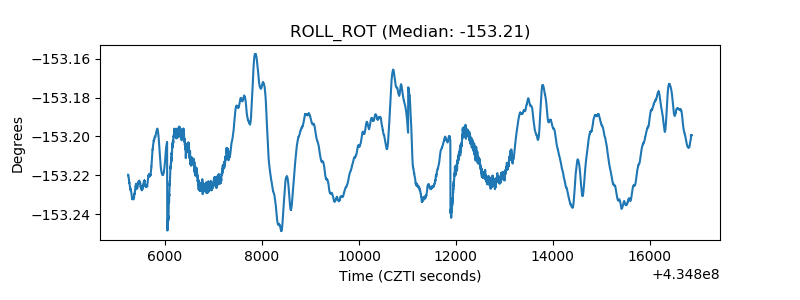 |
| _Roll_DEC | 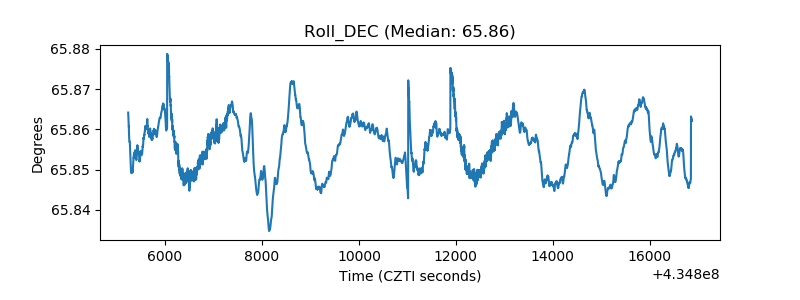 |
| _Roll_RA | 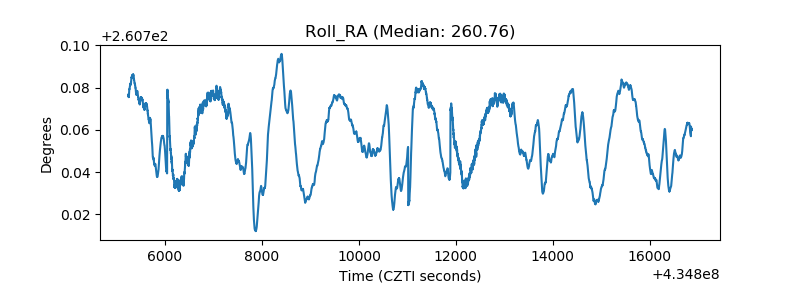 |
| Veto Counter | 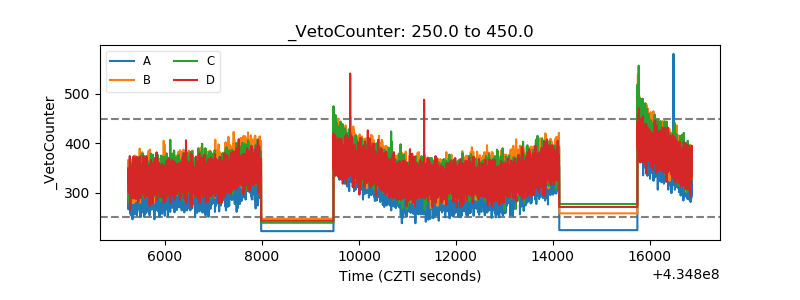 |