| Param | Original file | Final file |
|---|---|---|
| Filename | modeM0/AS1A12_018T01_9000005874_43471cztM0_level2.fits | modeM0/AS1A12_018T01_9000005874_43471cztM0_level2_quad_clean.evt |
| Size (bytes) | 456,707,520 | 84,231,360 |
| Size | 435.6 MB | 80.3 MB |
| Events in quadrant A | 5,252,260 | 527,049 |
| Events in quadrant B | 2,667,879 | 604,329 |
| Events in quadrant C | 2,573,466 | 571,124 |
| Events in quadrant D | 5,997,050 | 473,838 |
| Mode M0 | |||
|---|---|---|---|
| Quadrant | BADHDUFLAG | Total packets | Discarded packets |
| A | 0 | 19076 | 1 |
| B | 0 | 11566 | 1 |
| C | 0 | 11087 | 1 |
| D | 0 | 21556 | 1 |
| Mode M9 | |||
|---|---|---|---|
| Quadrant | BADHDUFLAG | Total packets | Discarded packets |
| A | 0 | 18 | 0 |
| B | 0 | 18 | 0 |
| C | 0 | 18 | 0 |
| D | 0 | 18 | 0 |
| Mode SS | |||
|---|---|---|---|
| Quadrant | BADHDUFLAG | Total packets | Discarded packets |
| A | 0 | 108 | 0 |
| B | 0 | 108 | 0 |
| C | 0 | 108 | 0 |
| D | 0 | 108 | 0 |
| Quadrant | Total seconds | Saturated seconds | Saturation percentage |
|---|---|---|---|
| A | 5341 | 861 | 16.120577% |
| B | 5341 | 23 | 0.430631% |
| C | 5341 | 3 | 0.056169% |
| D | 5341 | 719 | 13.461899% |
Noise dominated data is calculated using 1-second bins in cleaned event files. If a bin has >2000 counts, and if more than 50% of those come from <1% of pixels, then it is considered to be noise-dominated and hence unusable.
| Quadrant | # 1 sec bins | Bins with >0 counts | Bins with >2000 counts | High rate bins dominated by noise | Noise dominated (total time) | Noise dominated (detector-on time) | Marked lightcurve |
|---|---|---|---|---|---|---|---|
| A | 7104 | 5341 | 764 | 764 | 10.75% | 14.30% | 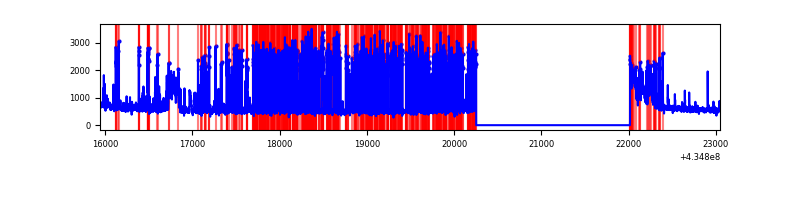 |
| B | 7104 | 5342 | 14 | 14 | 0.20% | 0.26% | 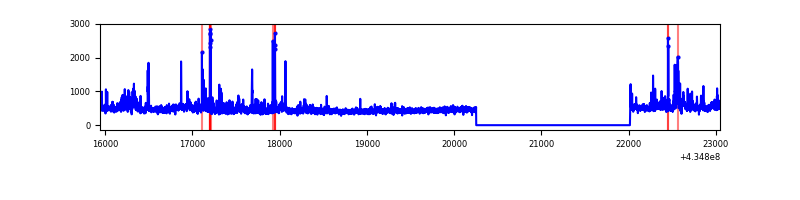 |
| C | 7104 | 5342 | 0 | 0 | 0.00% | 0.00% | 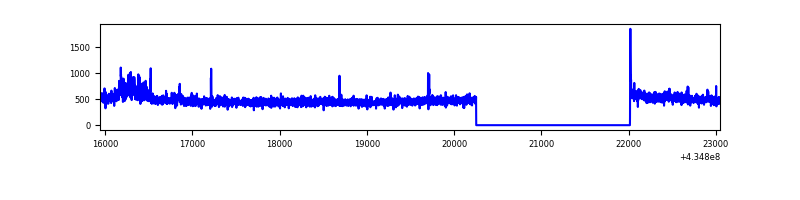 |
| D | 7104 | 5342 | 754 | 754 | 10.61% | 14.11% | 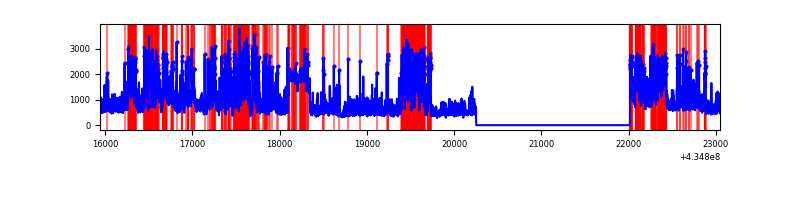 |
Top three noisy pixels from each quadrant. If the there are fewer than three noisy pixels in the level2.evt file, extra rows are filled as -1
| Pixel properties | Quadrant properties | ||||||
|---|---|---|---|---|---|---|---|
| Quadrant | DetID | PixID | Counts | Sigma | Mean | Median | Sigma |
| A | 15 | 222 | 2394291 | 21633.29 | 536 | 524 | 110.7 |
| A | 10 | 83 | 549284 | 4959.33 | 536 | 524 | 110.7 |
| A | 15 | 237 | 202830 | 1828.31 | 536 | 524 | 110.7 |
| B | 0 | 245 | 148391 | 1360.93 | 570 | 557 | 108.6 |
| B | 0 | 189 | 122323 | 1120.96 | 570 | 557 | 108.6 |
| B | 3 | 112 | 38584 | 350.07 | 570 | 557 | 108.6 |
| C | 15 | 214 | 233747 | 1755.73 | 564 | 566 | 132.8 |
| C | 3 | 233 | 132730 | 995.13 | 564 | 566 | 132.8 |
| C | 13 | 61 | 3804 | 24.38 | 564 | 566 | 132.8 |
| D | 12 | 233 | 1393358 | 10776.54 | 534 | 519 | 129.2 |
| D | 2 | 16 | 1258519 | 9733.28 | 534 | 519 | 129.2 |
| D | 1 | 52 | 799909 | 6184.96 | 534 | 519 | 129.2 |
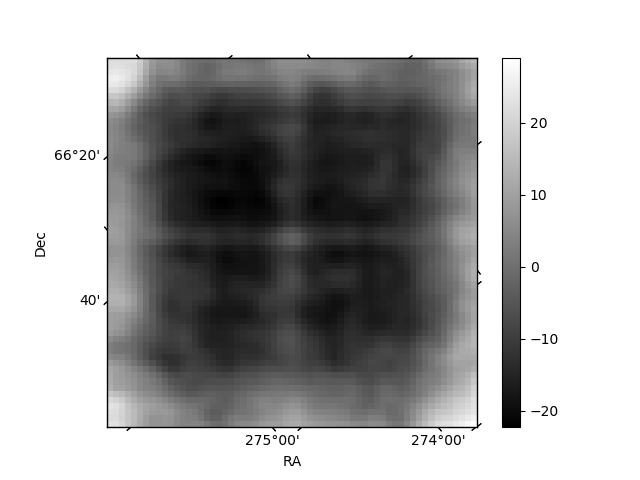
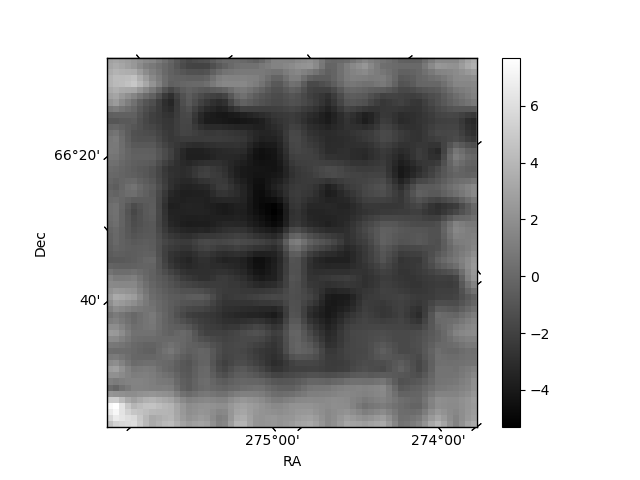
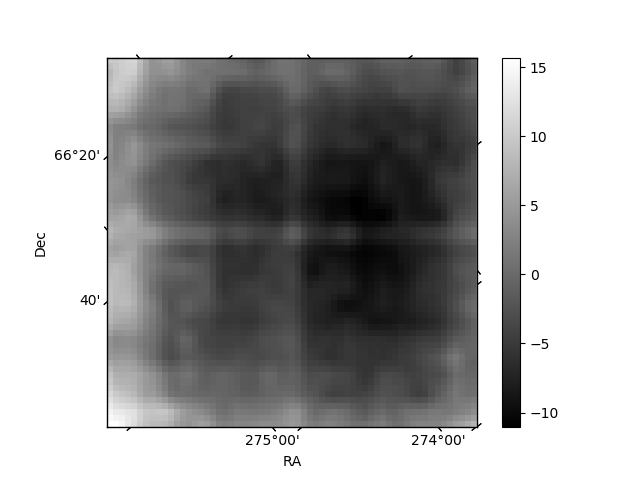
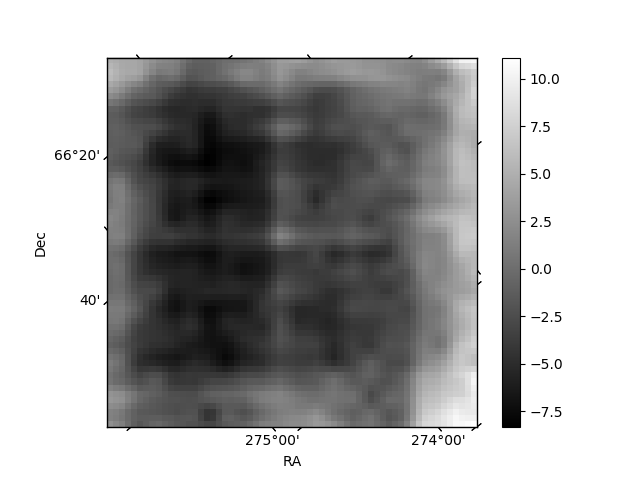
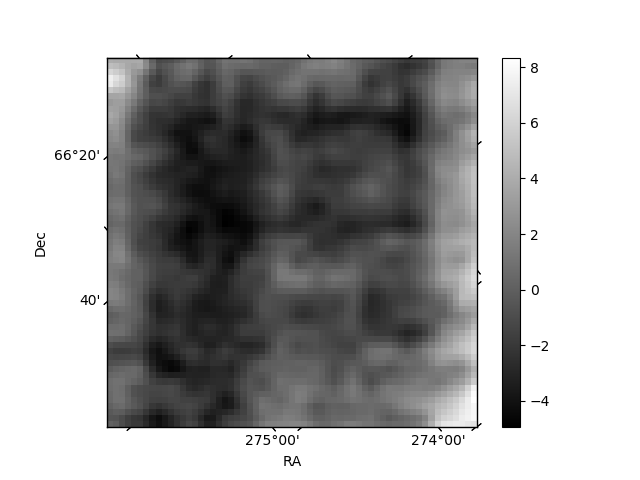
Histogram calculated using DETX and DETY for each event in the final _common_clean file
| Quadrant A | 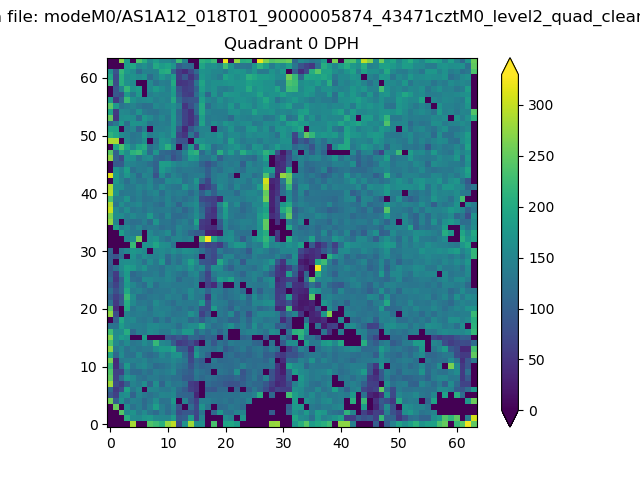 |
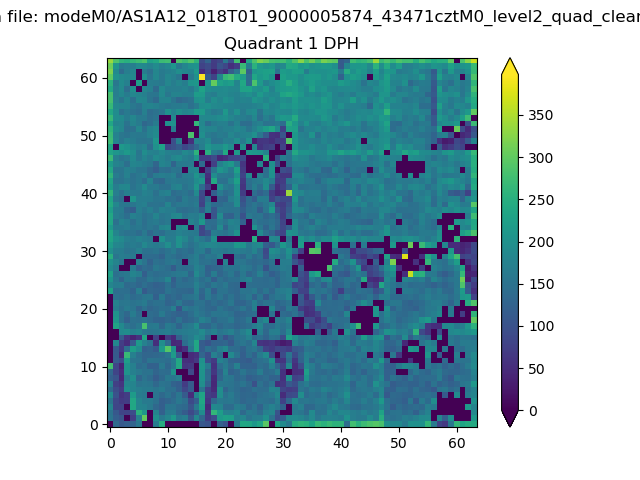 |
Quadrant B |
|---|---|---|---|
| Quadrant D | 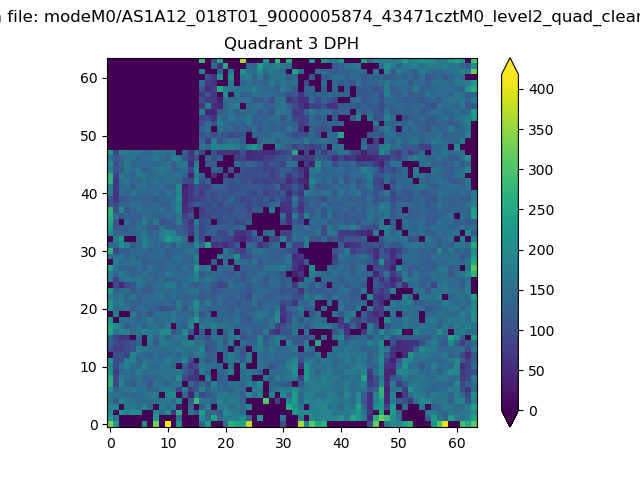 |
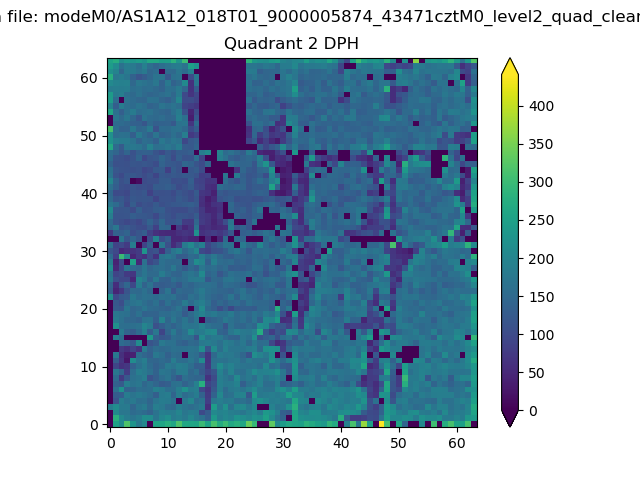 |
Quadrant C |
| Plot type | Count rate plots | Images |
|---|---|---|
| Comparison with Poisson distribution Blue bars denote a histogram of data divided into 1 sec bins. Red curve is a Poisson curve with rate = median count rate of data. |
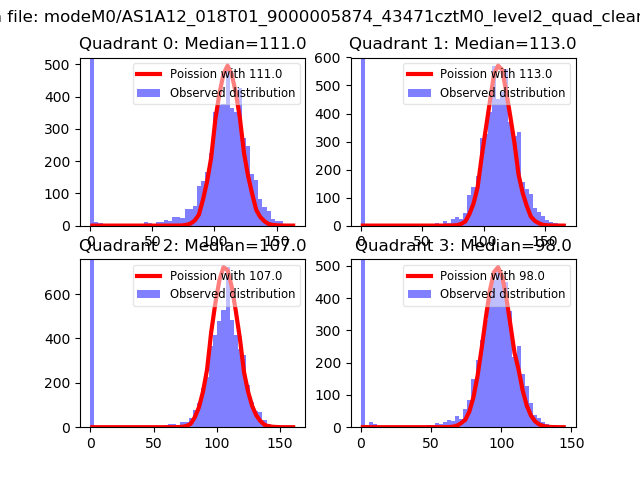 |
 |
| Quadrant-wise count rates Data is divided into 100 sec bins |
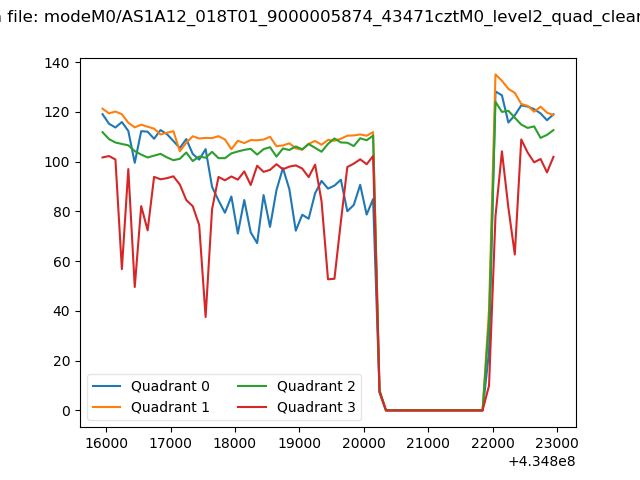 |
|
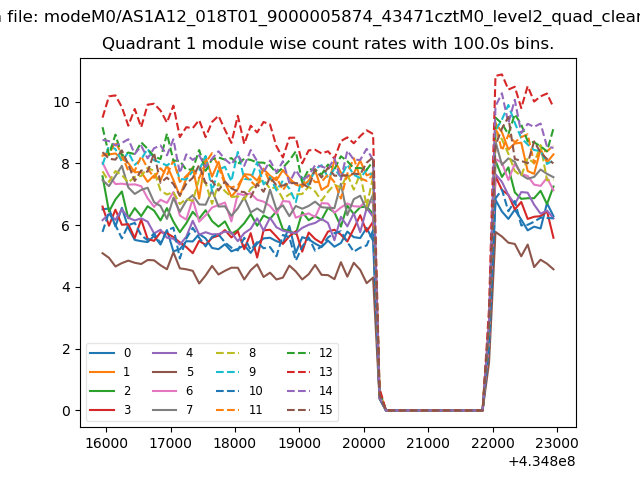
| Module-wise count rates for Quadrant A Data is divided into 100 sec bins |
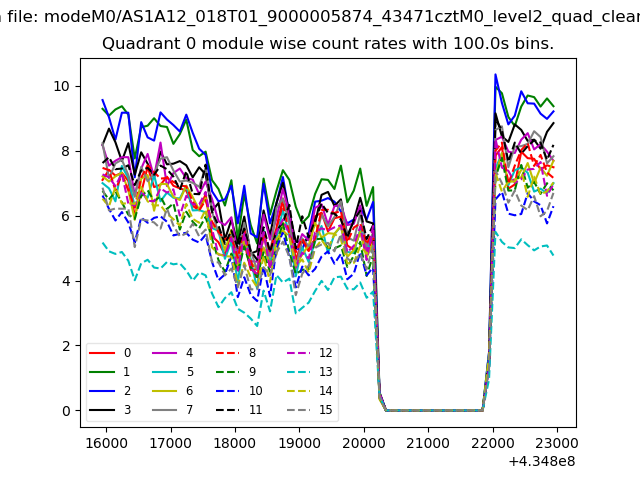 |
 |
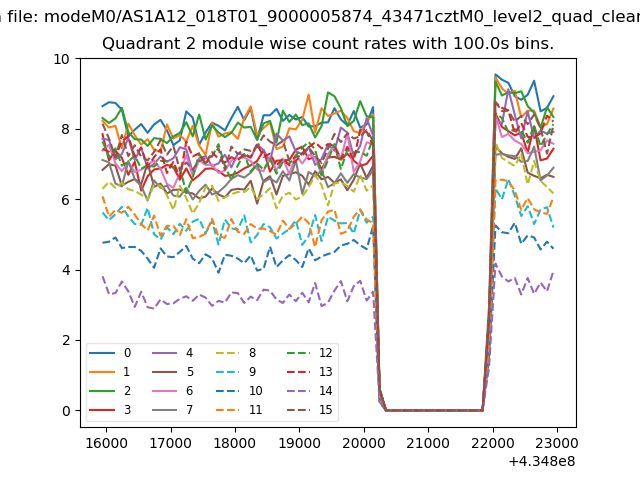
| Module-wise count rates for Quadrant B Data is divided into 100 sec bins |
 |
 |
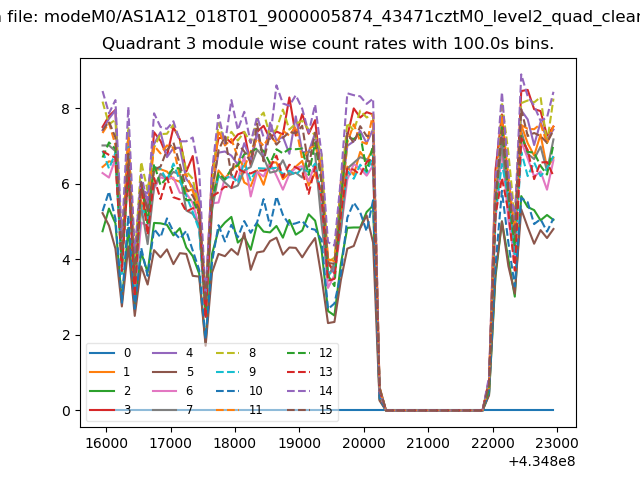
| Module-wise count rates for Quadrant C Data is divided into 100 sec bins |
 |
 |
| Module-wise count rates for Quadrant D Data is divided into 100 sec bins |
 |
 |
| Parameter | Plot |
|---|---|
| CZT HV Monitor | 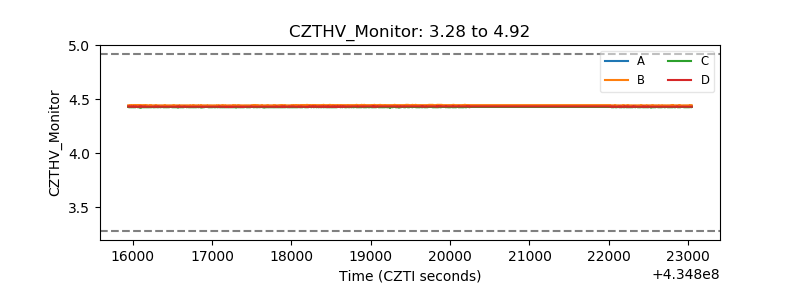 |
| D_VDD | 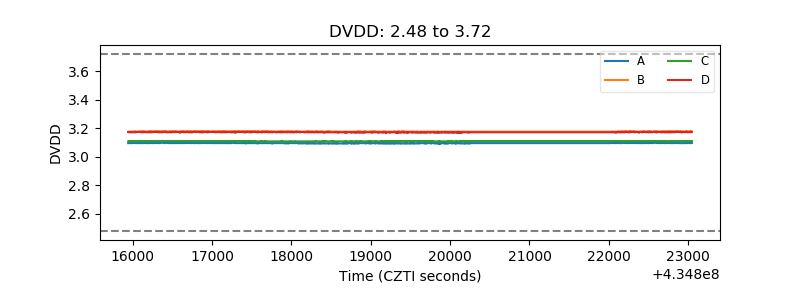 |
| Temperature 1 | 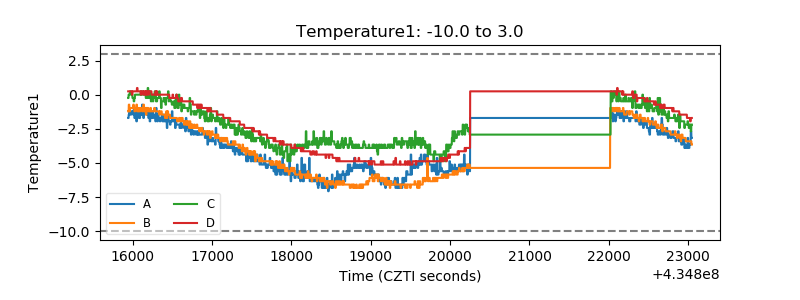 |
| Veto HV Monitor |  |
| Veto LLD | 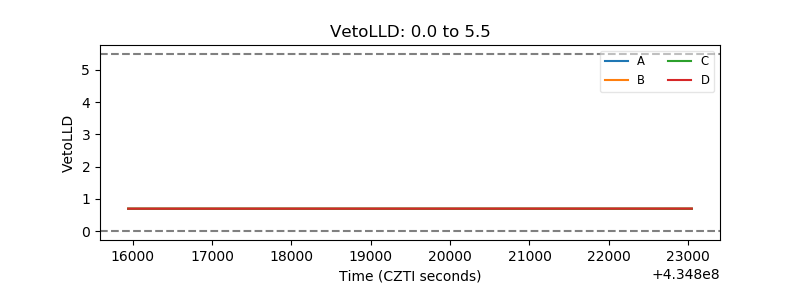 |
| Alpha Counter | 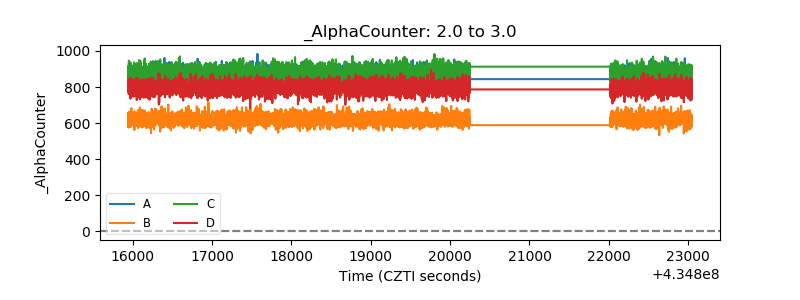 |
| _CPM_Rate | 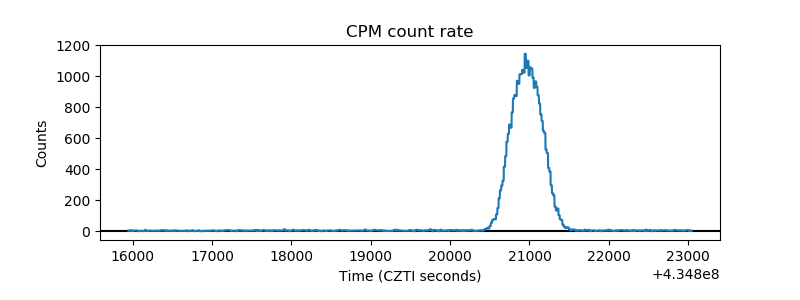 |
| CZT Counter | 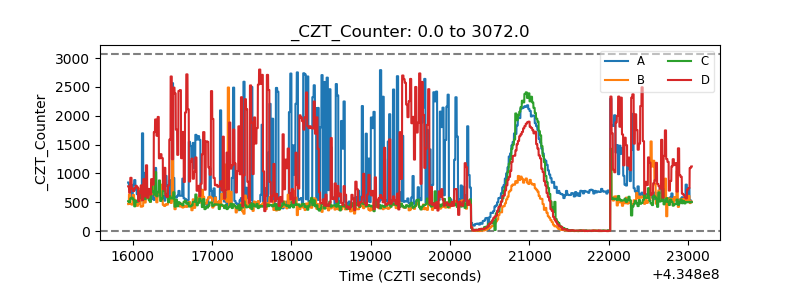 |
| +2.5 Volts monitor | 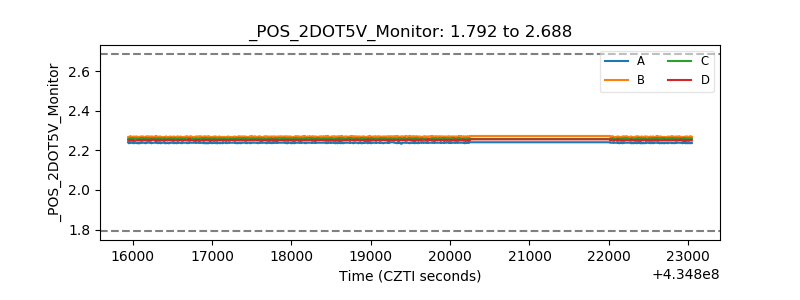 |
| +5 Volts monitor | 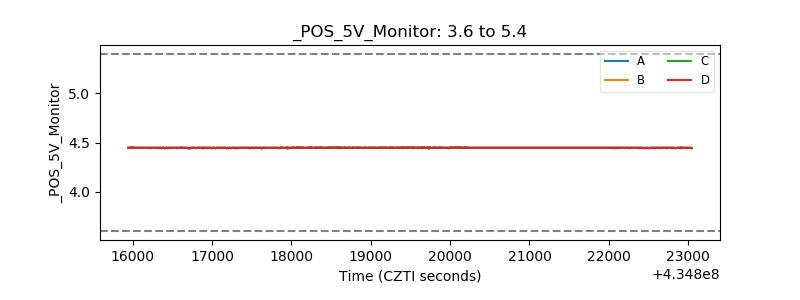 |
| _ROLL_ROT | 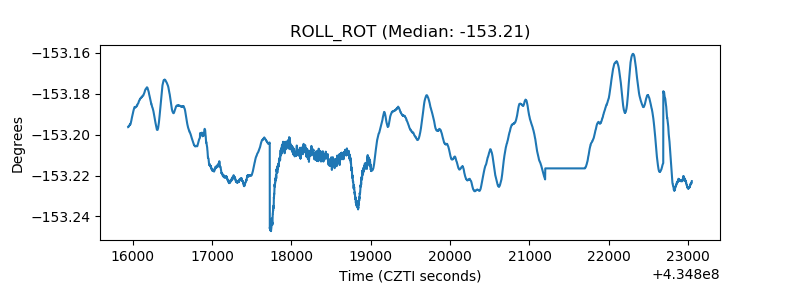 |
| _Roll_DEC | 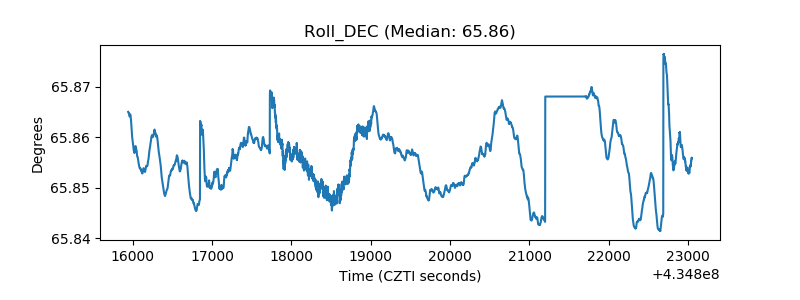 |
| _Roll_RA | 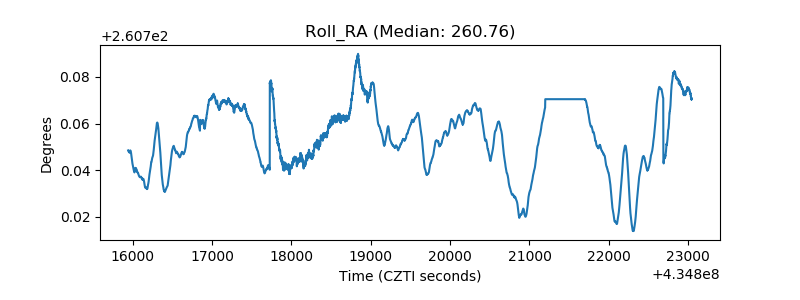 |
| Veto Counter |  |