| Param | Original file | Final file |
|---|---|---|
| Filename | modeM0/AS1A12_018T01_9000005874_43472cztM0_level2.fits | modeM0/AS1A12_018T01_9000005874_43472cztM0_level2_quad_clean.evt |
| Size (bytes) | 351,316,800 | 88,194,240 |
| Size | 335.0 MB | 84.1 MB |
| Events in quadrant A | 3,429,618 | 590,375 |
| Events in quadrant B | 2,657,900 | 609,745 |
| Events in quadrant C | 2,472,126 | 582,985 |
| Events in quadrant D | 4,043,261 | 525,982 |
| Mode M0 | |||
|---|---|---|---|
| Quadrant | BADHDUFLAG | Total packets | Discarded packets |
| A | 0 | 13440 | 2 |
| B | 0 | 11419 | 2 |
| C | 0 | 10612 | 2 |
| D | 0 | 15656 | 2 |
| Mode M9 | |||
|---|---|---|---|
| Quadrant | BADHDUFLAG | Total packets | Discarded packets |
| A | 0 | 22 | 0 |
| B | 0 | 23 | 0 |
| C | 0 | 23 | 0 |
| D | 0 | 23 | 0 |
| Mode SS | |||
|---|---|---|---|
| Quadrant | BADHDUFLAG | Total packets | Discarded packets |
| A | 0 | 104 | 0 |
| B | 0 | 104 | 0 |
| C | 0 | 104 | 0 |
| D | 0 | 104 | 0 |
| Quadrant | Total seconds | Saturated seconds | Saturation percentage |
|---|---|---|---|
| A | 5160 | 150 | 2.906977% |
| B | 5160 | 34 | 0.658915% |
| C | 5160 | 3 | 0.058140% |
| D | 5160 | 225 | 4.360465% |
Noise dominated data is calculated using 1-second bins in cleaned event files. If a bin has >2000 counts, and if more than 50% of those come from <1% of pixels, then it is considered to be noise-dominated and hence unusable.
| Quadrant | # 1 sec bins | Bins with >0 counts | Bins with >2000 counts | High rate bins dominated by noise | Noise dominated (total time) | Noise dominated (detector-on time) | Marked lightcurve |
|---|---|---|---|---|---|---|---|
| A | 7042 | 5160 | 110 | 110 | 1.56% | 2.13% | 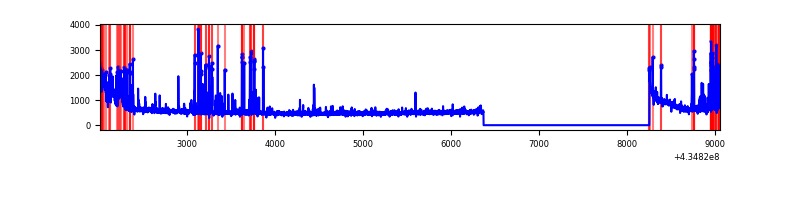 |
| B | 7043 | 5161 | 20 | 20 | 0.28% | 0.39% | 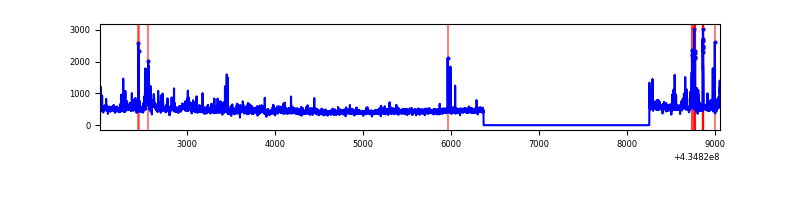 |
| C | 7043 | 5161 | 0 | 0 | 0.00% | 0.00% | 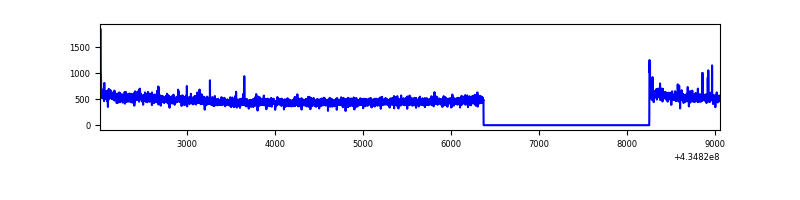 |
| D | 7043 | 5161 | 205 | 205 | 2.91% | 3.97% | 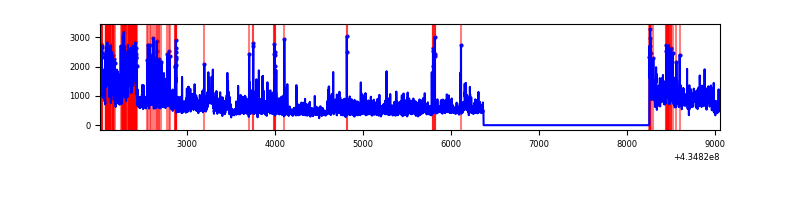 |
Top three noisy pixels from each quadrant. If the there are fewer than three noisy pixels in the level2.evt file, extra rows are filled as -1
| Pixel properties | Quadrant properties | ||||||
|---|---|---|---|---|---|---|---|
| Quadrant | DetID | PixID | Counts | Sigma | Mean | Median | Sigma |
| A | 10 | 83 | 619098 | 5426.65 | 555 | 544 | 114.0 |
| A | 15 | 222 | 420128 | 3681.06 | 555 | 544 | 114.0 |
| A | 15 | 237 | 206280 | 1804.95 | 555 | 544 | 114.0 |
| B | 0 | 245 | 151803 | 1420.72 | 562 | 547 | 106.5 |
| B | 0 | 189 | 112050 | 1047.33 | 562 | 547 | 106.5 |
| B | 0 | 199 | 52702 | 489.88 | 562 | 547 | 106.5 |
| C | 15 | 214 | 226862 | 1740.62 | 559 | 564 | 130.0 |
| C | 3 | 233 | 49090 | 373.25 | 559 | 564 | 130.0 |
| C | 14 | 254 | 7804 | 55.69 | 559 | 564 | 130.0 |
| D | 2 | 16 | 778658 | 5874.28 | 544 | 529 | 132.5 |
| D | 12 | 233 | 469483 | 3540.25 | 544 | 529 | 132.5 |
| D | 1 | 52 | 227818 | 1715.86 | 544 | 529 | 132.5 |
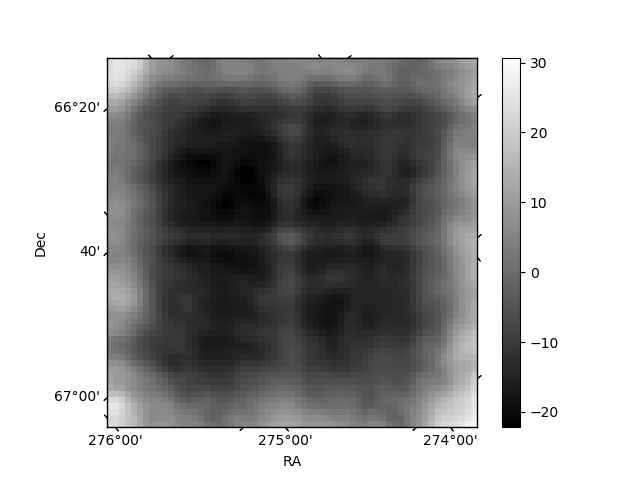
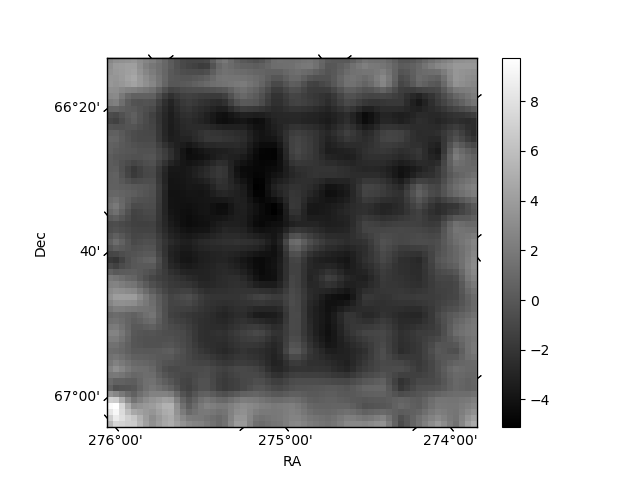
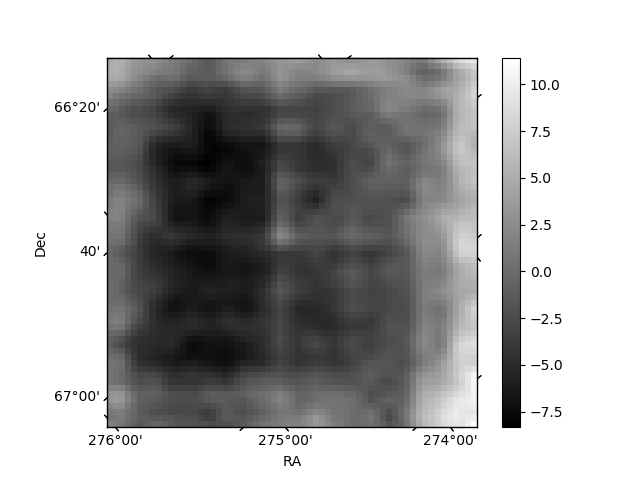
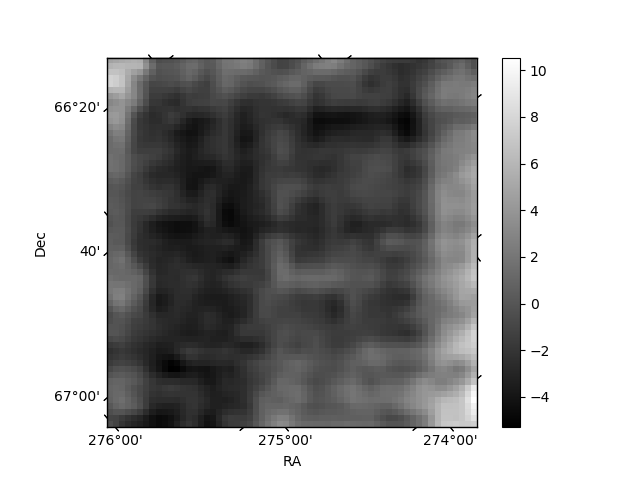
Histogram calculated using DETX and DETY for each event in the final _common_clean file
| Quadrant A | 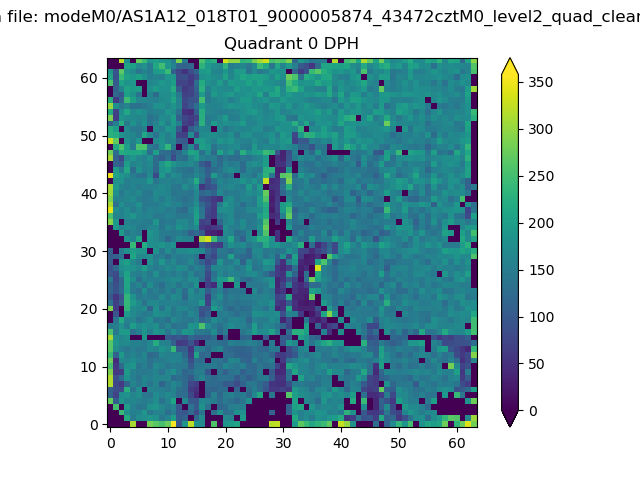 |
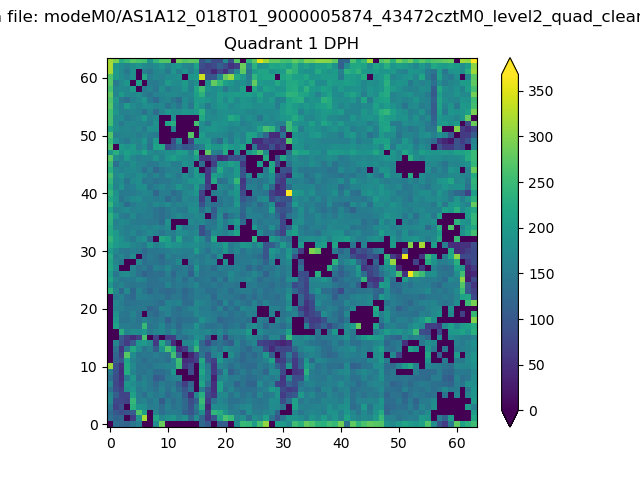 |
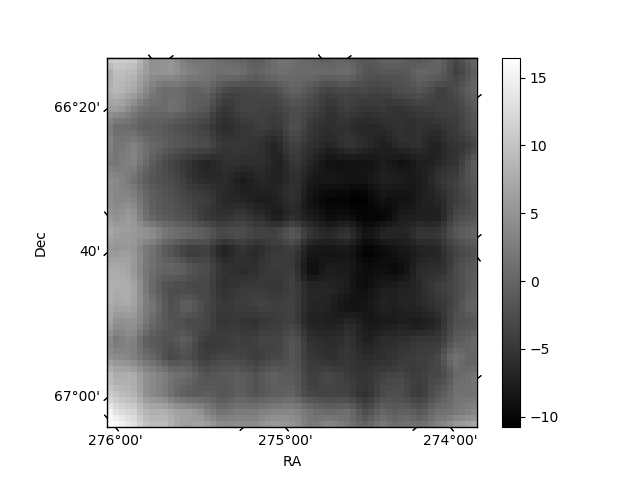
Quadrant B |
|---|---|---|---|
| Quadrant D | 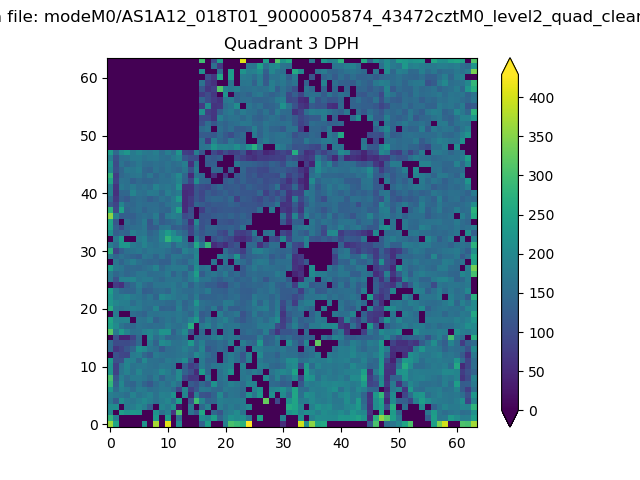 |
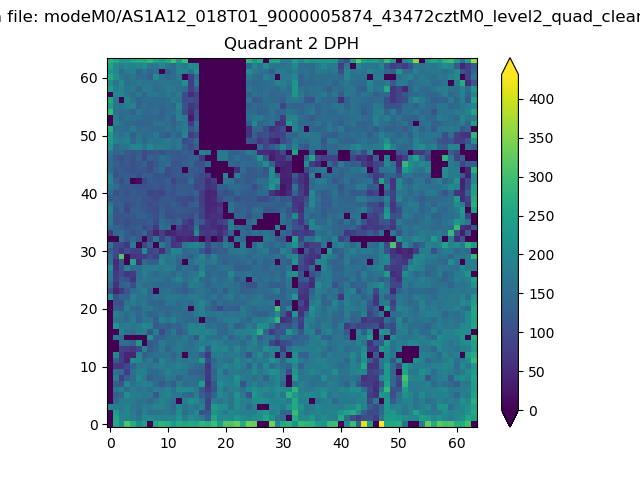 |
Quadrant C |
| Plot type | Count rate plots | Images |
|---|---|---|
| Comparison with Poisson distribution Blue bars denote a histogram of data divided into 1 sec bins. Red curve is a Poisson curve with rate = median count rate of data. |
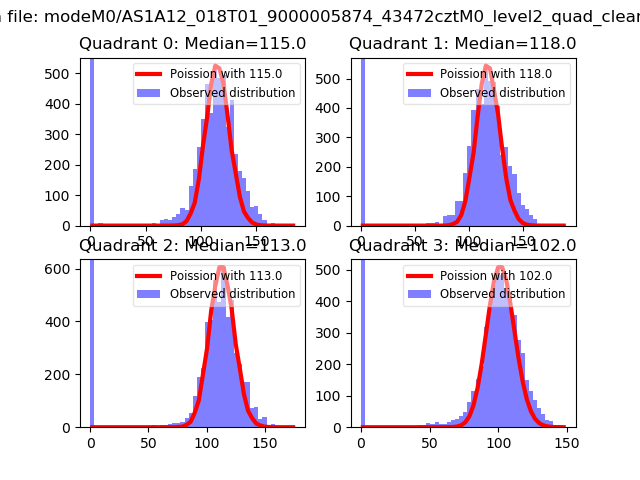 |
 |
| Quadrant-wise count rates Data is divided into 100 sec bins |
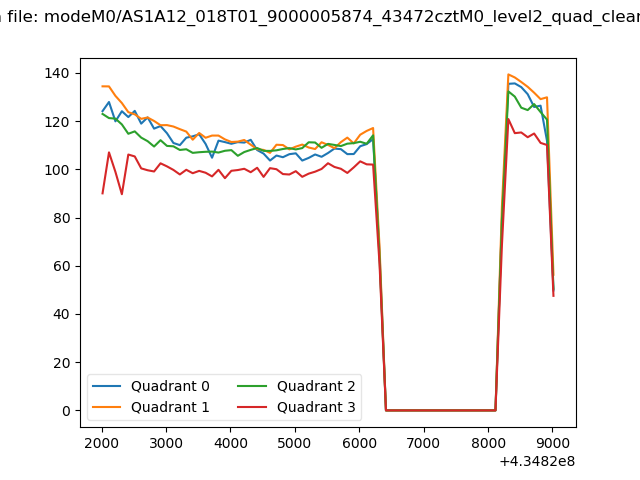 |
|
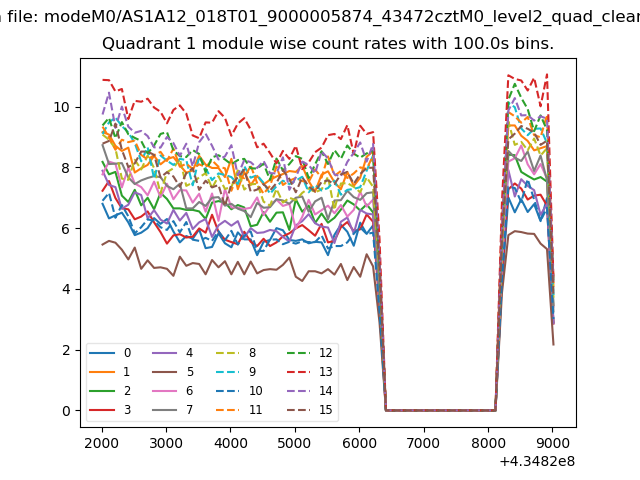
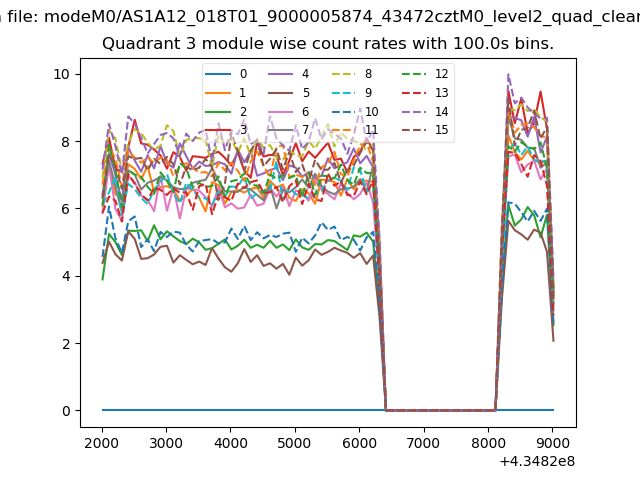
| Module-wise count rates for Quadrant A Data is divided into 100 sec bins |
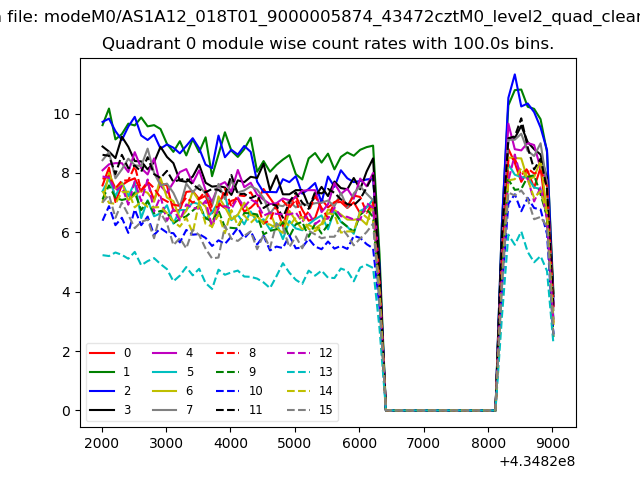 |
 |
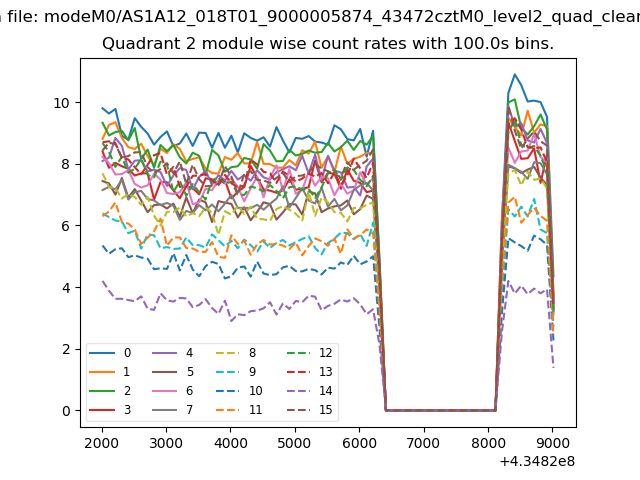
| Module-wise count rates for Quadrant B Data is divided into 100 sec bins |
 |
 |
| Module-wise count rates for Quadrant C Data is divided into 100 sec bins |
 |
 |
| Module-wise count rates for Quadrant D Data is divided into 100 sec bins |
 |
 |
| Parameter | Plot |
|---|---|
| CZT HV Monitor | 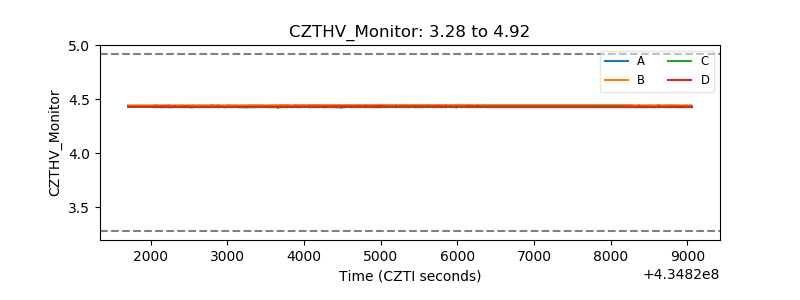 |
| D_VDD | 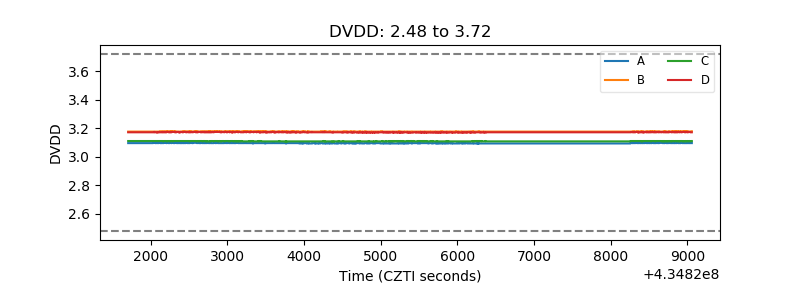 |
| Temperature 1 | 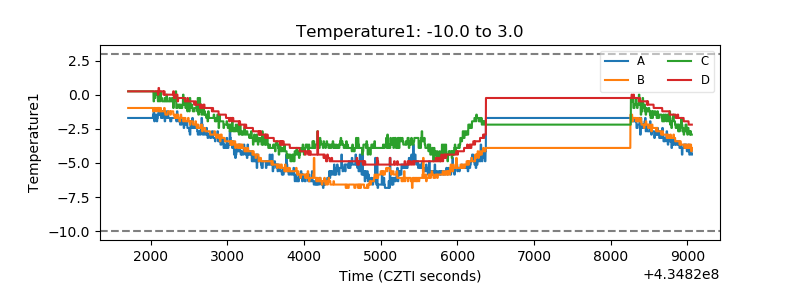 |
| Veto HV Monitor | 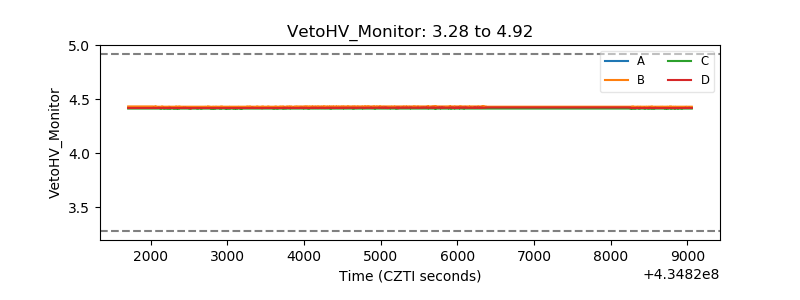 |
| Veto LLD | 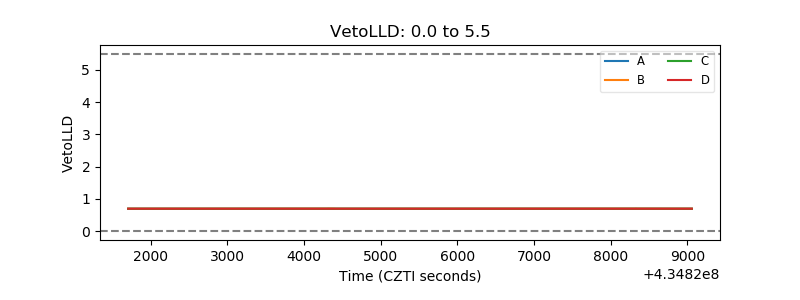 |
| Alpha Counter | 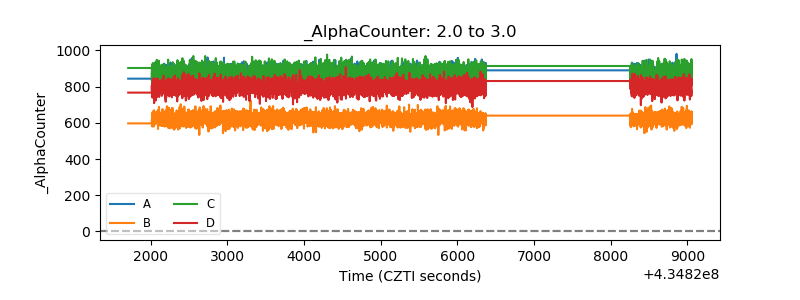 |
| _CPM_Rate | 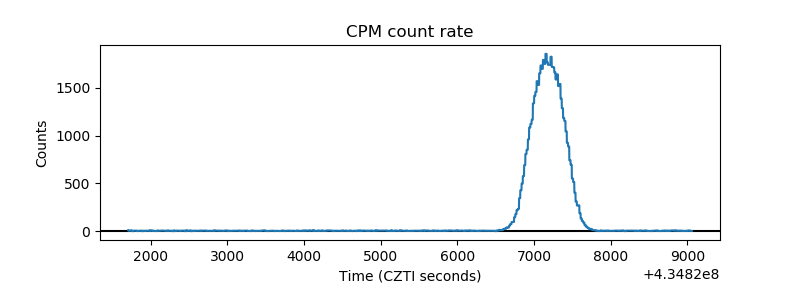 |
| CZT Counter | 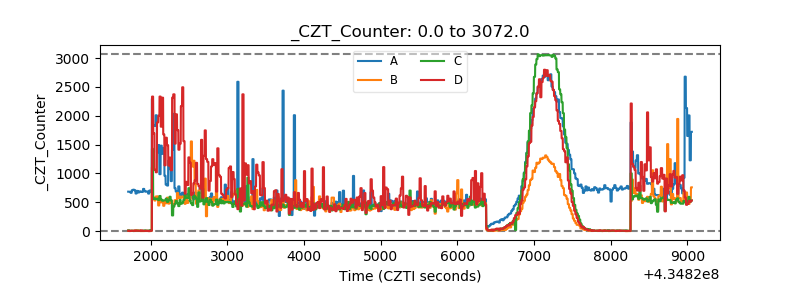 |
| +2.5 Volts monitor | 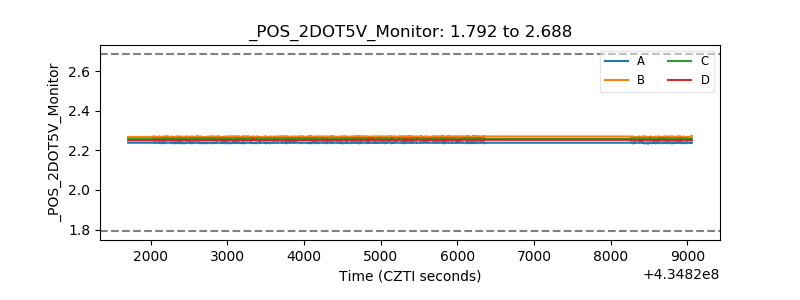 |
| +5 Volts monitor | 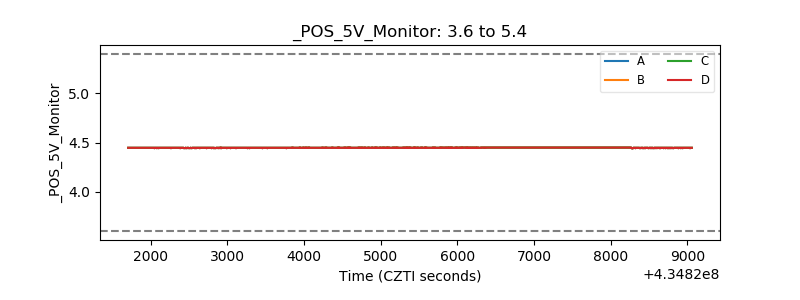 |
| _ROLL_ROT | 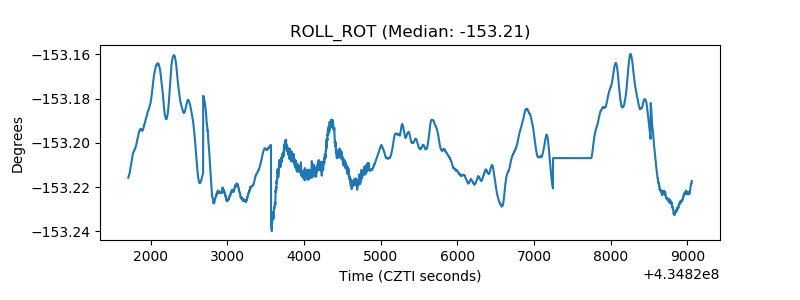 |
| _Roll_DEC | 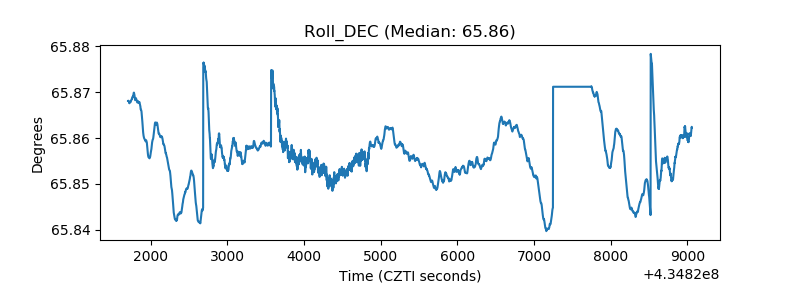 |
| _Roll_RA | 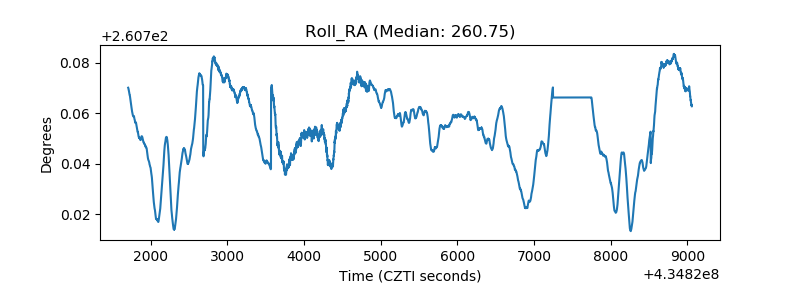 |
| Veto Counter | 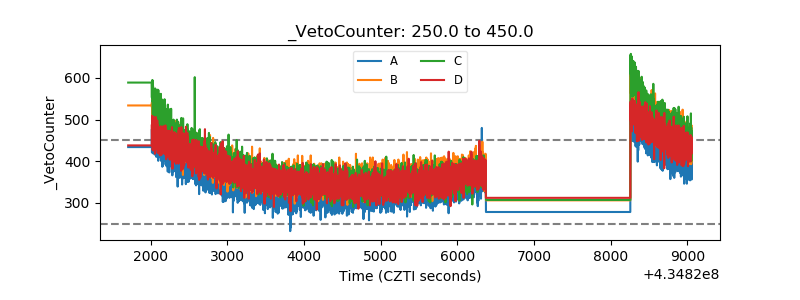 |