| Param | Original file | Final file |
|---|---|---|
| Filename | modeM0/AS1A12_018T01_9000005874_43473cztM0_level2.fits | modeM0/AS1A12_018T01_9000005874_43473cztM0_level2_quad_clean.evt |
| Size (bytes) | 438,986,880 | 86,958,720 |
| Size | 418.7 MB | 82.9 MB |
| Events in quadrant A | 5,400,932 | 574,016 |
| Events in quadrant B | 2,639,123 | 623,014 |
| Events in quadrant C | 2,480,016 | 598,637 |
| Events in quadrant D | 5,335,324 | 480,877 |
| Mode M0 | |||
|---|---|---|---|
| Quadrant | BADHDUFLAG | Total packets | Discarded packets |
| A | 0 | 19606 | 2 |
| B | 0 | 11180 | 2 |
| C | 0 | 10522 | 2 |
| D | 0 | 19354 | 2 |
| Mode M9 | |||
|---|---|---|---|
| Quadrant | BADHDUFLAG | Total packets | Discarded packets |
| A | 0 | 24 | 0 |
| B | 0 | 25 | 0 |
| C | 0 | 25 | 0 |
| D | 0 | 25 | 0 |
| Mode SS | |||
|---|---|---|---|
| Quadrant | BADHDUFLAG | Total packets | Discarded packets |
| A | 0 | 104 | 0 |
| B | 0 | 104 | 0 |
| C | 0 | 104 | 0 |
| D | 0 | 104 | 0 |
| Quadrant | Total seconds | Saturated seconds | Saturation percentage |
|---|---|---|---|
| A | 5073 | 692 | 13.640844% |
| B | 5073 | 31 | 0.611078% |
| C | 5073 | 9 | 0.177410% |
| D | 5072 | 884 | 17.429022% |
Noise dominated data is calculated using 1-second bins in cleaned event files. If a bin has >2000 counts, and if more than 50% of those come from <1% of pixels, then it is considered to be noise-dominated and hence unusable.
| Quadrant | # 1 sec bins | Bins with >0 counts | Bins with >2000 counts | High rate bins dominated by noise | Noise dominated (total time) | Noise dominated (detector-on time) | Marked lightcurve |
|---|---|---|---|---|---|---|---|
| A | 7076 | 5074 | 501 | 501 | 7.08% | 9.87% | 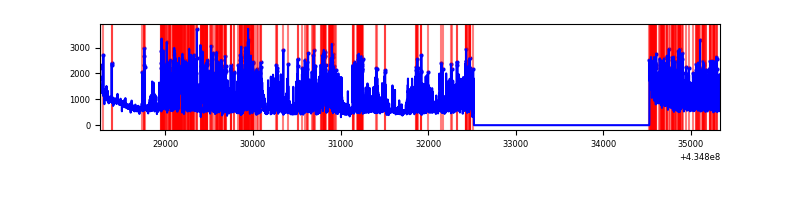 |
| B | 7076 | 5074 | 18 | 18 | 0.25% | 0.35% | 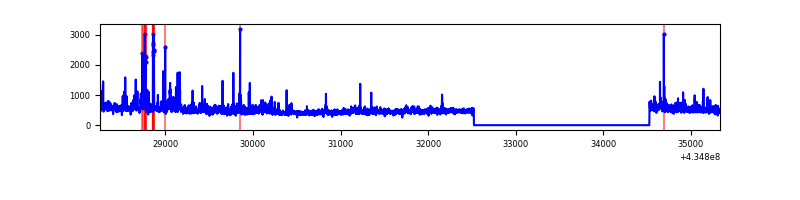 |
| C | 7076 | 5074 | 3 | 3 | 0.04% | 0.06% | 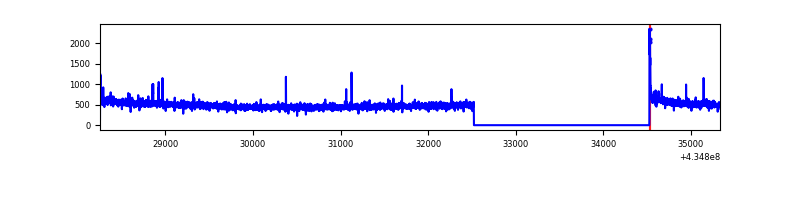 |
| D | 7074 | 5072 | 860 | 860 | 12.16% | 16.96% | 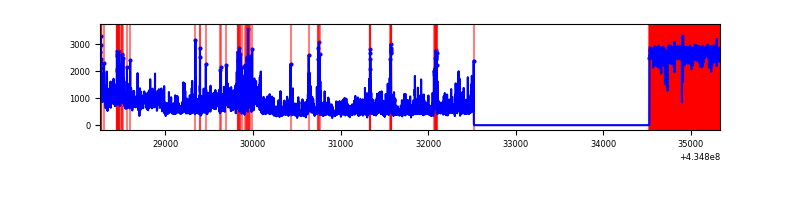 |
Top three noisy pixels from each quadrant. If the there are fewer than three noisy pixels in the level2.evt file, extra rows are filled as -1
| Pixel properties | Quadrant properties | ||||||
|---|---|---|---|---|---|---|---|
| Quadrant | DetID | PixID | Counts | Sigma | Mean | Median | Sigma |
| A | 15 | 222 | 2410395 | 22118.41 | 533 | 523 | 109.0 |
| A | 10 | 83 | 573278 | 5256.89 | 533 | 523 | 109.0 |
| A | 15 | 237 | 235704 | 2158.55 | 533 | 523 | 109.0 |
| B | 0 | 245 | 163196 | 1538.07 | 563 | 547 | 105.7 |
| B | 0 | 199 | 77516 | 727.85 | 563 | 547 | 105.7 |
| B | 0 | 189 | 65702 | 616.13 | 563 | 547 | 105.7 |
| C | 15 | 214 | 222192 | 1714.69 | 560 | 564 | 129.3 |
| C | 3 | 233 | 45989 | 351.44 | 560 | 564 | 129.3 |
| C | 14 | 254 | 16327 | 121.96 | 560 | 564 | 129.3 |
| D | 1 | 52 | 2212983 | 18657.13 | 486 | 472 | 118.6 |
| D | 2 | 16 | 684178 | 5765.39 | 486 | 472 | 118.6 |
| D | 2 | 249 | 137866 | 1158.58 | 486 | 472 | 118.6 |
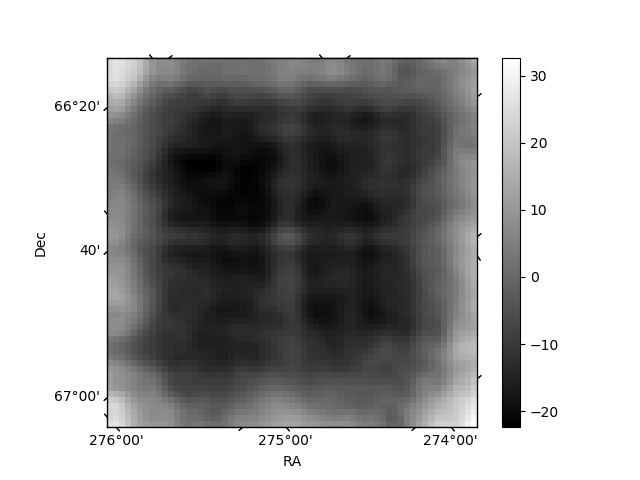
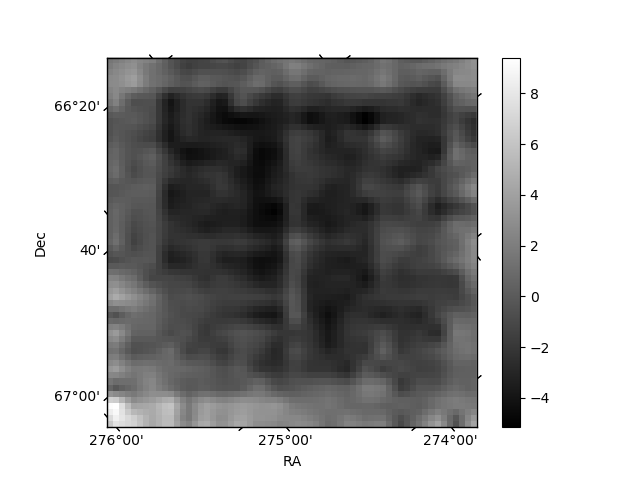
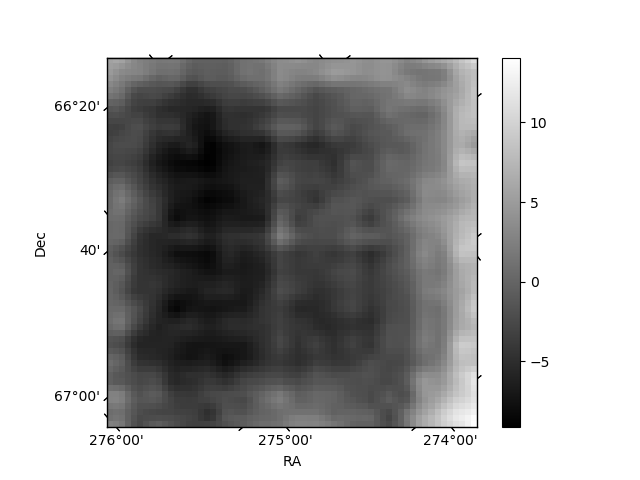
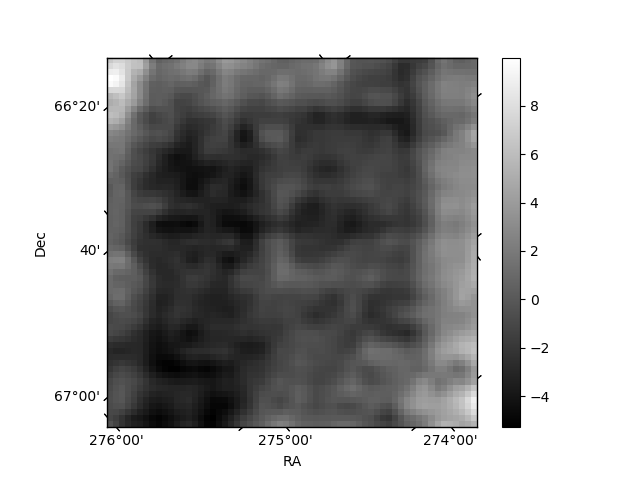
Histogram calculated using DETX and DETY for each event in the final _common_clean file
| Quadrant A | 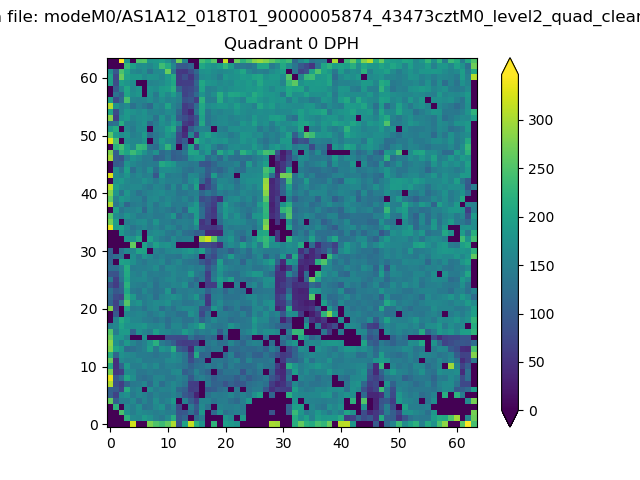 |
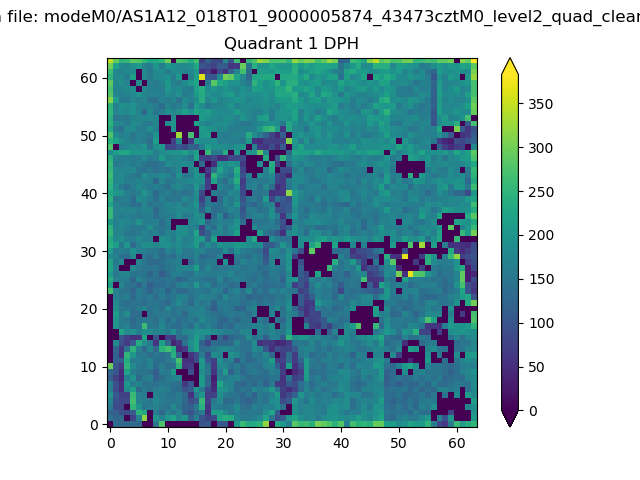 |
Quadrant B |
|---|---|---|---|
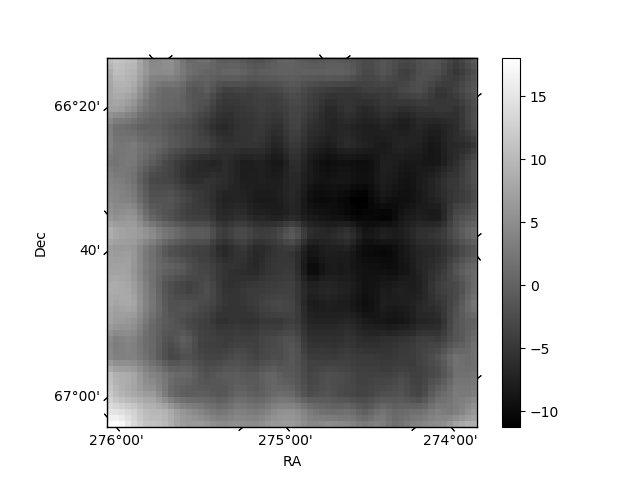
| Quadrant D | 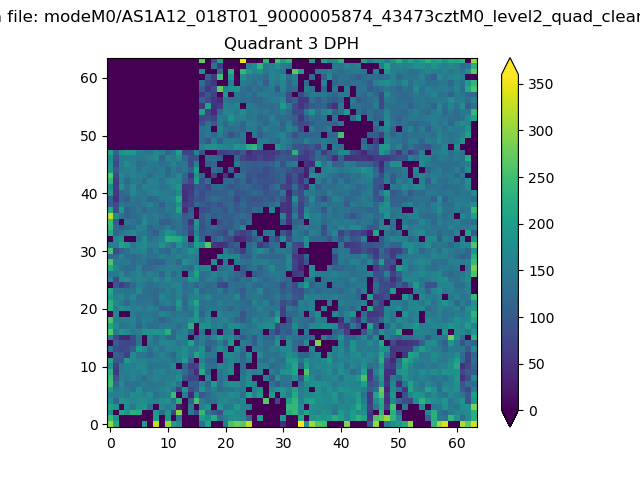 |
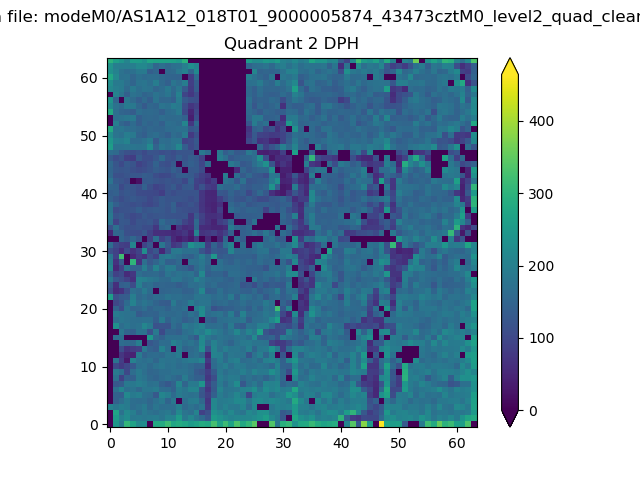 |
Quadrant C |
| Plot type | Count rate plots | Images |
|---|---|---|
| Comparison with Poisson distribution Blue bars denote a histogram of data divided into 1 sec bins. Red curve is a Poisson curve with rate = median count rate of data. |
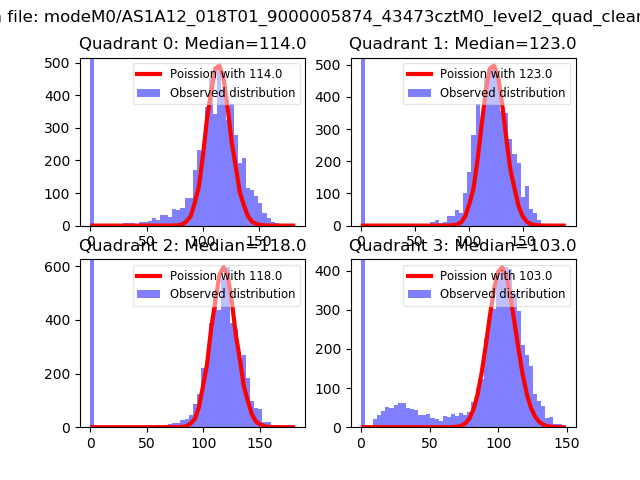 |
 |
| Quadrant-wise count rates Data is divided into 100 sec bins |
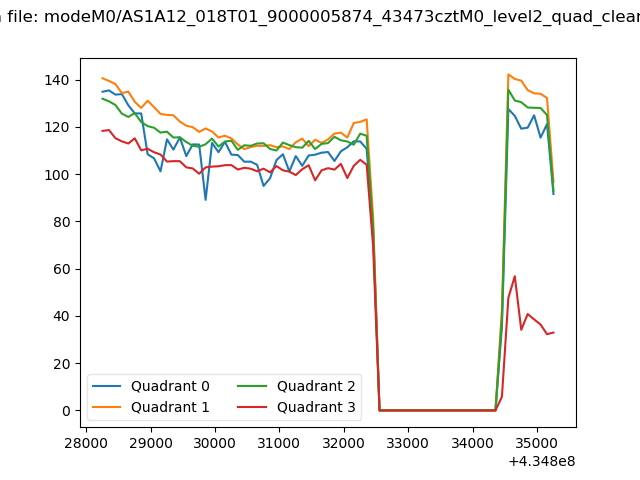 |
|
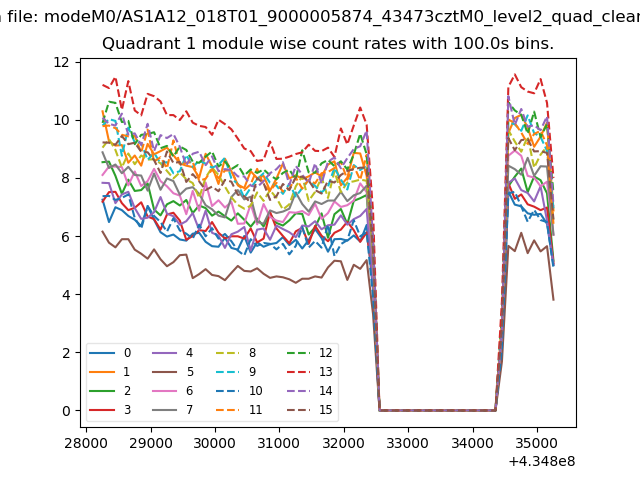
| Module-wise count rates for Quadrant A Data is divided into 100 sec bins |
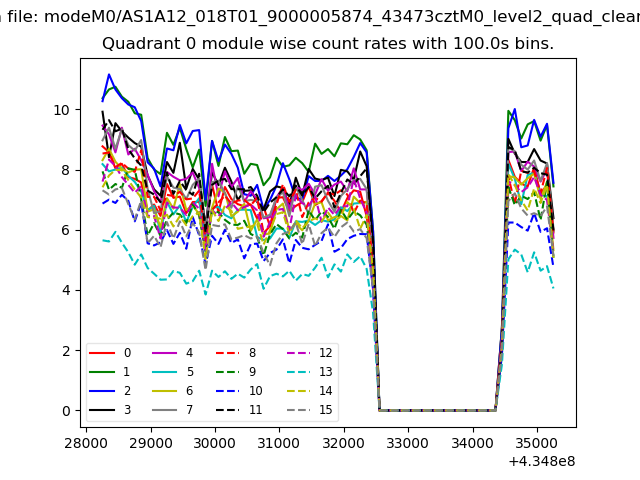 |
 |
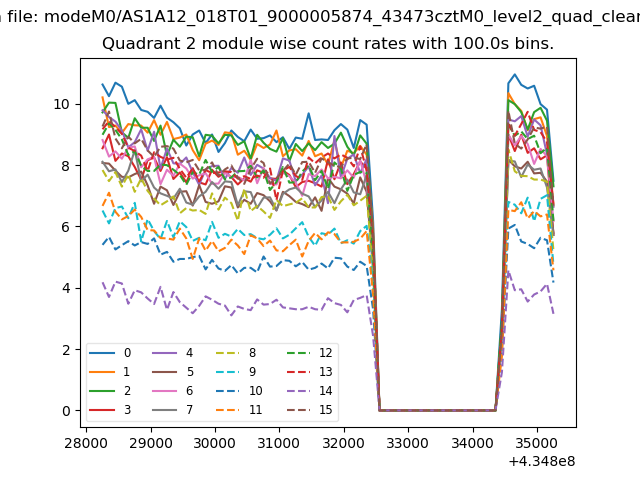
| Module-wise count rates for Quadrant B Data is divided into 100 sec bins |
 |
 |
| Module-wise count rates for Quadrant C Data is divided into 100 sec bins |
 |
 |
| Module-wise count rates for Quadrant D Data is divided into 100 sec bins |
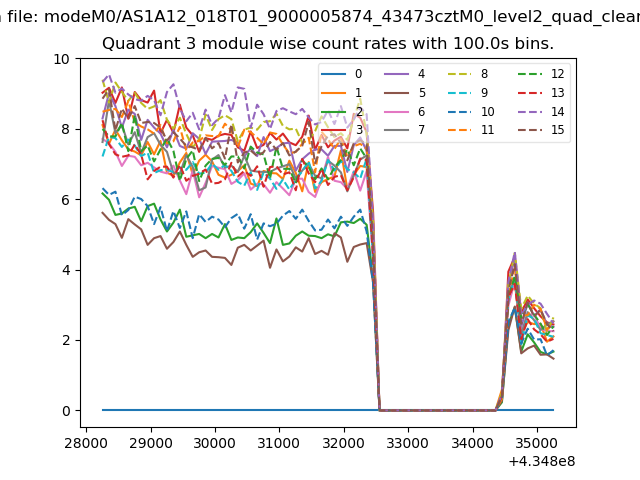 |
 |
| Parameter | Plot |
|---|---|
| CZT HV Monitor | 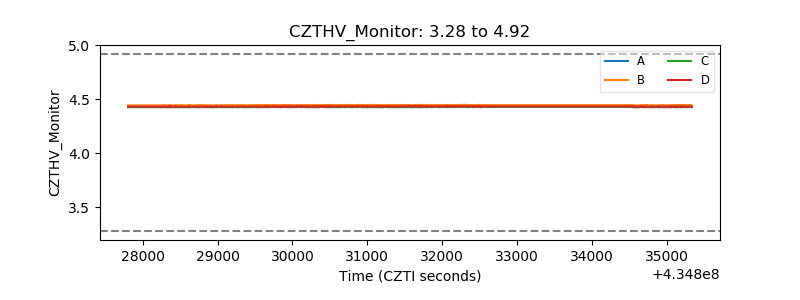 |
| D_VDD | 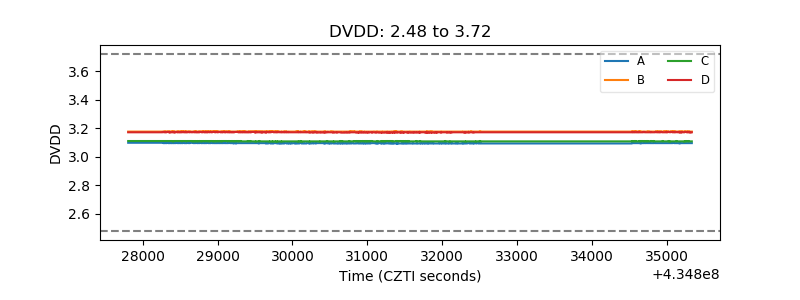 |
| Temperature 1 | 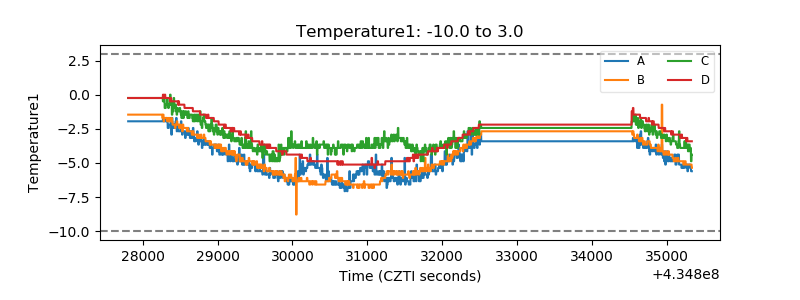 |
| Veto HV Monitor | 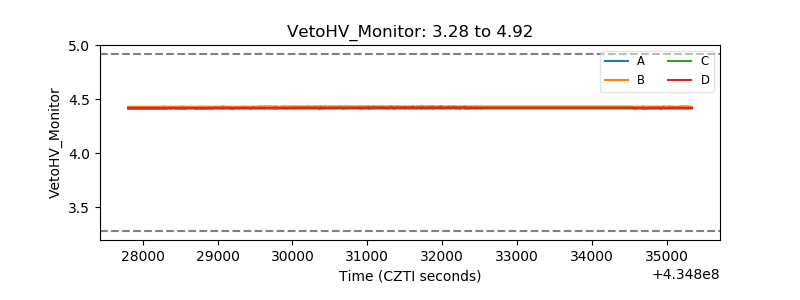 |
| Veto LLD | 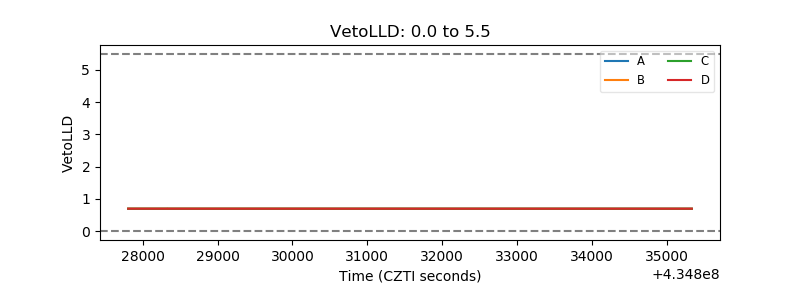 |
| Alpha Counter | 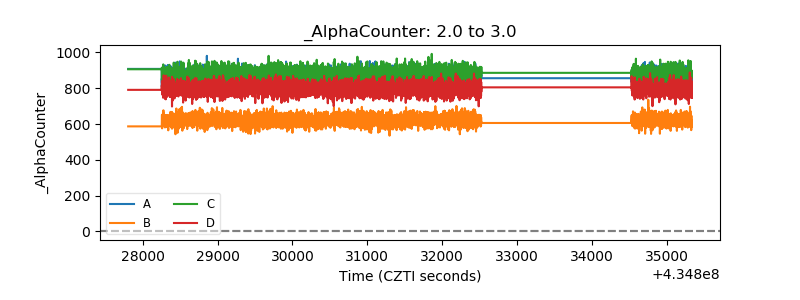 |
| _CPM_Rate | 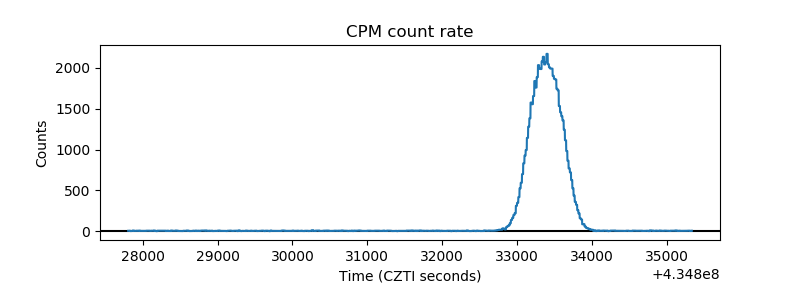 |
| CZT Counter | 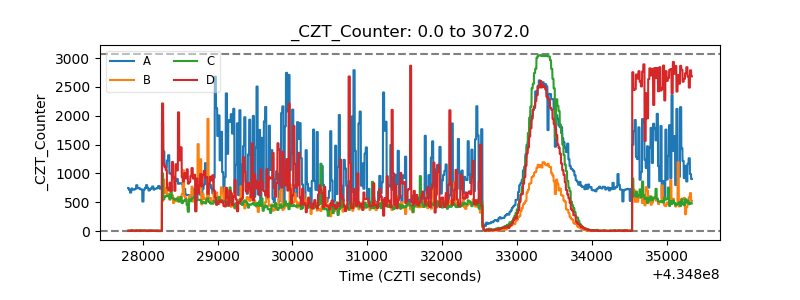 |
| +2.5 Volts monitor | 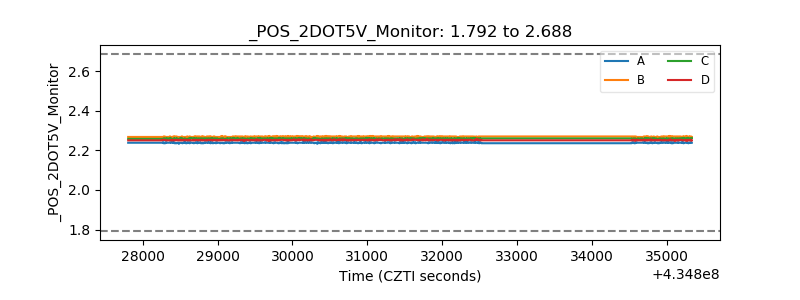 |
| +5 Volts monitor | 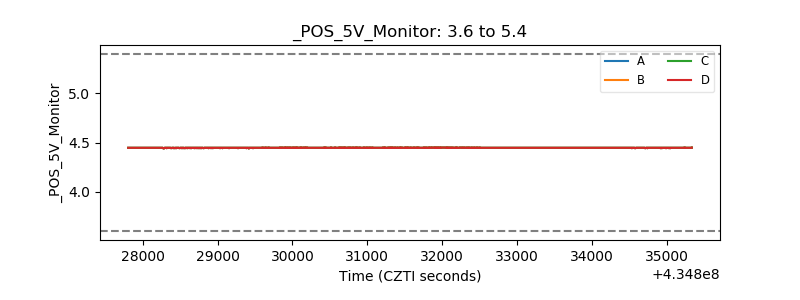 |
| _ROLL_ROT | 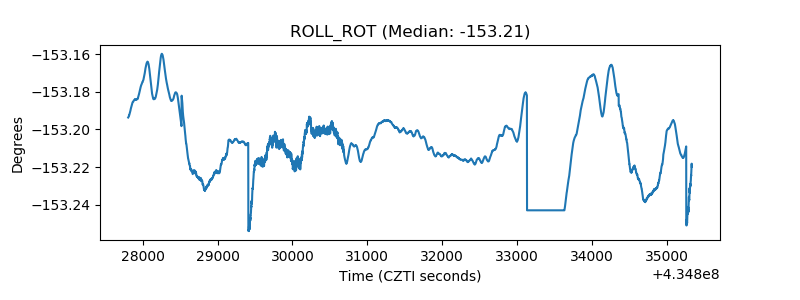 |
| _Roll_DEC | 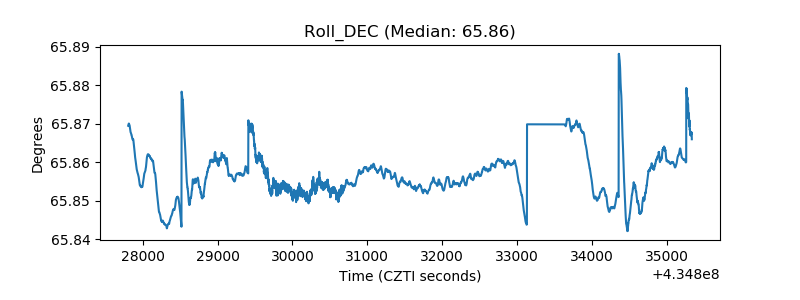 |
| _Roll_RA | 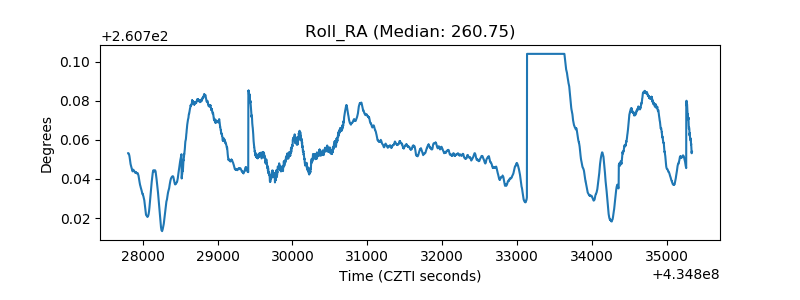 |
| Veto Counter | 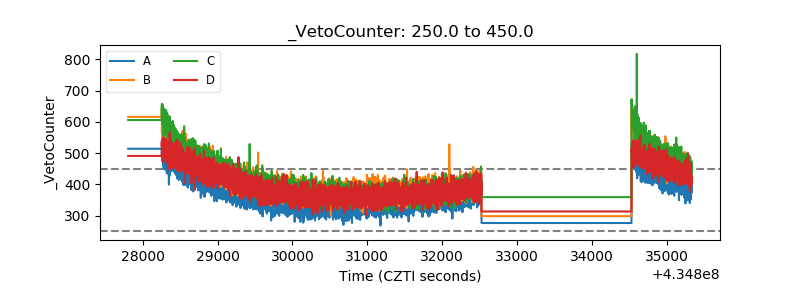 |