| Param | Original file | Final file |
|---|---|---|
| Filename | modeM0/AS1A12_018T01_9000005874_43474cztM0_level2.fits | modeM0/AS1A12_018T01_9000005874_43474cztM0_level2_quad_clean.evt |
| Size (bytes) | 583,908,480 | 79,038,720 |
| Size | 556.9 MB | 75.4 MB |
| Events in quadrant A | 5,375,243 | 563,616 |
| Events in quadrant B | 2,402,129 | 615,990 |
| Events in quadrant C | 2,426,163 | 592,654 |
| Events in quadrant D | 11,022,245 | 268,588 |
| Mode M0 | |||
|---|---|---|---|
| Quadrant | BADHDUFLAG | Total packets | Discarded packets |
| A | 0 | 19478 | 2 |
| B | 0 | 10509 | 2 |
| C | 0 | 10267 | 2 |
| D | 0 | 36131 | 2 |
| Mode M9 | |||
|---|---|---|---|
| Quadrant | BADHDUFLAG | Total packets | Discarded packets |
| A | 0 | 29 | 0 |
| B | 0 | 30 | 0 |
| C | 0 | 30 | 0 |
| D | 0 | 30 | 0 |
| Mode SS | |||
|---|---|---|---|
| Quadrant | BADHDUFLAG | Total packets | Discarded packets |
| A | 0 | 102 | 0 |
| B | 0 | 102 | 0 |
| C | 0 | 102 | 0 |
| D | 0 | 102 | 0 |
| Quadrant | Total seconds | Saturated seconds | Saturation percentage |
|---|---|---|---|
| A | 4998 | 686 | 13.725490% |
| B | 4998 | 10 | 0.200080% |
| C | 4998 | 9 | 0.180072% |
| D | 4998 | 3727 | 74.569828% |
Noise dominated data is calculated using 1-second bins in cleaned event files. If a bin has >2000 counts, and if more than 50% of those come from <1% of pixels, then it is considered to be noise-dominated and hence unusable.
| Quadrant | # 1 sec bins | Bins with >0 counts | Bins with >2000 counts | High rate bins dominated by noise | Noise dominated (total time) | Noise dominated (detector-on time) | Marked lightcurve |
|---|---|---|---|---|---|---|---|
| A | 7092 | 4999 | 445 | 445 | 6.27% | 8.90% | 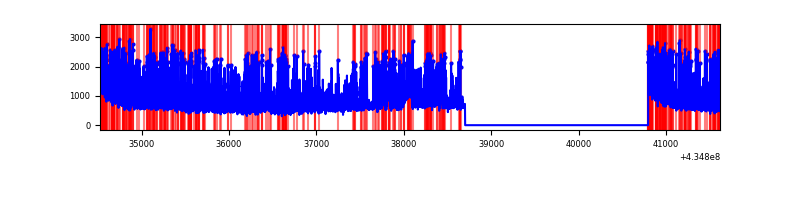 |
| B | 7092 | 4999 | 5 | 5 | 0.07% | 0.10% | 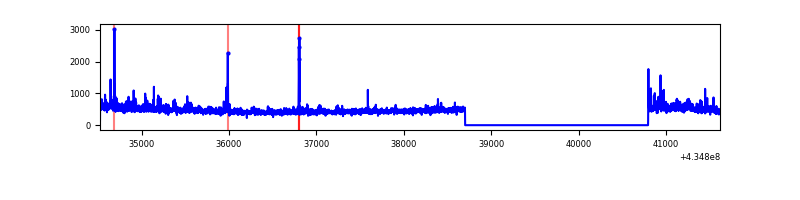 |
| C | 7092 | 4999 | 3 | 3 | 0.04% | 0.06% | 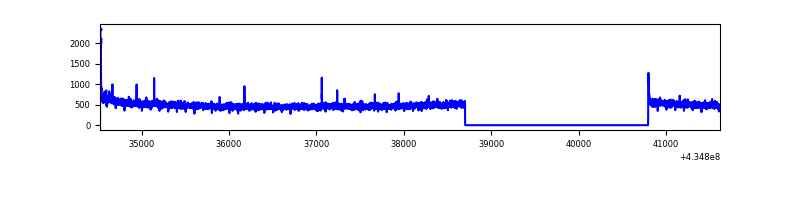 |
| D | 7092 | 4998 | 3649 | 3649 | 51.45% | 73.01% | 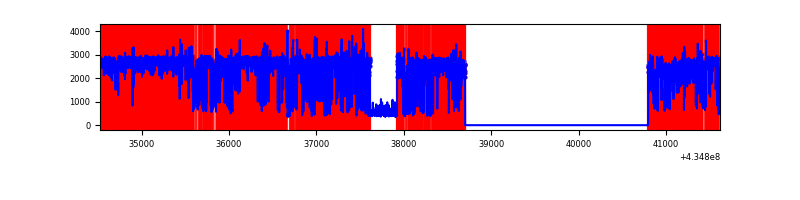 |
Top three noisy pixels from each quadrant. If the there are fewer than three noisy pixels in the level2.evt file, extra rows are filled as -1
| Pixel properties | Quadrant properties | ||||||
|---|---|---|---|---|---|---|---|
| Quadrant | DetID | PixID | Counts | Sigma | Mean | Median | Sigma |
| A | 15 | 222 | 2347902 | 22005.11 | 523 | 513 | 106.7 |
| A | 10 | 83 | 535473 | 5014.87 | 523 | 513 | 106.7 |
| A | 15 | 237 | 423036 | 3960.85 | 523 | 513 | 106.7 |
| B | 0 | 245 | 117986 | 1121.96 | 554 | 538 | 104.7 |
| B | 0 | 189 | 42649 | 402.28 | 554 | 538 | 104.7 |
| B | 0 | 229 | 22730 | 212.0 | 554 | 538 | 104.7 |
| C | 15 | 214 | 220172 | 1721.45 | 549 | 553 | 127.6 |
| C | 3 | 233 | 48250 | 373.87 | 549 | 553 | 127.6 |
| C | 14 | 254 | 7173 | 51.89 | 549 | 553 | 127.6 |
| D | 1 | 52 | 9234958 | 134431.34 | 276 | 268 | 68.7 |
| D | 2 | 16 | 486311 | 7075.43 | 276 | 268 | 68.7 |
| D | 5 | 222 | 57456 | 832.5 | 276 | 268 | 68.7 |
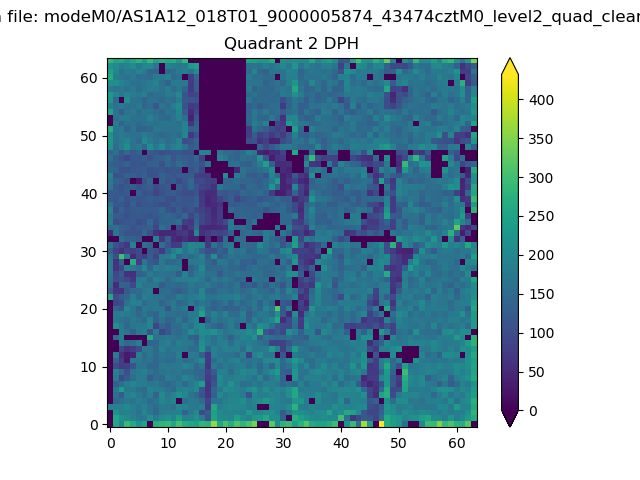
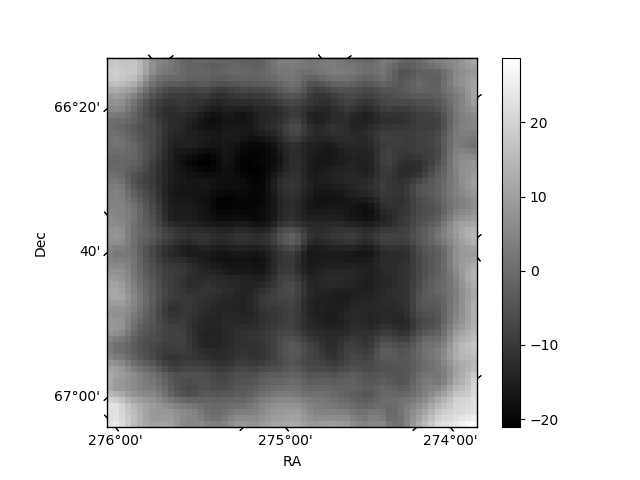
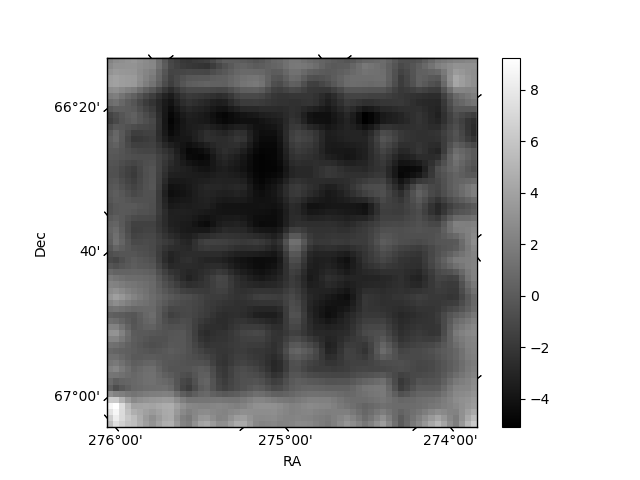
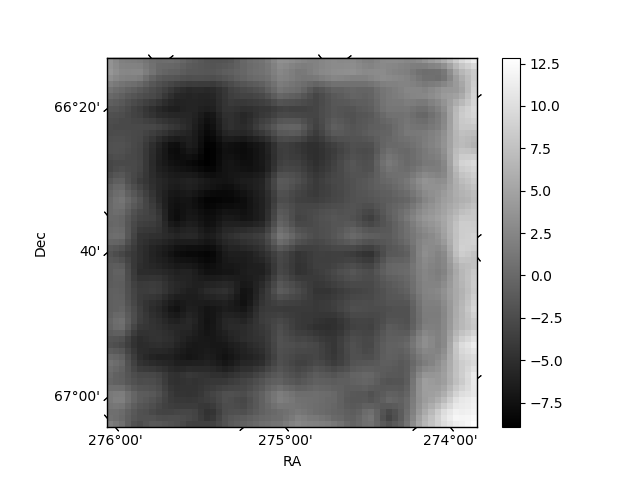
Histogram calculated using DETX and DETY for each event in the final _common_clean file
| Quadrant A | 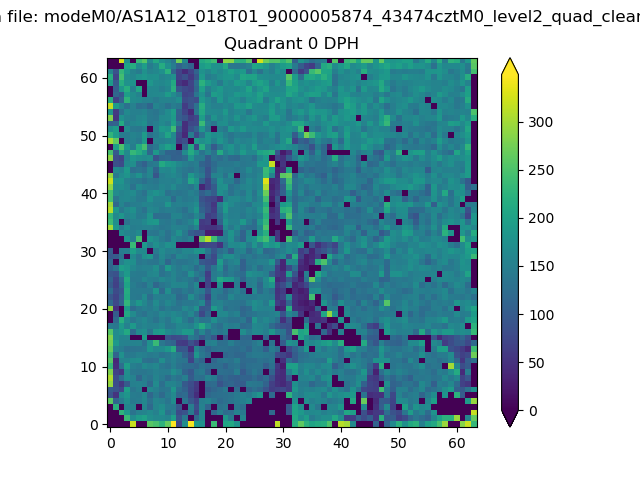 |
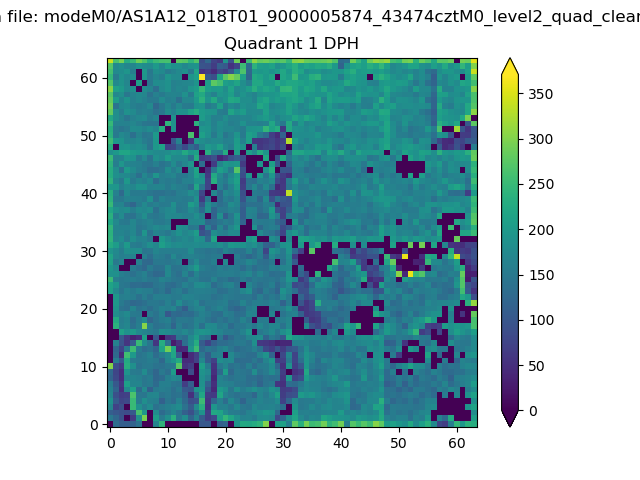 |
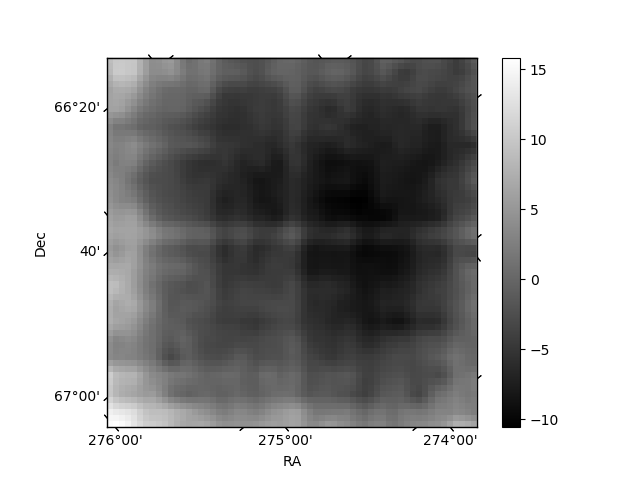
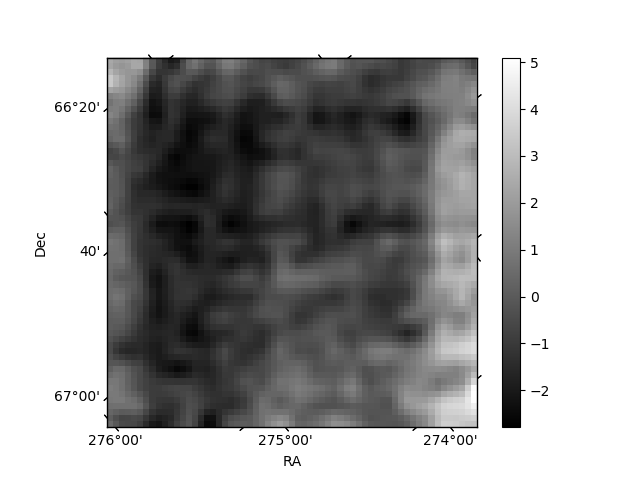
Quadrant B |
|---|---|---|---|
| Quadrant D | 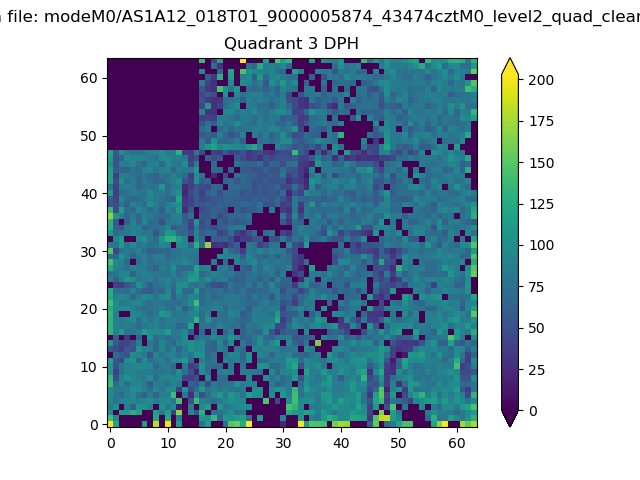 |
 |
Quadrant C |
| Plot type | Count rate plots | Images |
|---|---|---|
| Comparison with Poisson distribution Blue bars denote a histogram of data divided into 1 sec bins. Red curve is a Poisson curve with rate = median count rate of data. |
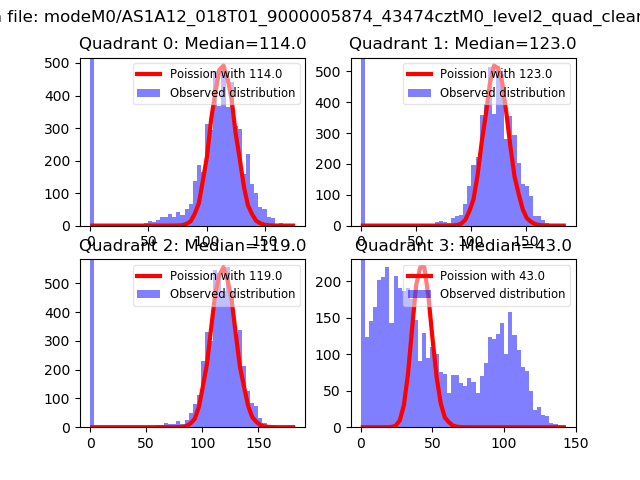 |
 |
| Quadrant-wise count rates Data is divided into 100 sec bins |
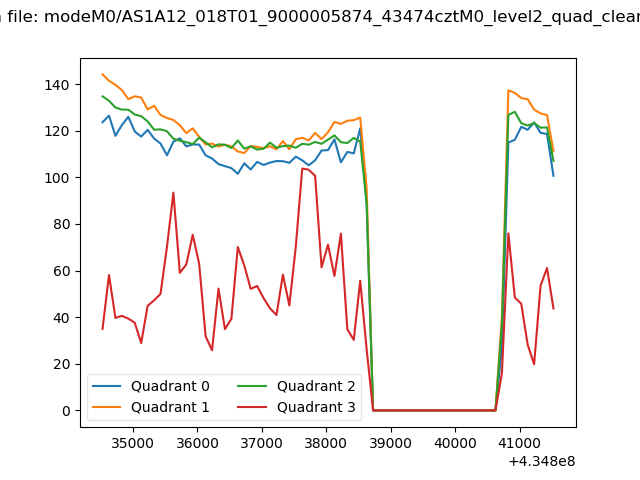 |
|
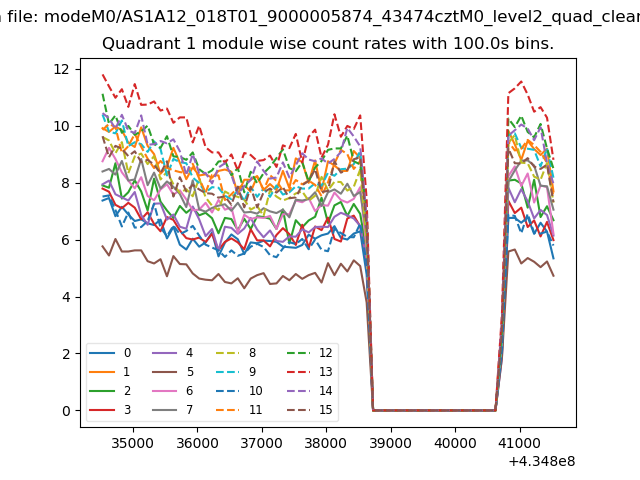
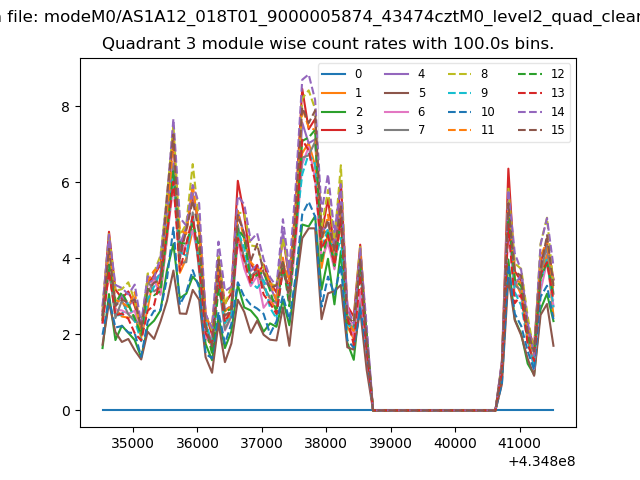
| Module-wise count rates for Quadrant A Data is divided into 100 sec bins |
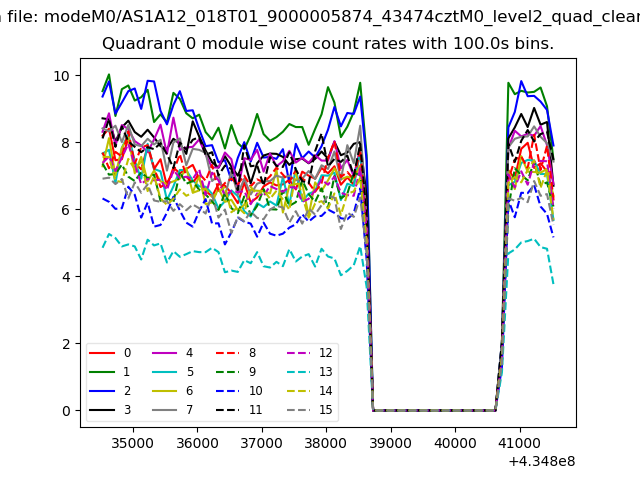 |
 |
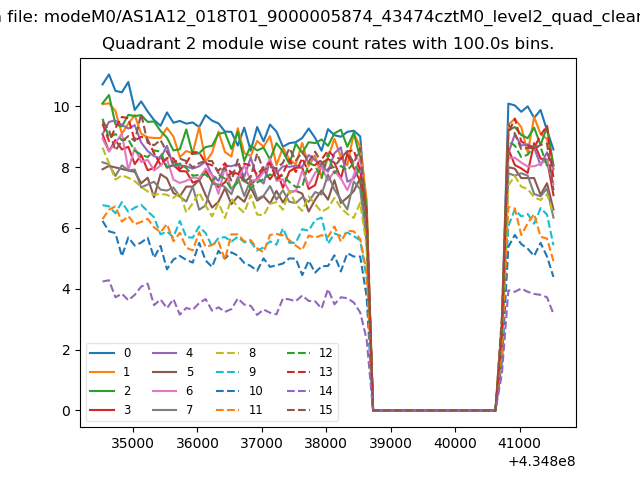
| Module-wise count rates for Quadrant B Data is divided into 100 sec bins |
 |
 |
| Module-wise count rates for Quadrant C Data is divided into 100 sec bins |
 |
 |
| Module-wise count rates for Quadrant D Data is divided into 100 sec bins |
 |
 |
| Parameter | Plot |
|---|---|
| CZT HV Monitor | 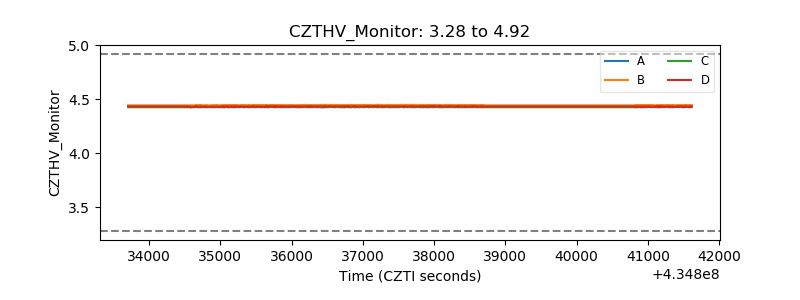 |
| D_VDD | 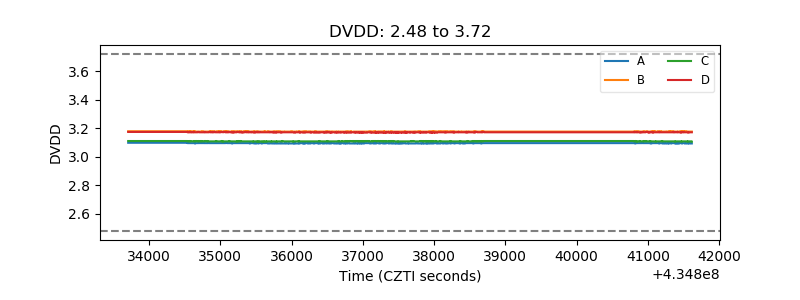 |
| Temperature 1 | 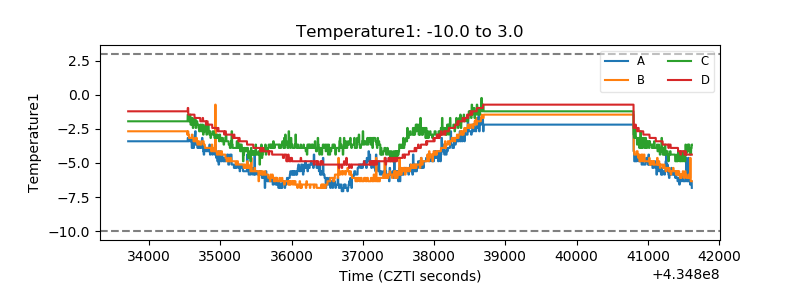 |
| Veto HV Monitor | 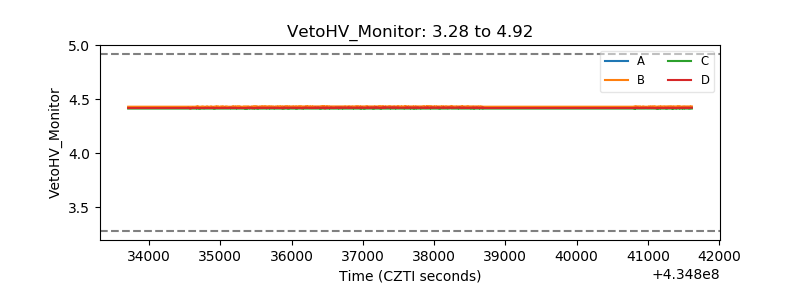 |
| Veto LLD | 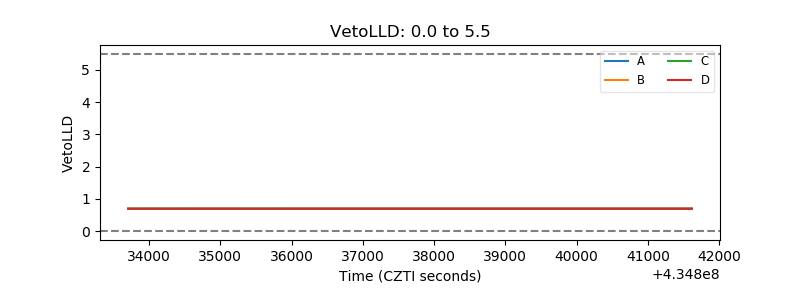 |
| Alpha Counter | 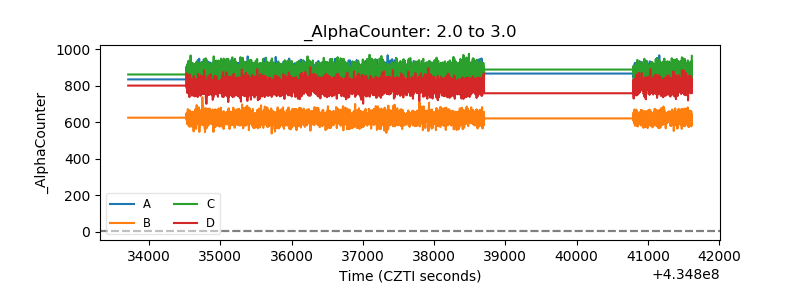 |
| _CPM_Rate | 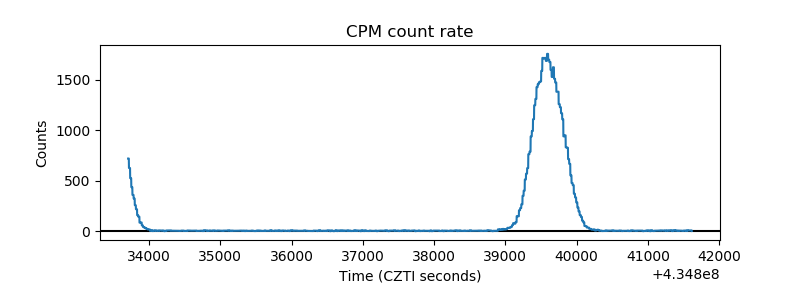 |
| CZT Counter | 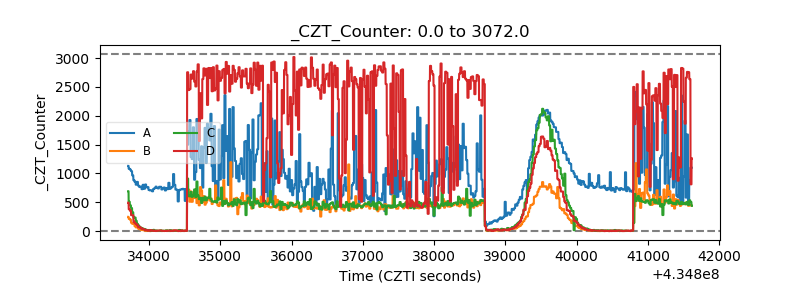 |
| +2.5 Volts monitor | 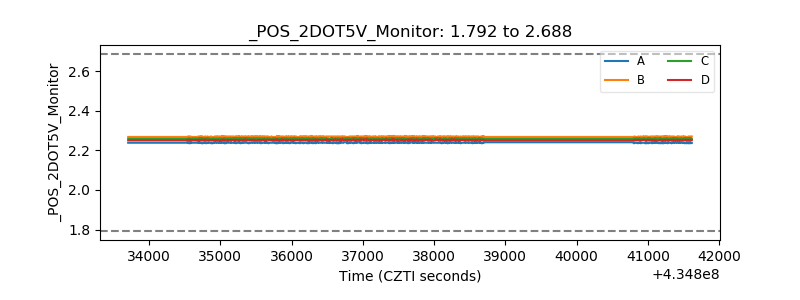 |
| +5 Volts monitor | 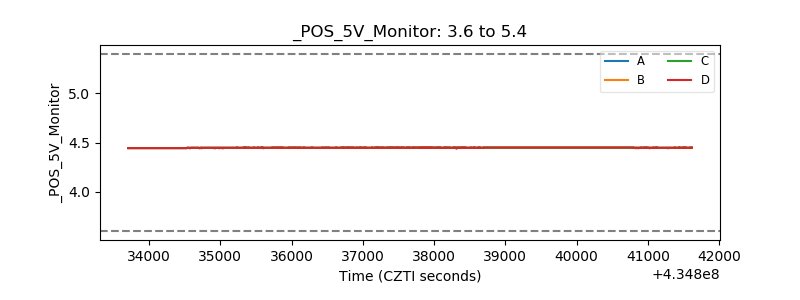 |
| _ROLL_ROT | 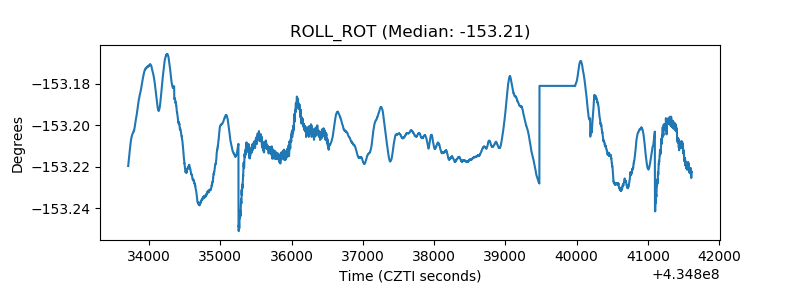 |
| _Roll_DEC |  |
| _Roll_RA | 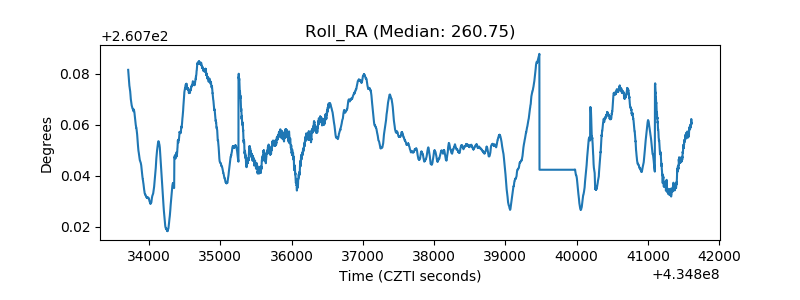 |
| Veto Counter | 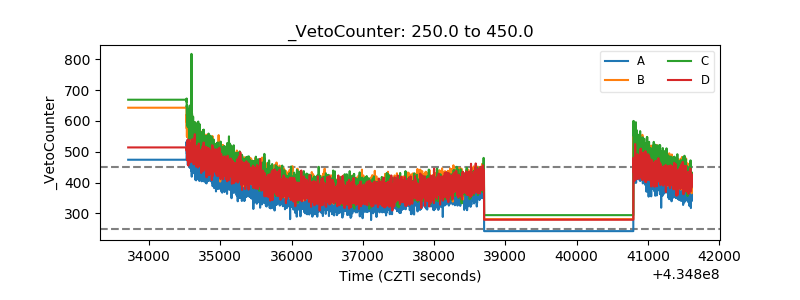 |