| Param | Original file | Final file |
|---|---|---|
| Filename | modeM0/AS1A12_018T01_9000005874_43475cztM0_level2.fits | modeM0/AS1A12_018T01_9000005874_43475cztM0_level2_quad_clean.evt |
| Size (bytes) | 432,578,880 | 78,284,160 |
| Size | 412.5 MB | 74.7 MB |
| Events in quadrant A | 4,550,291 | 526,646 |
| Events in quadrant B | 2,460,925 | 578,567 |
| Events in quadrant C | 2,278,282 | 557,773 |
| Events in quadrant D | 6,346,123 | 366,921 |
| Mode M0 | |||
|---|---|---|---|
| Quadrant | BADHDUFLAG | Total packets | Discarded packets |
| A | 0 | 16780 | 2 |
| B | 0 | 10688 | 2 |
| C | 0 | 9826 | 2 |
| D | 0 | 22222 | 3 |
| Mode M9 | |||
|---|---|---|---|
| Quadrant | BADHDUFLAG | Total packets | Discarded packets |
| A | 0 | 28 | 0 |
| B | 0 | 28 | 0 |
| C | 0 | 29 | 0 |
| D | 0 | 29 | 0 |
| Mode SS | |||
|---|---|---|---|
| Quadrant | BADHDUFLAG | Total packets | Discarded packets |
| A | 0 | 100 | 0 |
| B | 0 | 100 | 0 |
| C | 0 | 100 | 0 |
| D | 0 | 100 | 0 |
| Quadrant | Total seconds | Saturated seconds | Saturation percentage |
|---|---|---|---|
| A | 4848 | 484 | 9.983498% |
| B | 4848 | 15 | 0.309406% |
| C | 4848 | 5 | 0.103135% |
| D | 4847 | 1421 | 29.317103% |
Noise dominated data is calculated using 1-second bins in cleaned event files. If a bin has >2000 counts, and if more than 50% of those come from <1% of pixels, then it is considered to be noise-dominated and hence unusable.
| Quadrant | # 1 sec bins | Bins with >0 counts | Bins with >2000 counts | High rate bins dominated by noise | Noise dominated (total time) | Noise dominated (detector-on time) | Marked lightcurve |
|---|---|---|---|---|---|---|---|
| A | 7000 | 4848 | 360 | 360 | 5.14% | 7.43% | 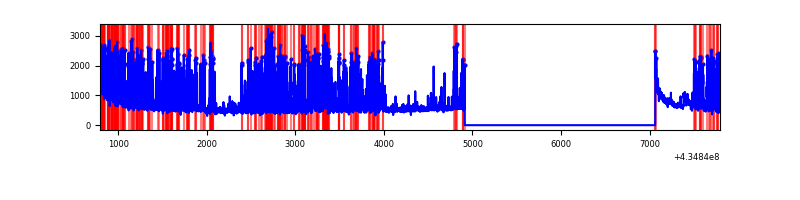 |
| B | 7000 | 4849 | 10 | 10 | 0.14% | 0.21% |  |
| C | 7000 | 4849 | 1 | 1 | 0.01% | 0.02% | 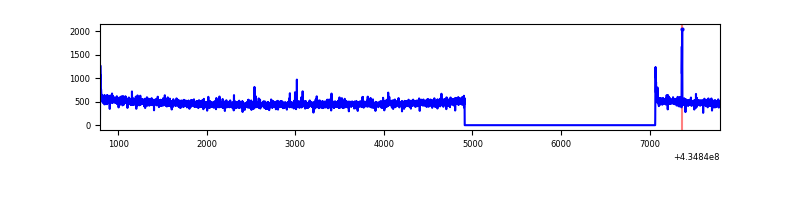 |
| D | 6999 | 4848 | 1399 | 1399 | 19.99% | 28.86% | 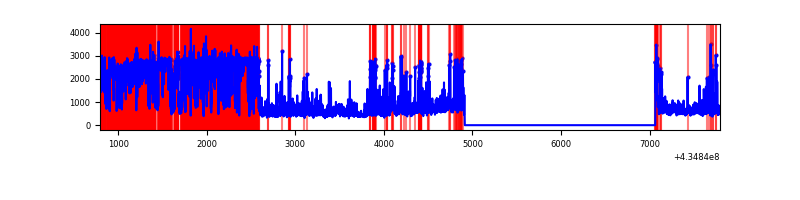 |
Top three noisy pixels from each quadrant. If the there are fewer than three noisy pixels in the level2.evt file, extra rows are filled as -1
| Pixel properties | Quadrant properties | ||||||
|---|---|---|---|---|---|---|---|
| Quadrant | DetID | PixID | Counts | Sigma | Mean | Median | Sigma |
| A | 15 | 222 | 1872540 | 18057.14 | 505 | 496 | 103.7 |
| A | 10 | 83 | 530600 | 5113.22 | 505 | 496 | 103.7 |
| A | 15 | 237 | 155220 | 1492.42 | 505 | 496 | 103.7 |
| B | 0 | 190 | 191444 | 1925.85 | 524 | 510 | 99.1 |
| B | 0 | 245 | 82635 | 828.35 | 524 | 510 | 99.1 |
| B | 5 | 172 | 39814 | 396.44 | 524 | 510 | 99.1 |
| C | 15 | 214 | 214039 | 1762.21 | 519 | 521 | 121.2 |
| C | 3 | 233 | 18282 | 146.58 | 519 | 521 | 121.2 |
| C | 0 | 207 | 15270 | 121.72 | 519 | 521 | 121.2 |
| D | 1 | 52 | 3608224 | 34916.15 | 419 | 408 | 103.3 |
| D | 2 | 16 | 543527 | 5256.26 | 419 | 408 | 103.3 |
| D | 13 | 249 | 167018 | 1612.44 | 419 | 408 | 103.3 |
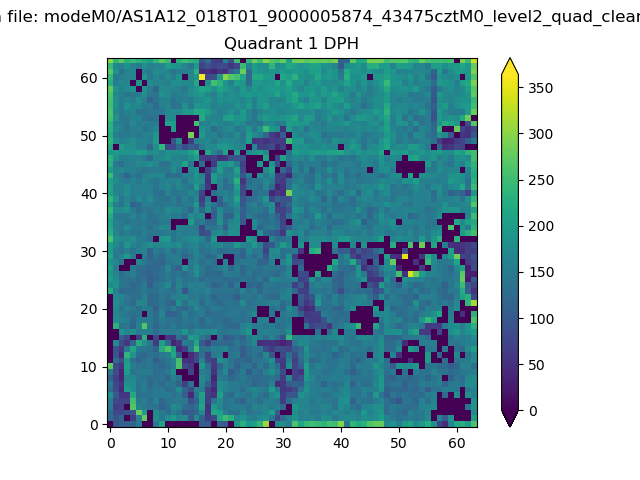
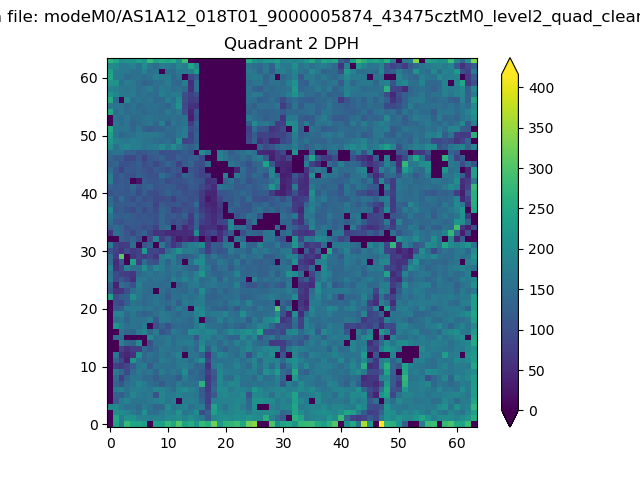
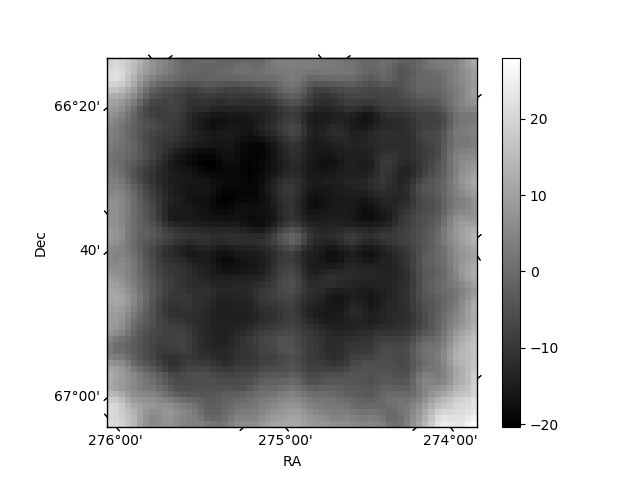
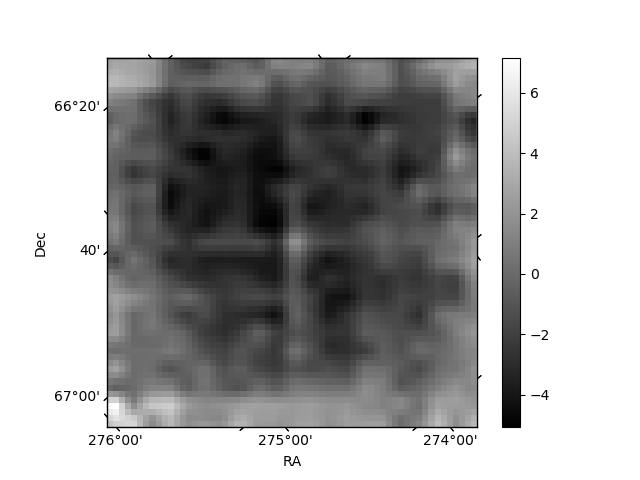
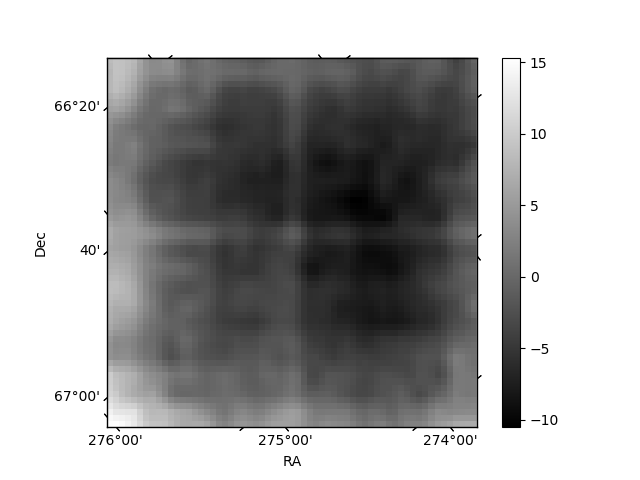
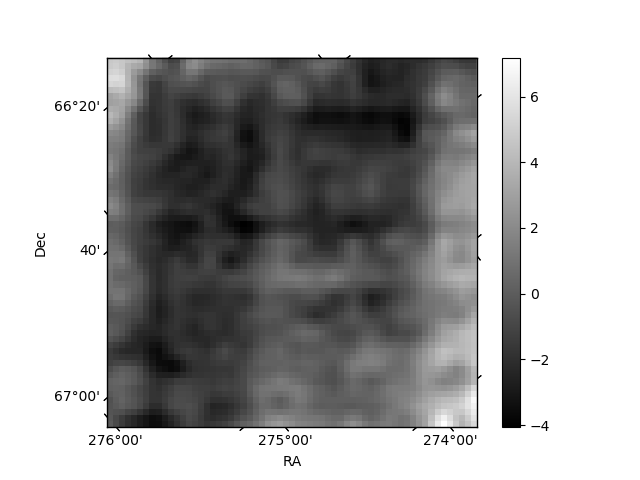
Histogram calculated using DETX and DETY for each event in the final _common_clean file
| Quadrant A | 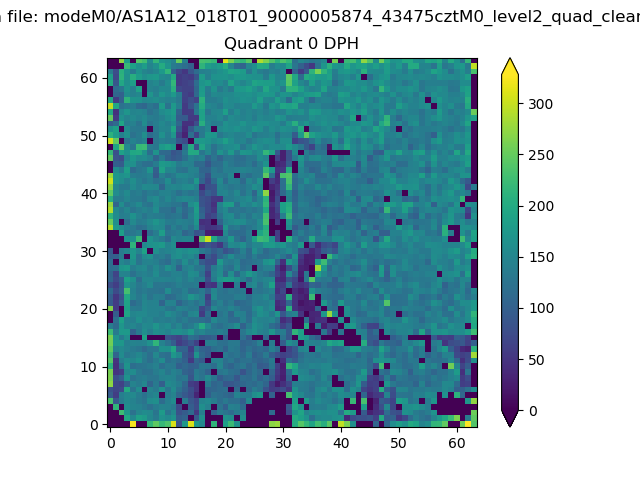 |
 |
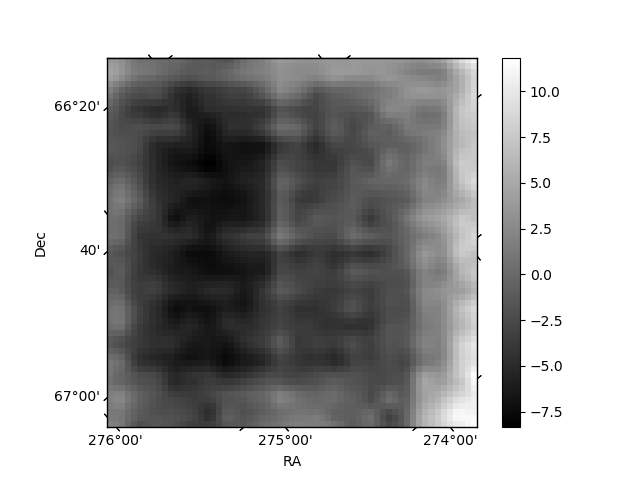
Quadrant B |
|---|---|---|---|
| Quadrant D | 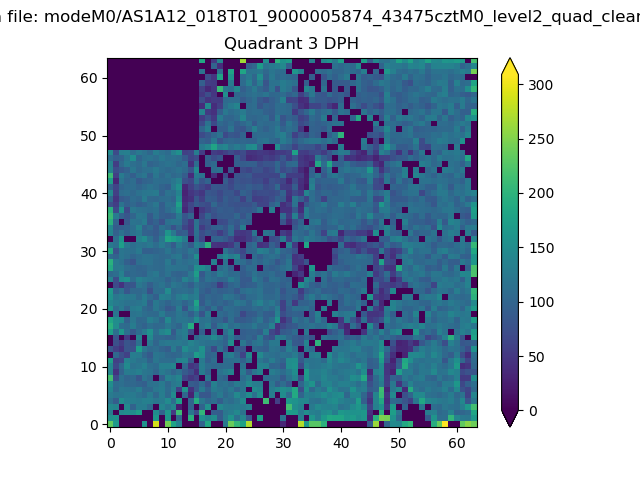 |
 |
Quadrant C |
| Plot type | Count rate plots | Images |
|---|---|---|
| Comparison with Poisson distribution Blue bars denote a histogram of data divided into 1 sec bins. Red curve is a Poisson curve with rate = median count rate of data. |
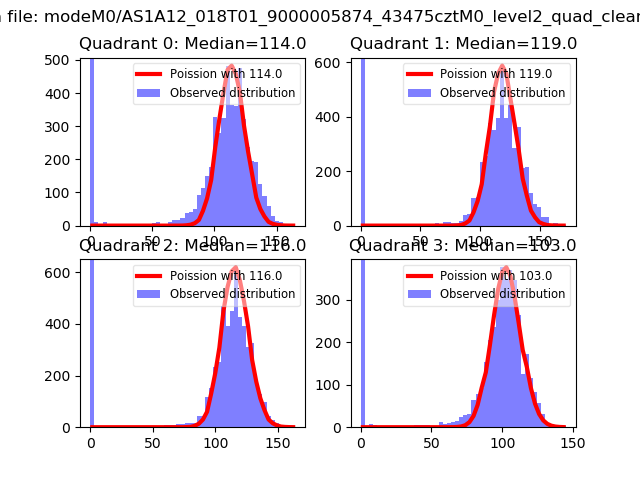 |
 |
| Quadrant-wise count rates Data is divided into 100 sec bins |
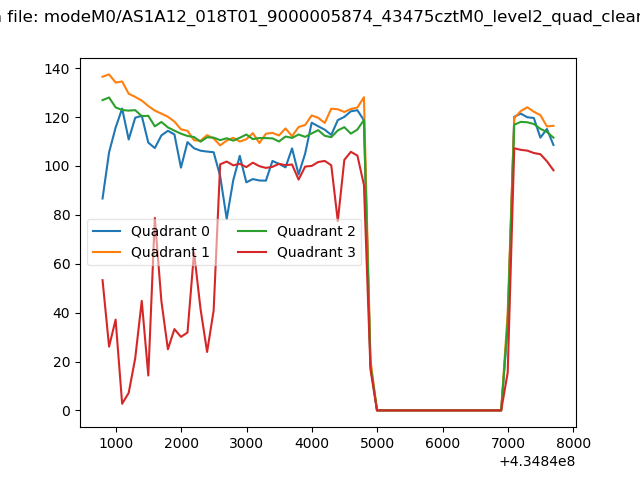 |
|
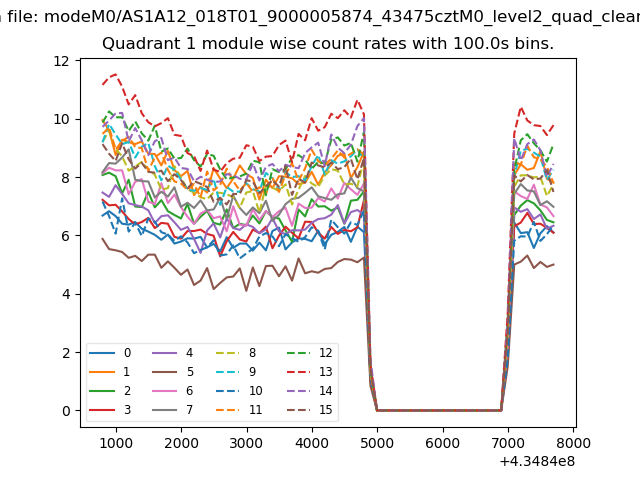
| Module-wise count rates for Quadrant A Data is divided into 100 sec bins |
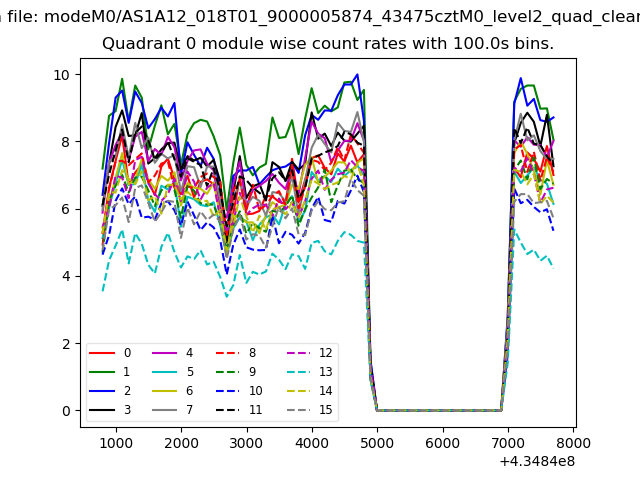 |
 |
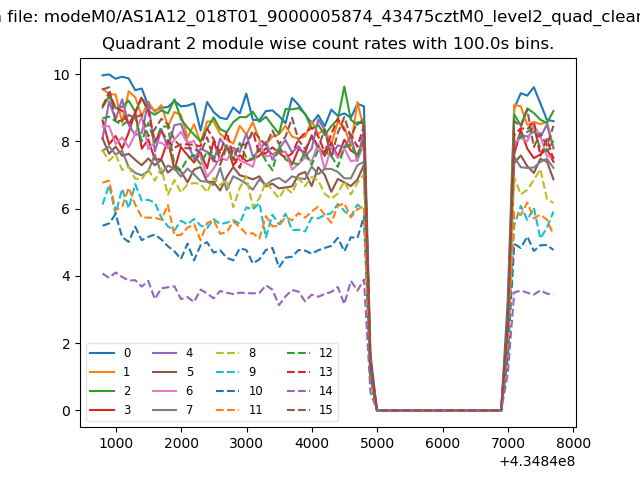
| Module-wise count rates for Quadrant B Data is divided into 100 sec bins |
 |
 |
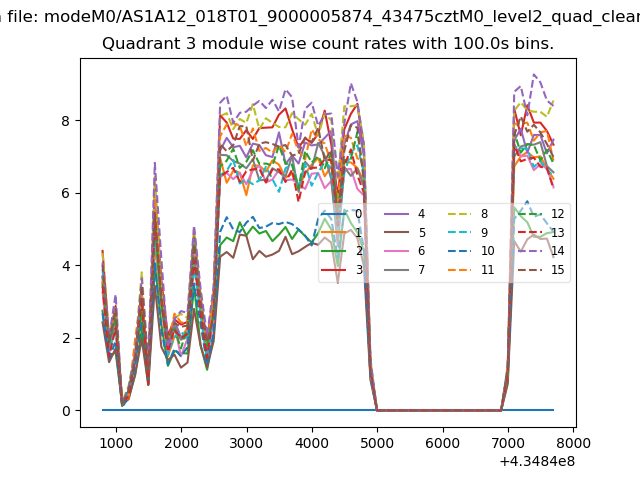
| Module-wise count rates for Quadrant C Data is divided into 100 sec bins |
 |
 |
| Module-wise count rates for Quadrant D Data is divided into 100 sec bins |
 |
 |
| Parameter | Plot |
|---|---|
| CZT HV Monitor | 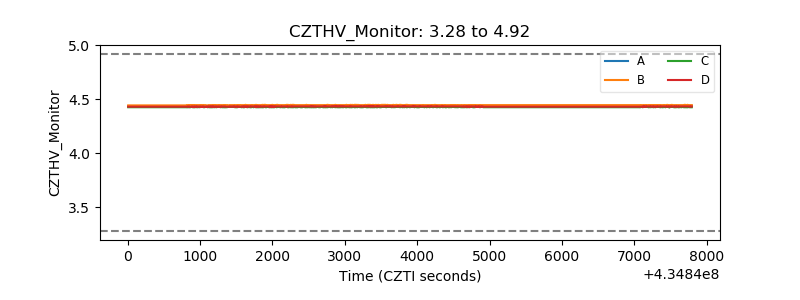 |
| D_VDD | 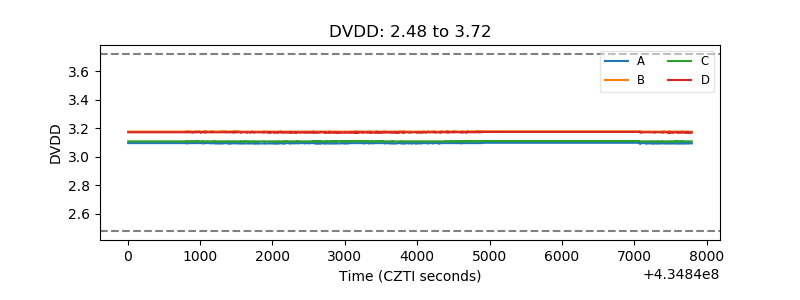 |
| Temperature 1 | 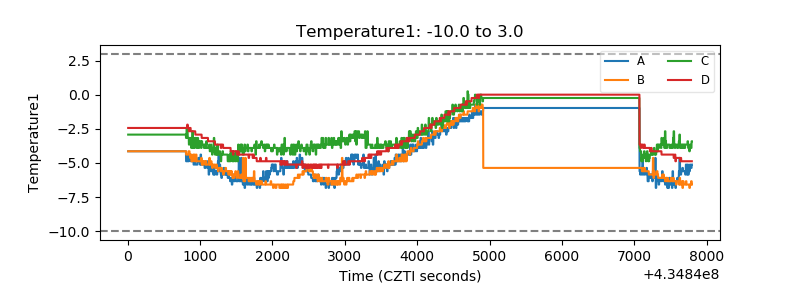 |
| Veto HV Monitor | 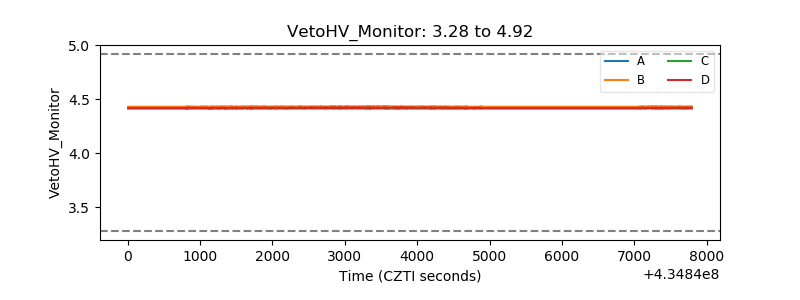 |
| Veto LLD |  |
| Alpha Counter | 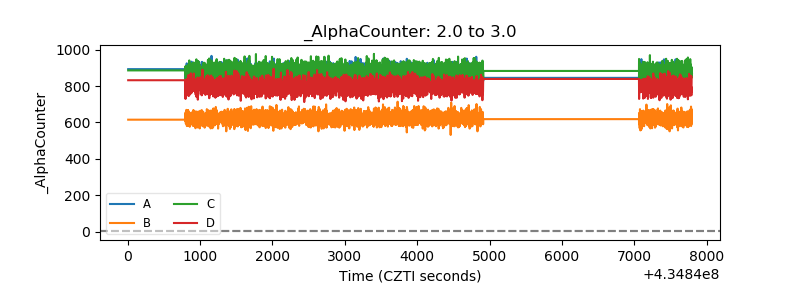 |
| _CPM_Rate | 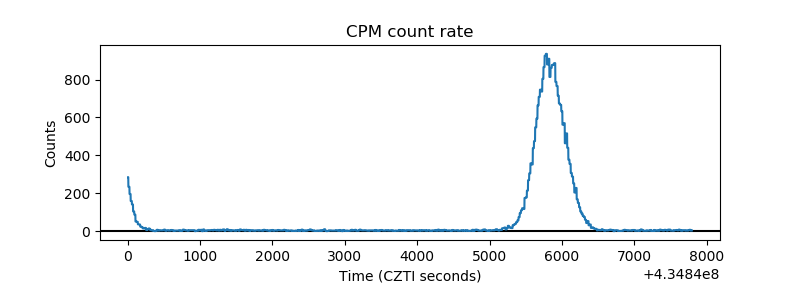 |
| CZT Counter | 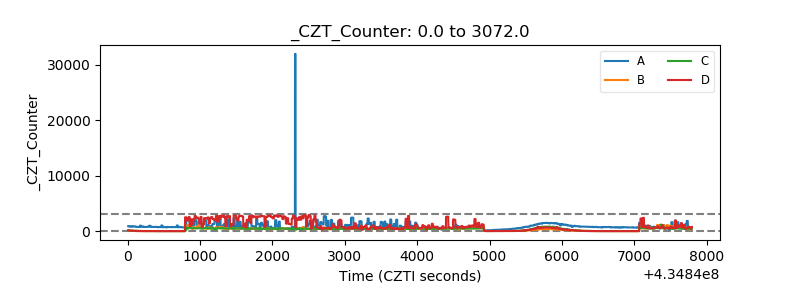 |
| +2.5 Volts monitor | 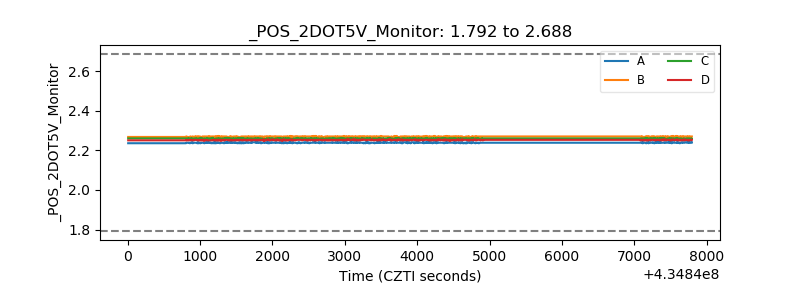 |
| +5 Volts monitor | 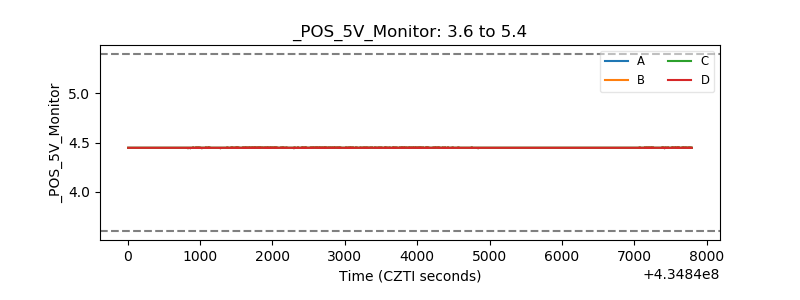 |
| _ROLL_ROT | 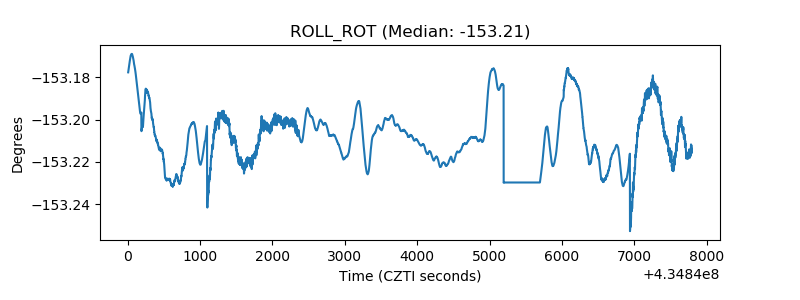 |
| _Roll_DEC | 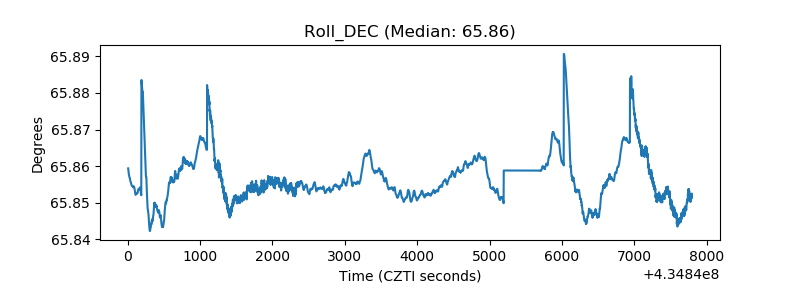 |
| _Roll_RA | 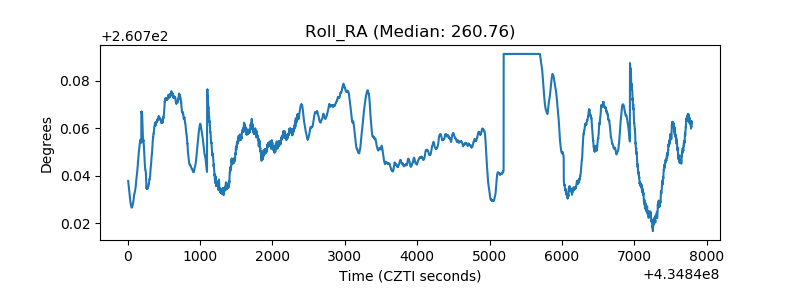 |
| Veto Counter | 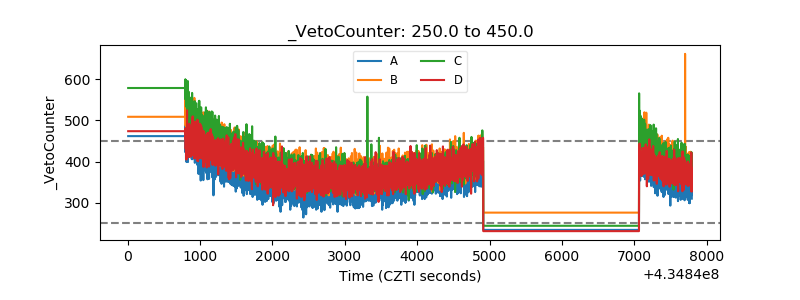 |