| Param | Original file | Final file |
|---|---|---|
| Filename | modeM0/AS1A12_018T01_9000005874_43476cztM0_level2.fits | modeM0/AS1A12_018T01_9000005874_43476cztM0_level2_quad_clean.evt |
| Size (bytes) | 428,598,720 | 81,449,280 |
| Size | 408.7 MB | 77.7 MB |
| Events in quadrant A | 6,835,756 | 431,233 |
| Events in quadrant B | 2,602,490 | 588,282 |
| Events in quadrant C | 2,377,767 | 569,473 |
| Events in quadrant D | 3,645,743 | 513,640 |
| Mode M0 | |||
|---|---|---|---|
| Quadrant | BADHDUFLAG | Total packets | Discarded packets |
| A | 0 | 23951 | 6 |
| B | 0 | 11400 | 2 |
| C | 0 | 10514 | 2 |
| D | 0 | 14391 | 2 |
| Mode M9 | |||
|---|---|---|---|
| Quadrant | BADHDUFLAG | Total packets | Discarded packets |
| A | 0 | 34 | 0 |
| B | 0 | 34 | 0 |
| C | 0 | 35 | 0 |
| D | 0 | 35 | 0 |
| Mode SS | |||
|---|---|---|---|
| Quadrant | BADHDUFLAG | Total packets | Discarded packets |
| A | 0 | 106 | 0 |
| B | 0 | 106 | 0 |
| C | 0 | 106 | 0 |
| D | 0 | 106 | 0 |
| Quadrant | Total seconds | Saturated seconds | Saturation percentage |
|---|---|---|---|
| A | 5185 | 1636 | 31.552555% |
| B | 5185 | 24 | 0.462874% |
| C | 5185 | 3 | 0.057859% |
| D | 5185 | 110 | 2.121504% |
Noise dominated data is calculated using 1-second bins in cleaned event files. If a bin has >2000 counts, and if more than 50% of those come from <1% of pixels, then it is considered to be noise-dominated and hence unusable.
| Quadrant | # 1 sec bins | Bins with >0 counts | Bins with >2000 counts | High rate bins dominated by noise | Noise dominated (total time) | Noise dominated (detector-on time) | Marked lightcurve |
|---|---|---|---|---|---|---|---|
| A | 7278 | 5186 | 1198 | 1198 | 16.46% | 23.10% | 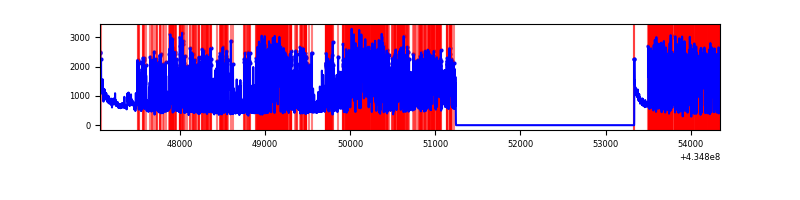 |
| B | 7278 | 5186 | 18 | 18 | 0.25% | 0.35% | 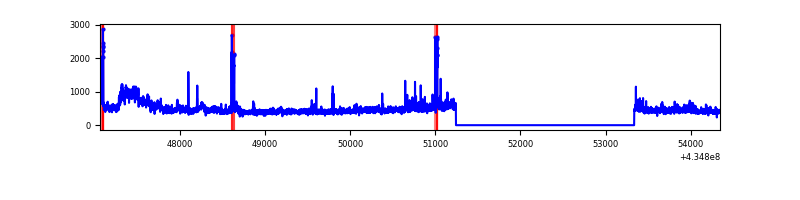 |
| C | 7278 | 5186 | 2 | 2 | 0.03% | 0.04% | 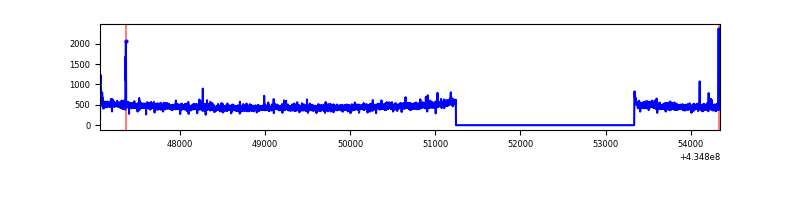 |
| D | 7278 | 5186 | 107 | 107 | 1.47% | 2.06% | 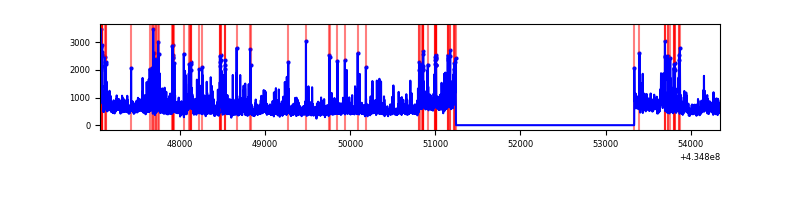 |
Top three noisy pixels from each quadrant. If the there are fewer than three noisy pixels in the level2.evt file, extra rows are filled as -1
| Pixel properties | Quadrant properties | ||||||
|---|---|---|---|---|---|---|---|
| Quadrant | DetID | PixID | Counts | Sigma | Mean | Median | Sigma |
| A | 15 | 222 | 4140843 | 41659.02 | 485 | 474 | 99.4 |
| A | 10 | 83 | 519678 | 5224.06 | 485 | 474 | 99.4 |
| A | 13 | 248 | 231703 | 2326.55 | 485 | 474 | 99.4 |
| B | 0 | 190 | 217237 | 2062.45 | 545 | 530 | 105.1 |
| B | 0 | 245 | 88605 | 838.23 | 545 | 530 | 105.1 |
| B | 5 | 255 | 40587 | 381.23 | 545 | 530 | 105.1 |
| C | 15 | 214 | 224951 | 1787.68 | 537 | 538 | 125.5 |
| C | 3 | 233 | 34703 | 272.16 | 537 | 538 | 125.5 |
| C | 0 | 207 | 11330 | 85.97 | 537 | 538 | 125.5 |
| D | 2 | 16 | 612297 | 4752.07 | 527 | 511 | 128.7 |
| D | 1 | 52 | 427831 | 3319.22 | 527 | 511 | 128.7 |
| D | 7 | 96 | 148076 | 1146.21 | 527 | 511 | 128.7 |
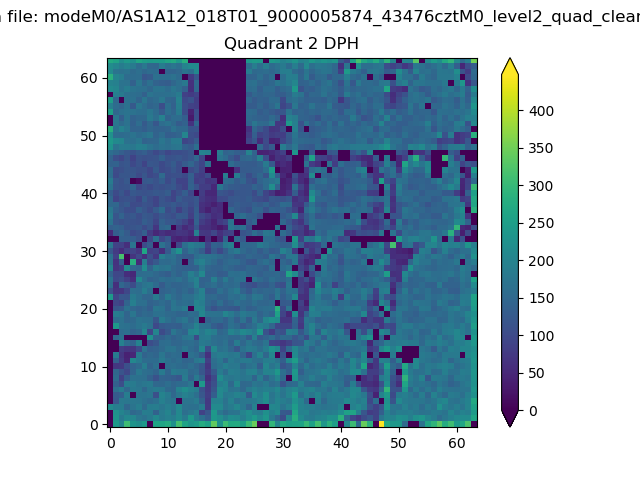
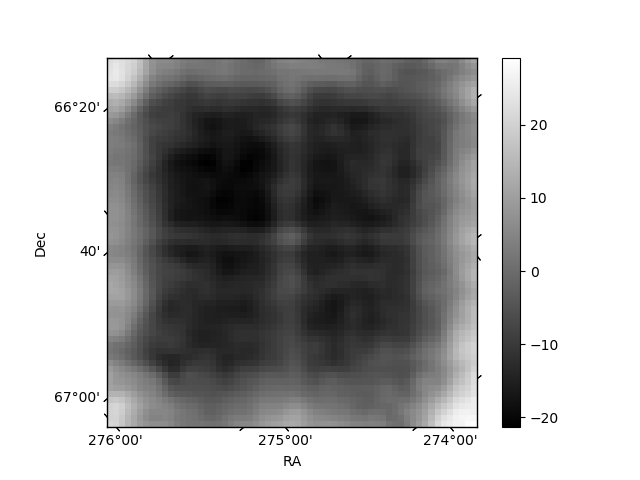
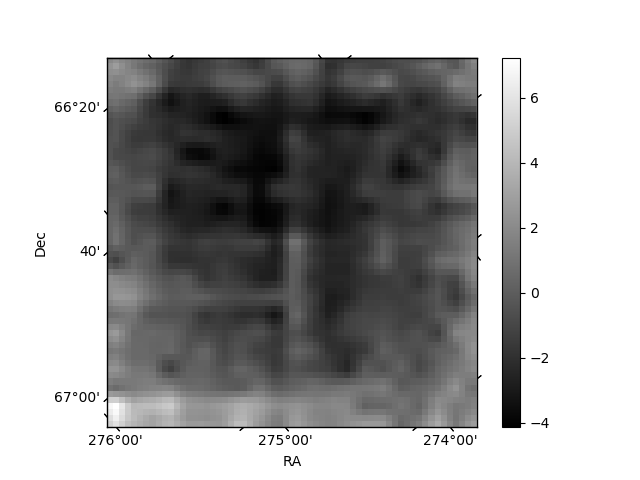
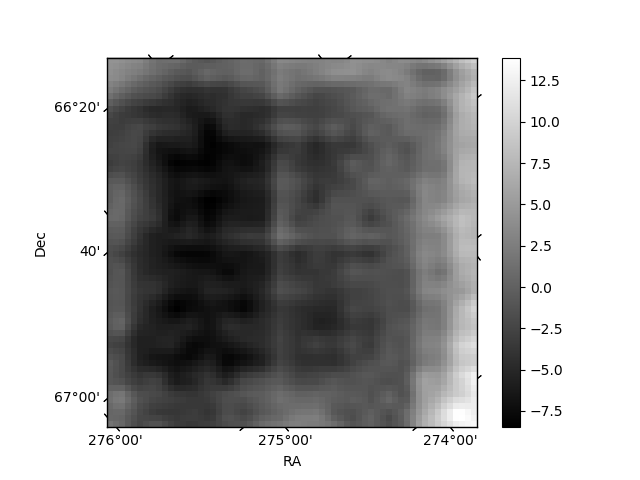
Histogram calculated using DETX and DETY for each event in the final _common_clean file
| Quadrant A | 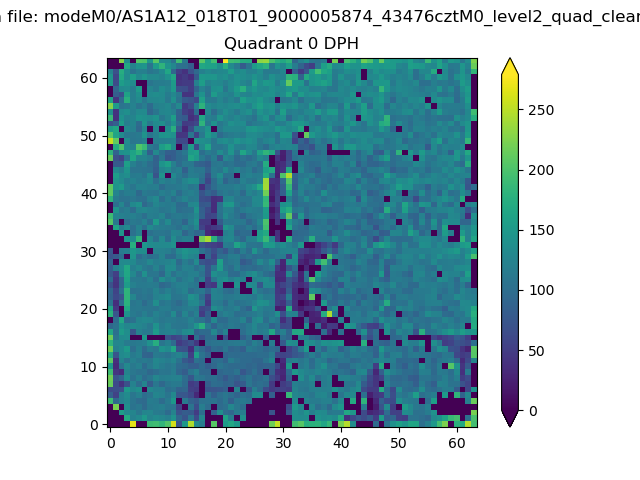 |
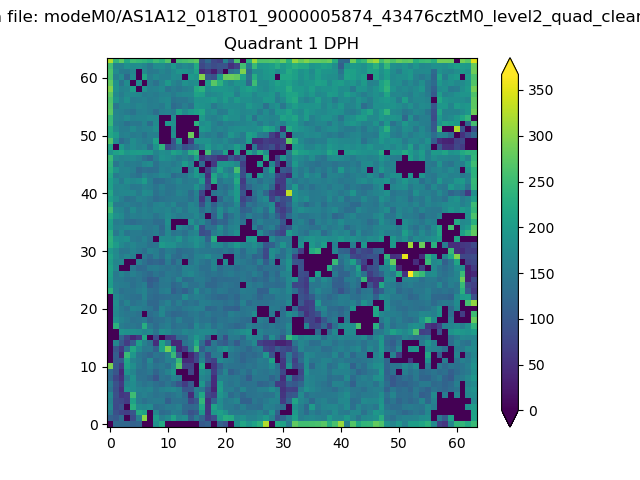 |
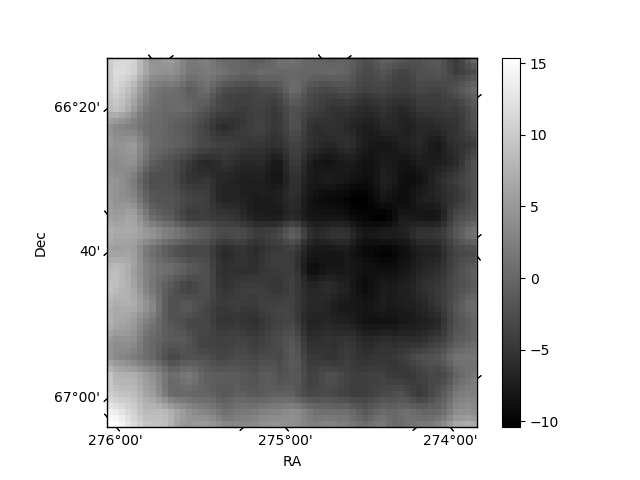
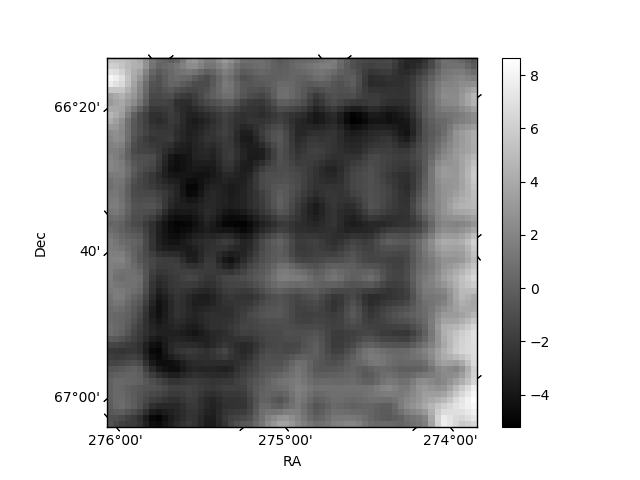
Quadrant B |
|---|---|---|---|
| Quadrant D | 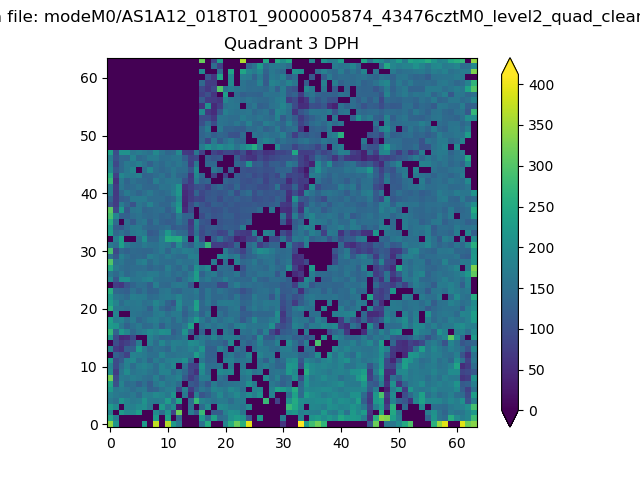 |
 |
Quadrant C |
| Plot type | Count rate plots | Images |
|---|---|---|
| Comparison with Poisson distribution Blue bars denote a histogram of data divided into 1 sec bins. Red curve is a Poisson curve with rate = median count rate of data. |
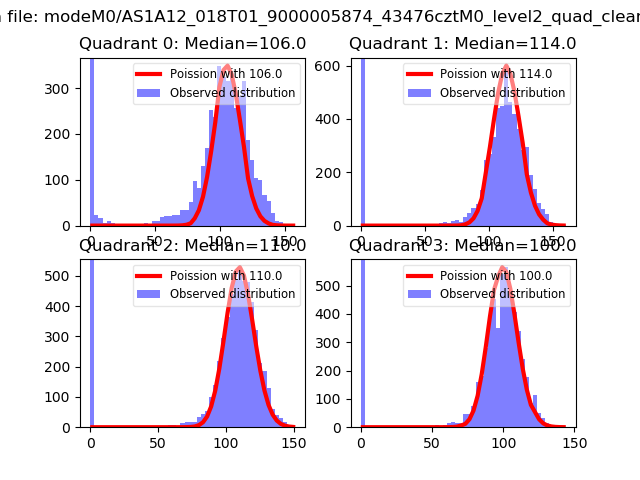 |
 |
| Quadrant-wise count rates Data is divided into 100 sec bins |
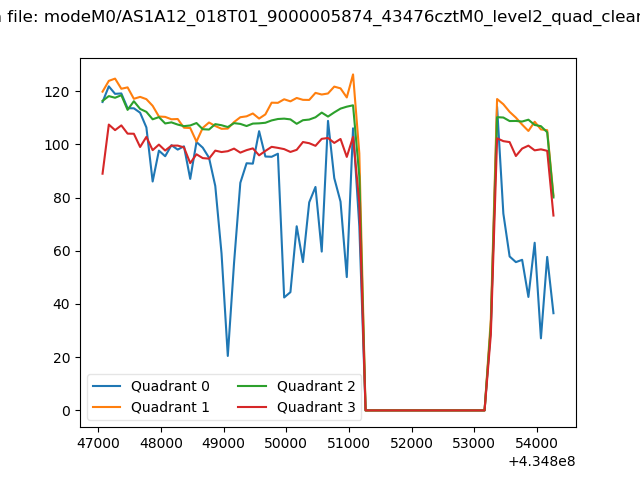 |
|
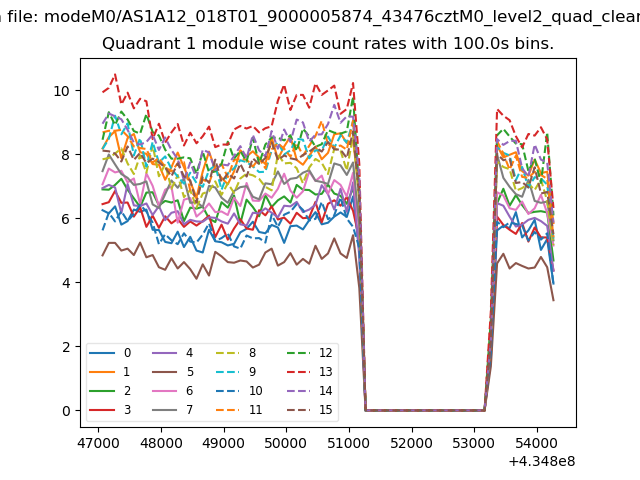
| Module-wise count rates for Quadrant A Data is divided into 100 sec bins |
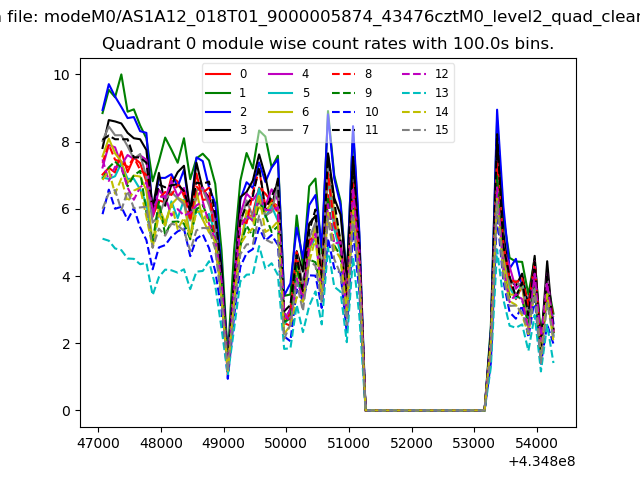 |
 |
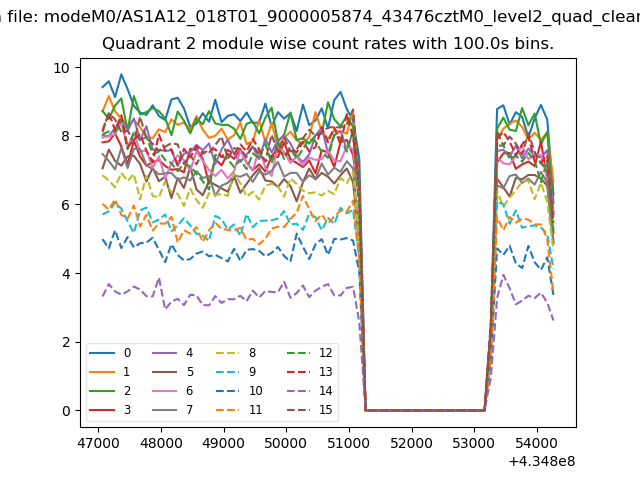
| Module-wise count rates for Quadrant B Data is divided into 100 sec bins |
 |
 |
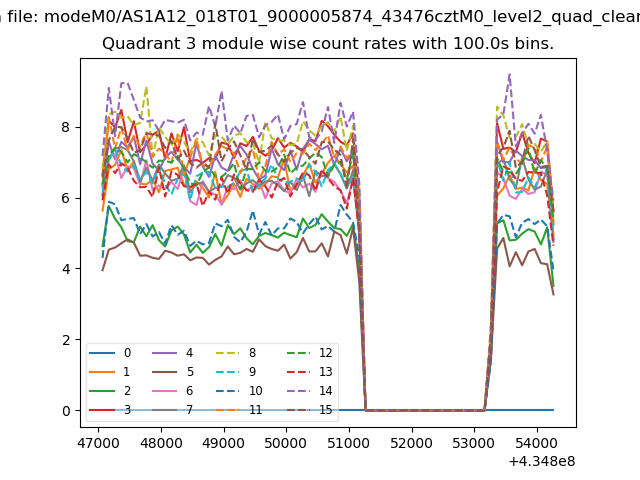
| Module-wise count rates for Quadrant C Data is divided into 100 sec bins |
 |
 |
| Module-wise count rates for Quadrant D Data is divided into 100 sec bins |
 |
 |
| Parameter | Plot |
|---|---|
| CZT HV Monitor | 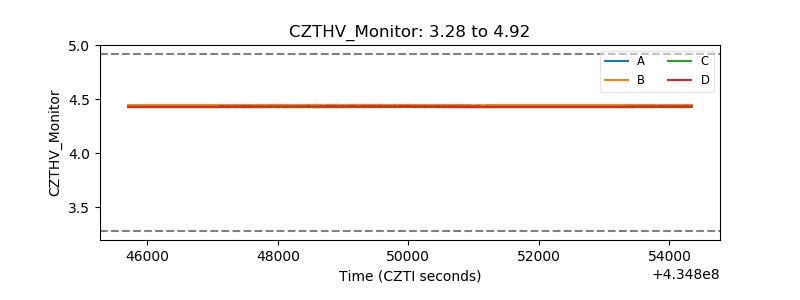 |
| D_VDD | 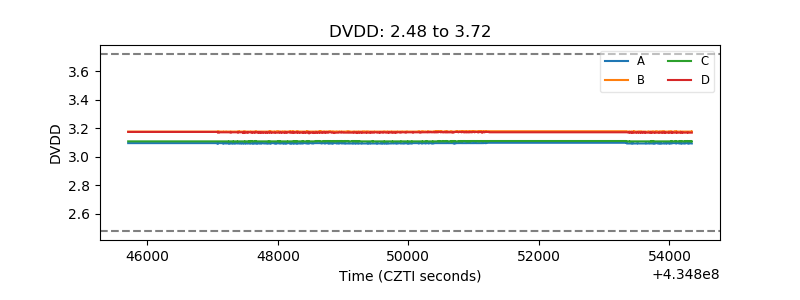 |
| Temperature 1 | 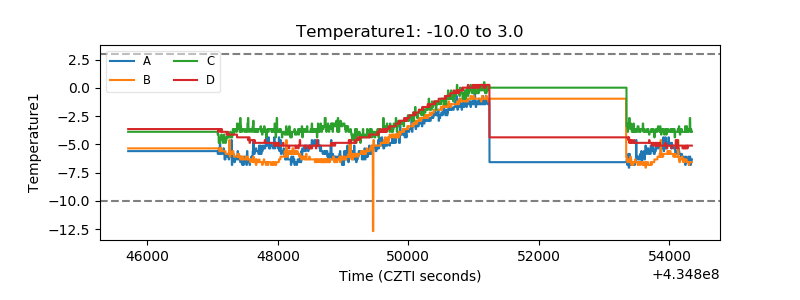 |
| Veto HV Monitor | 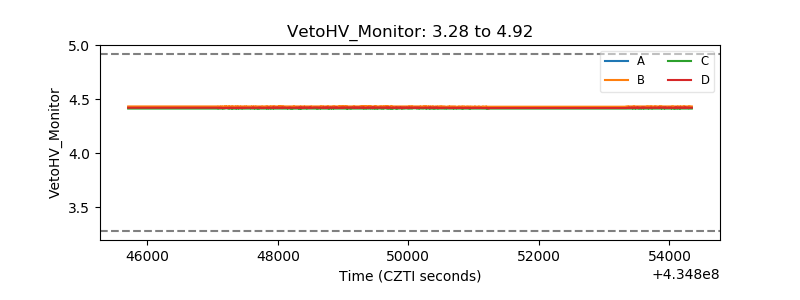 |
| Veto LLD | 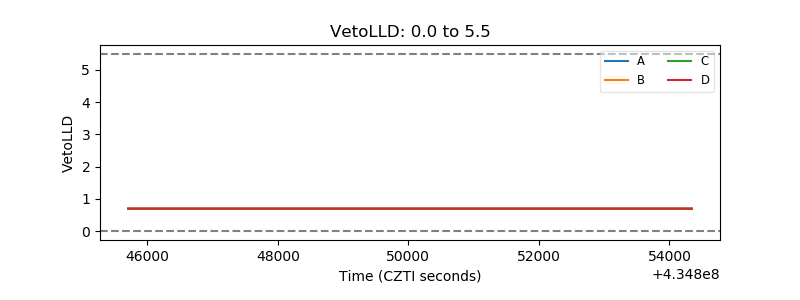 |
| Alpha Counter | 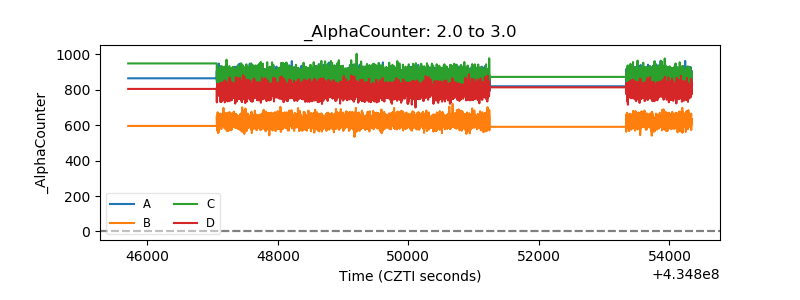 |
| _CPM_Rate | 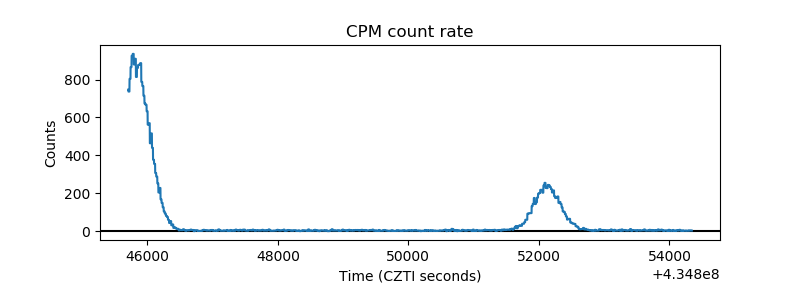 |
| CZT Counter | 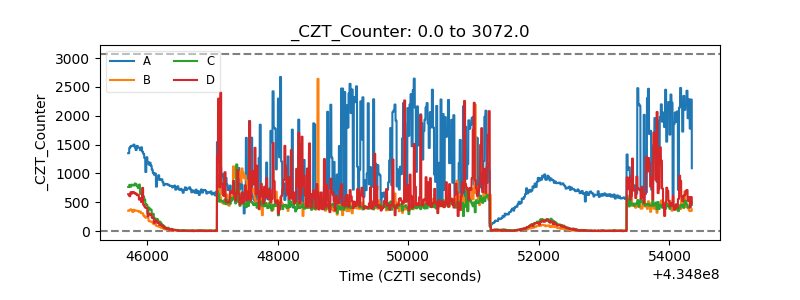 |
| +2.5 Volts monitor | 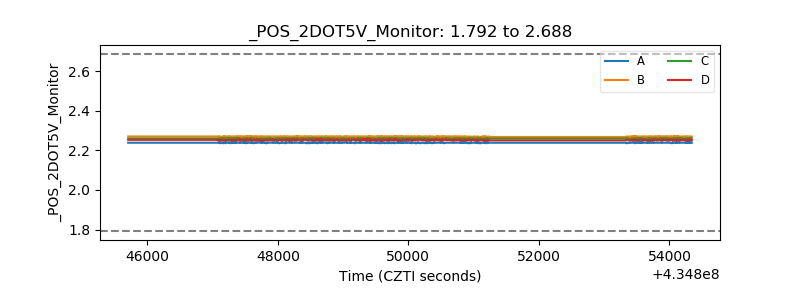 |
| +5 Volts monitor | 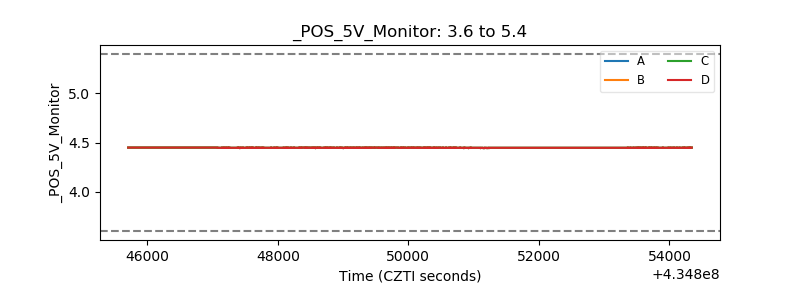 |
| _ROLL_ROT | 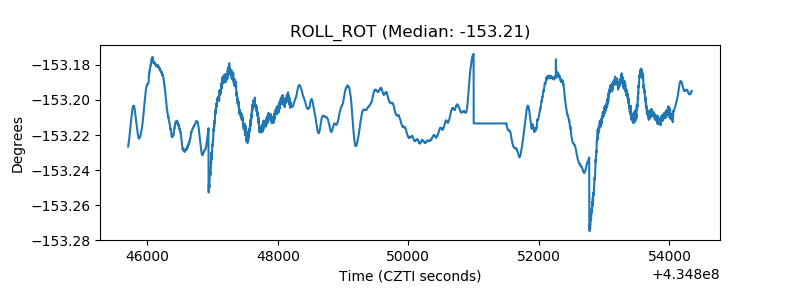 |
| _Roll_DEC | 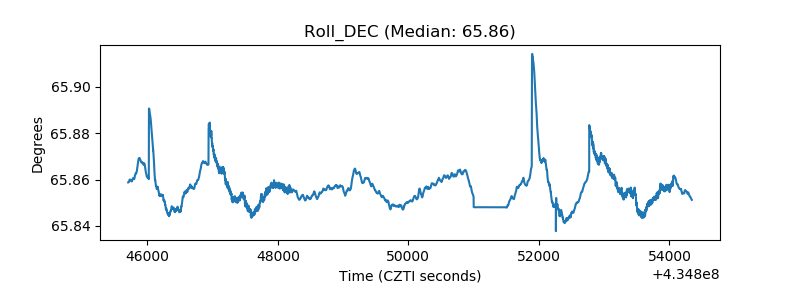 |
| _Roll_RA | 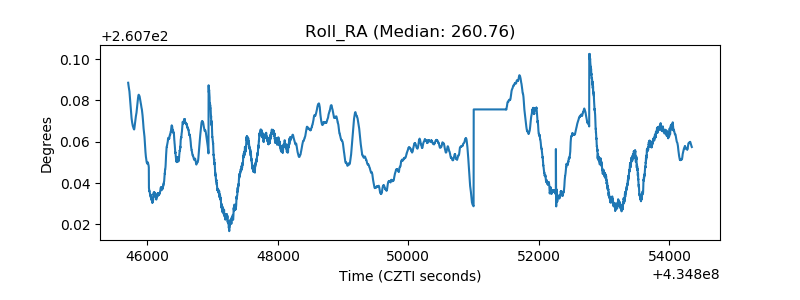 |
| Veto Counter | 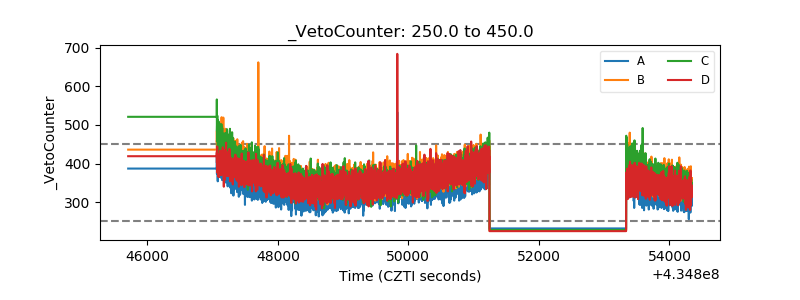 |