| Param | Original file | Final file |
|---|---|---|
| Filename | modeM0/AS1A12_018T01_9000005874_43477cztM0_level2.fits | modeM0/AS1A12_018T01_9000005874_43477cztM0_level2_quad_clean.evt |
| Size (bytes) | 492,068,160 | 80,262,720 |
| Size | 469.3 MB | 76.5 MB |
| Events in quadrant A | 6,687,673 | 451,143 |
| Events in quadrant B | 2,564,434 | 591,416 |
| Events in quadrant C | 2,453,337 | 568,637 |
| Events in quadrant D | 6,091,805 | 442,708 |
| Mode M0 | |||
|---|---|---|---|
| Quadrant | BADHDUFLAG | Total packets | Discarded packets |
| A | 0 | 23601 | 4 |
| B | 0 | 11586 | 2 |
| C | 0 | 10839 | 2 |
| D | 0 | 21799 | 2 |
| Mode M9 | |||
|---|---|---|---|
| Quadrant | BADHDUFLAG | Total packets | Discarded packets |
| A | 0 | 36 | 0 |
| B | 0 | 37 | 0 |
| C | 0 | 37 | 0 |
| D | 0 | 37 | 0 |
| Mode SS | |||
|---|---|---|---|
| Quadrant | BADHDUFLAG | Total packets | Discarded packets |
| A | 0 | 110 | 0 |
| B | 0 | 110 | 0 |
| C | 0 | 110 | 0 |
| D | 0 | 110 | 0 |
| Quadrant | Total seconds | Saturated seconds | Saturation percentage |
|---|---|---|---|
| A | 5369 | 1543 | 28.739058% |
| B | 5369 | 14 | 0.260756% |
| C | 5369 | 2 | 0.037251% |
| D | 5369 | 986 | 18.364686% |
Noise dominated data is calculated using 1-second bins in cleaned event files. If a bin has >2000 counts, and if more than 50% of those come from <1% of pixels, then it is considered to be noise-dominated and hence unusable.
| Quadrant | # 1 sec bins | Bins with >0 counts | Bins with >2000 counts | High rate bins dominated by noise | Noise dominated (total time) | Noise dominated (detector-on time) | Marked lightcurve |
|---|---|---|---|---|---|---|---|
| A | 7222 | 5369 | 1173 | 1173 | 16.24% | 21.85% | 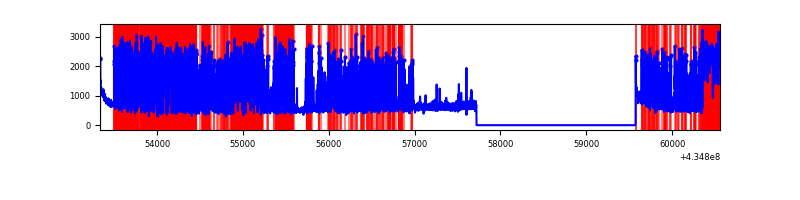 |
| B | 7223 | 5370 | 7 | 7 | 0.10% | 0.13% | 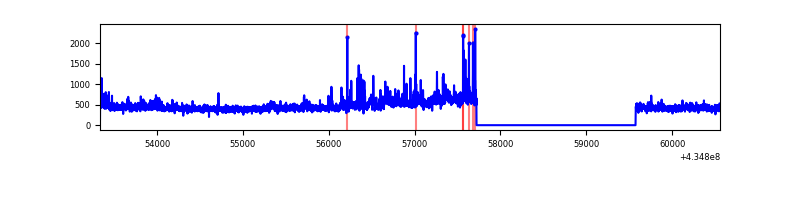 |
| C | 7223 | 5370 | 1 | 1 | 0.01% | 0.02% | 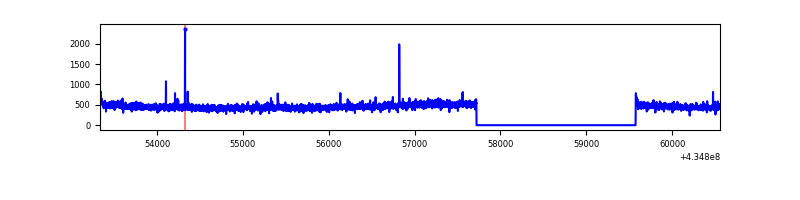 |
| D | 7223 | 5370 | 939 | 939 | 13.00% | 17.49% | 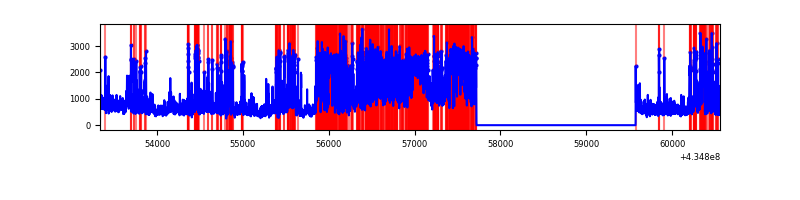 |
Top three noisy pixels from each quadrant. If the there are fewer than three noisy pixels in the level2.evt file, extra rows are filled as -1
| Pixel properties | Quadrant properties | ||||||
|---|---|---|---|---|---|---|---|
| Quadrant | DetID | PixID | Counts | Sigma | Mean | Median | Sigma |
| A | 15 | 222 | 3746758 | 35899.61 | 509 | 497 | 104.4 |
| A | 10 | 83 | 555517 | 5318.64 | 509 | 497 | 104.4 |
| A | 15 | 237 | 369836 | 3539.3 | 509 | 497 | 104.4 |
| B | 3 | 112 | 130082 | 1208.52 | 561 | 546 | 107.2 |
| B | 0 | 245 | 95719 | 887.93 | 561 | 546 | 107.2 |
| B | 0 | 186 | 42133 | 387.99 | 561 | 546 | 107.2 |
| C | 15 | 214 | 237770 | 1829.58 | 550 | 551 | 129.7 |
| C | 3 | 233 | 58561 | 447.41 | 550 | 551 | 129.7 |
| C | 15 | 159 | 8585 | 61.96 | 550 | 551 | 129.7 |
| D | 13 | 249 | 1516319 | 12473.87 | 498 | 483 | 121.5 |
| D | 1 | 52 | 854445 | 7027.28 | 498 | 483 | 121.5 |
| D | 2 | 16 | 677095 | 5567.86 | 498 | 483 | 121.5 |
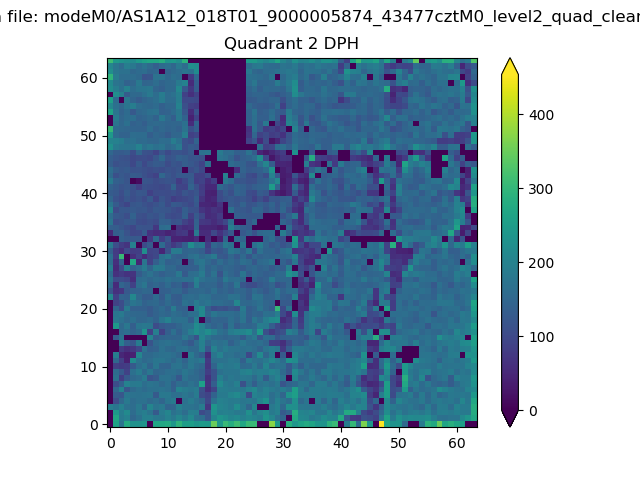
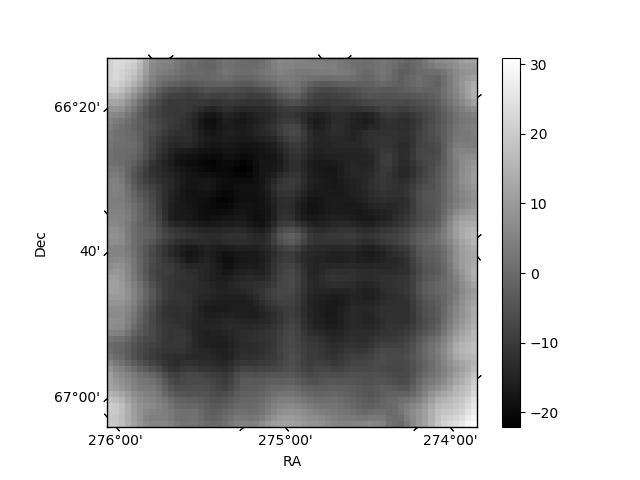
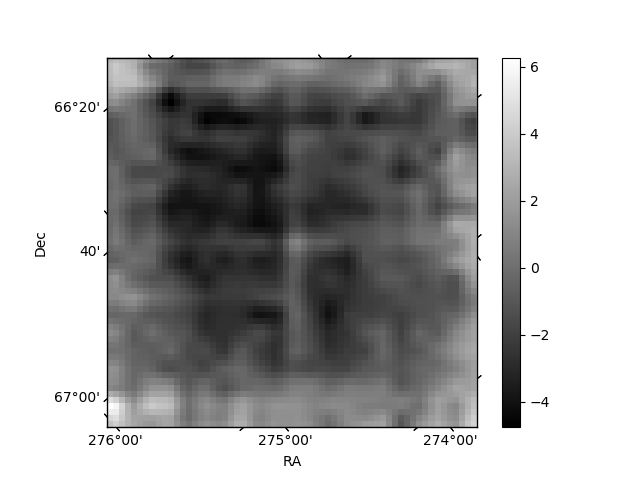
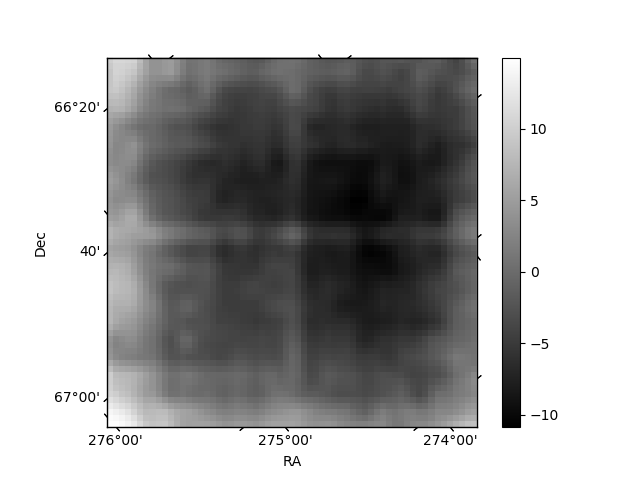
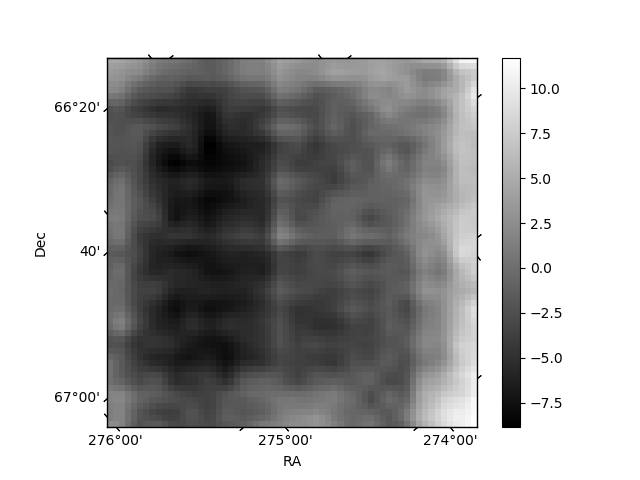
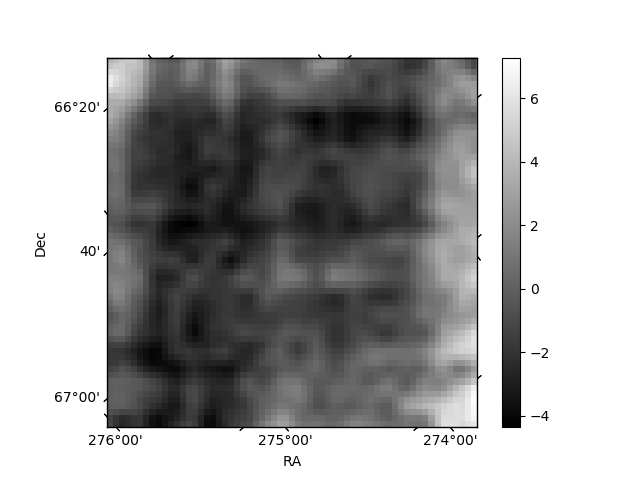
Histogram calculated using DETX and DETY for each event in the final _common_clean file
| Quadrant A | 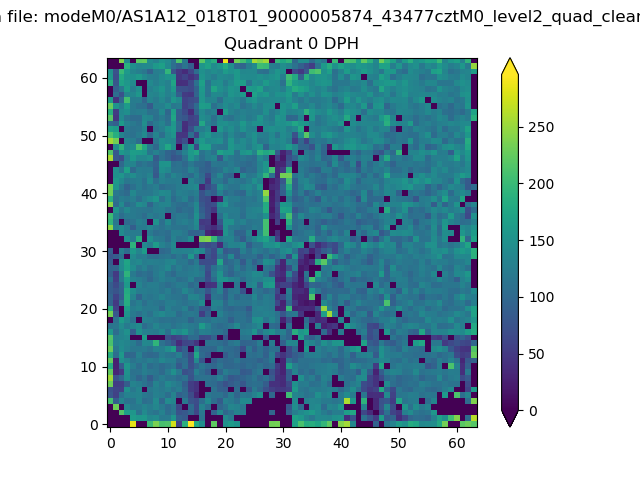 |
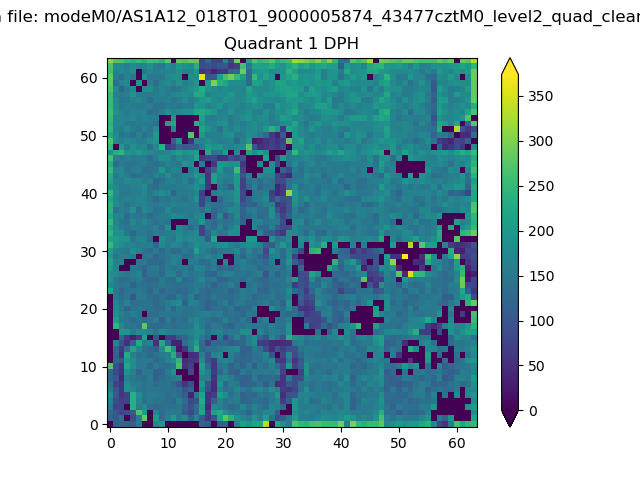 |
Quadrant B |
|---|---|---|---|
| Quadrant D | 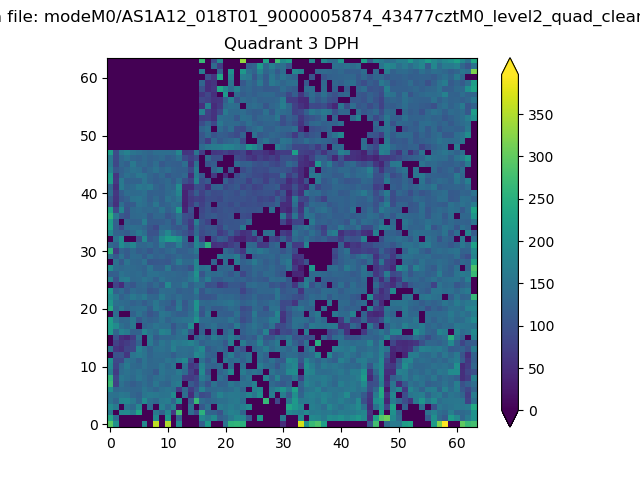 |
 |
Quadrant C |
| Plot type | Count rate plots | Images |
|---|---|---|
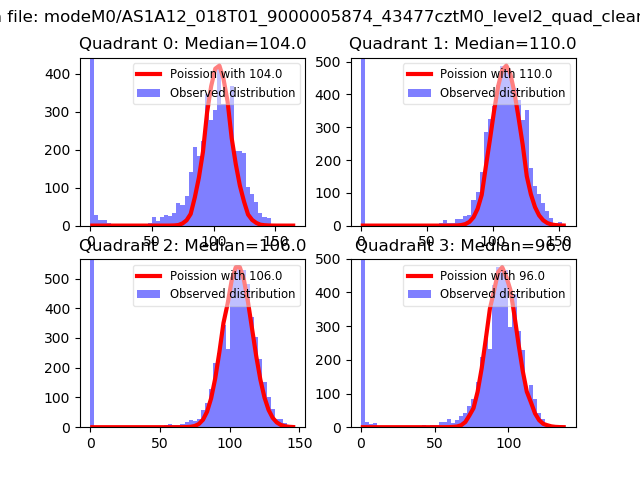
| Comparison with Poisson distribution Blue bars denote a histogram of data divided into 1 sec bins. Red curve is a Poisson curve with rate = median count rate of data. |
 |
 |
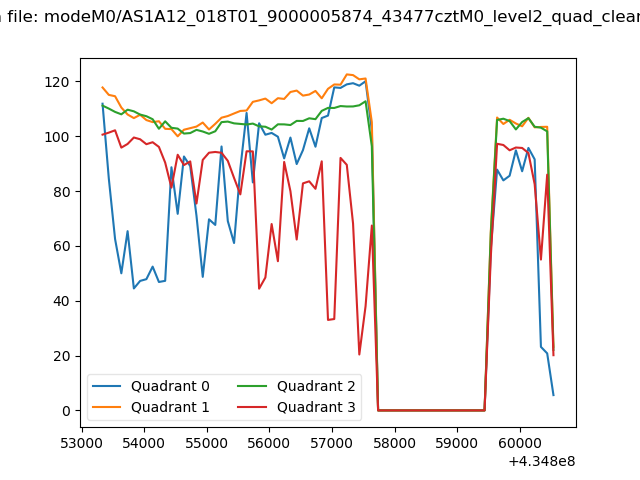
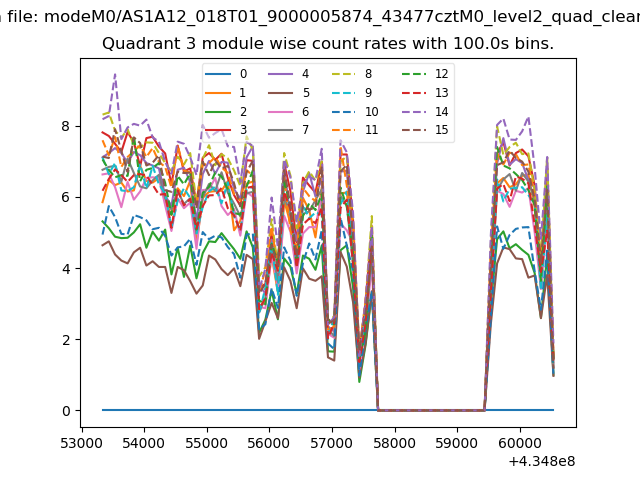
| Quadrant-wise count rates Data is divided into 100 sec bins |
 |
|
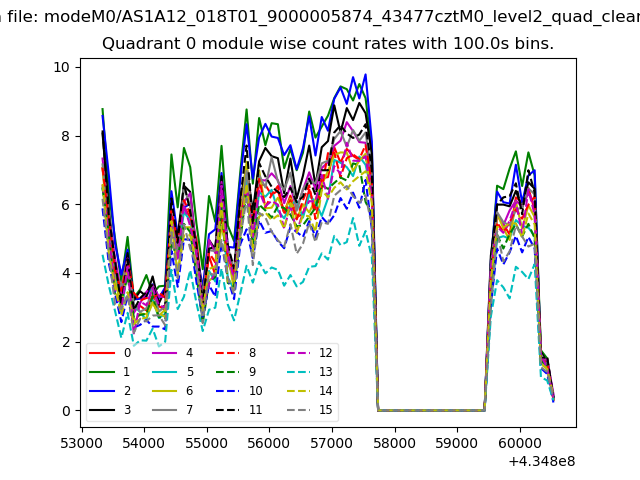
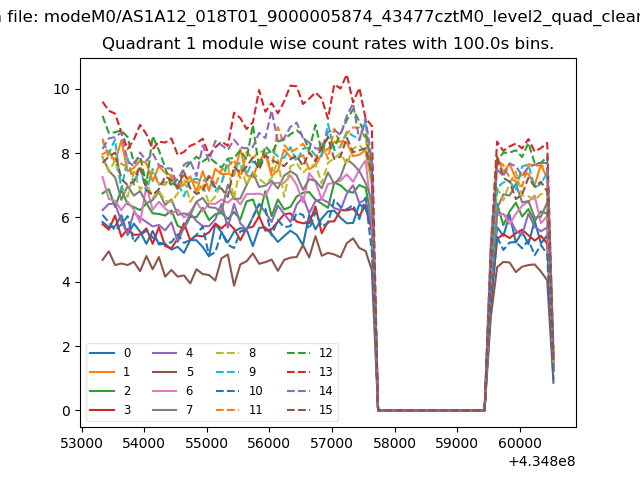
| Module-wise count rates for Quadrant A Data is divided into 100 sec bins |
 |
 |
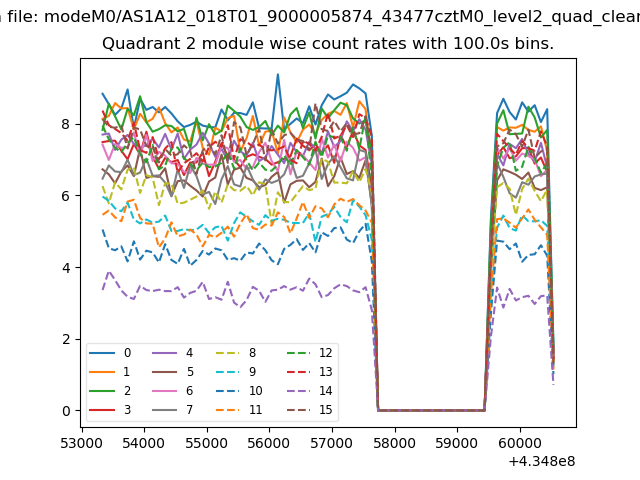
| Module-wise count rates for Quadrant B Data is divided into 100 sec bins |
 |
 |
| Module-wise count rates for Quadrant C Data is divided into 100 sec bins |
 |
 |
| Module-wise count rates for Quadrant D Data is divided into 100 sec bins |
 |
 |
| Parameter | Plot |
|---|---|
| CZT HV Monitor | 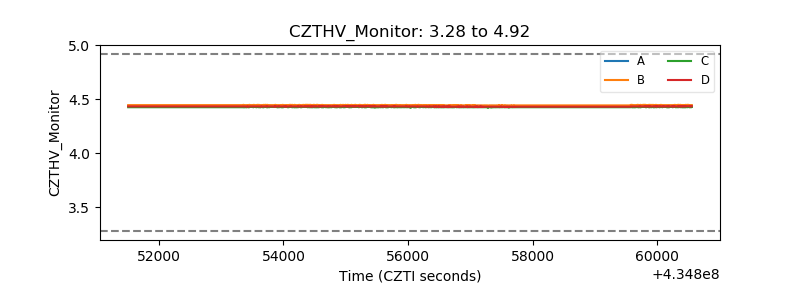 |
| D_VDD | 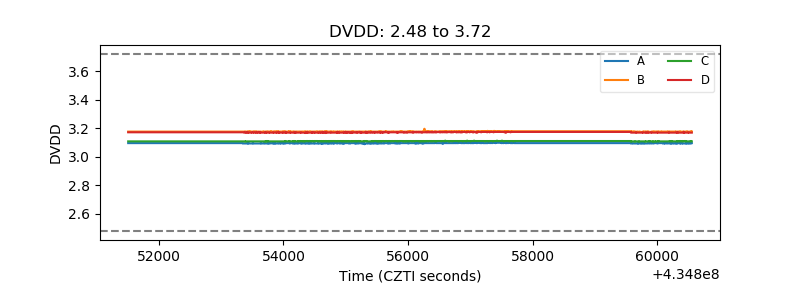 |
| Temperature 1 | 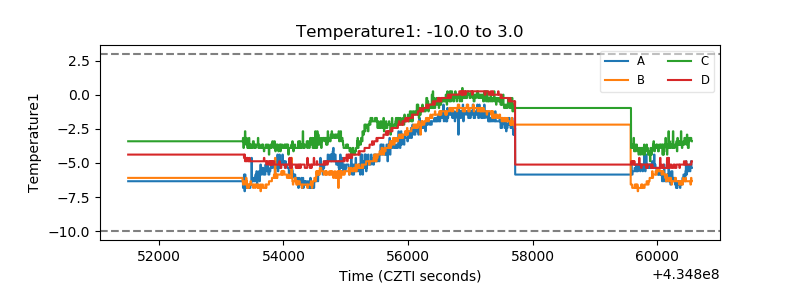 |
| Veto HV Monitor | 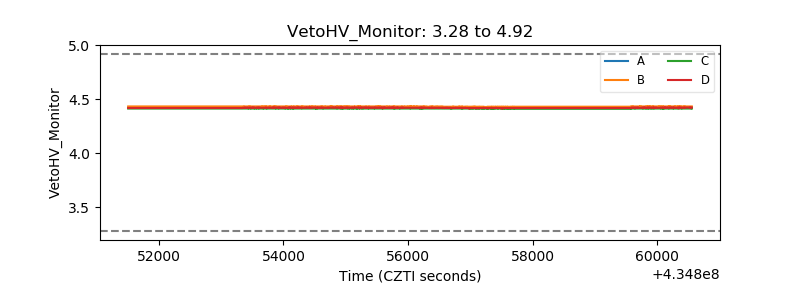 |
| Veto LLD | 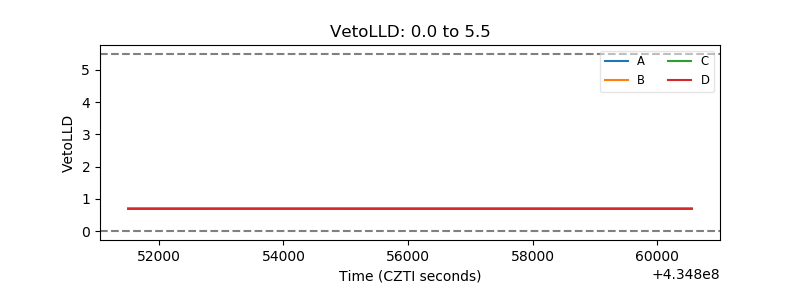 |
| Alpha Counter | 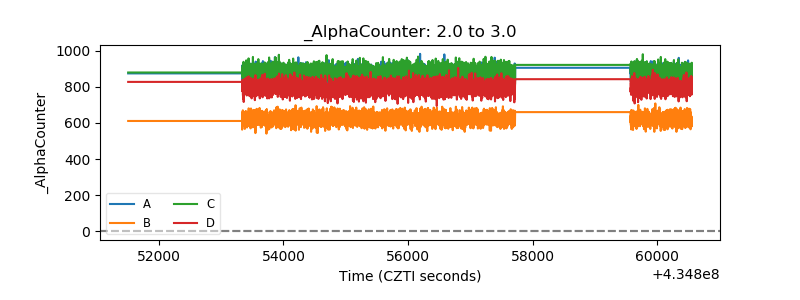 |
| _CPM_Rate | 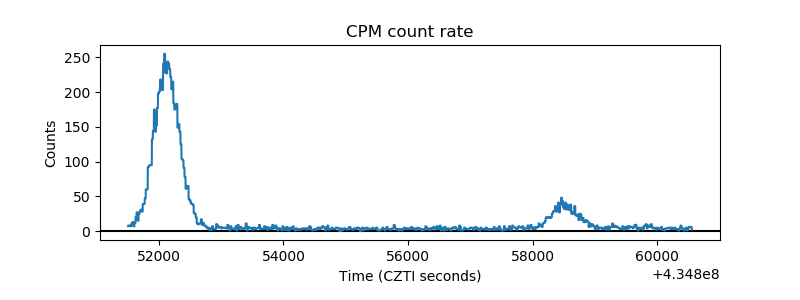 |
| CZT Counter | 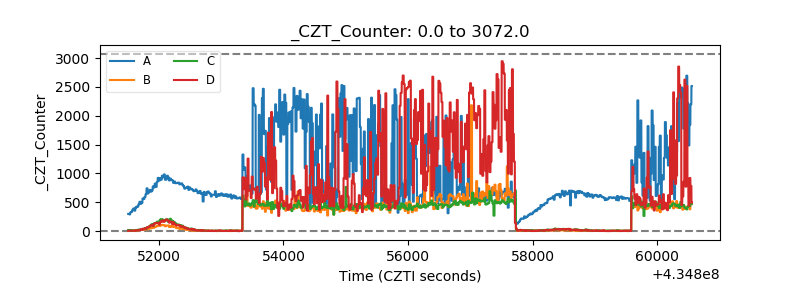 |
| +2.5 Volts monitor |  |
| +5 Volts monitor | 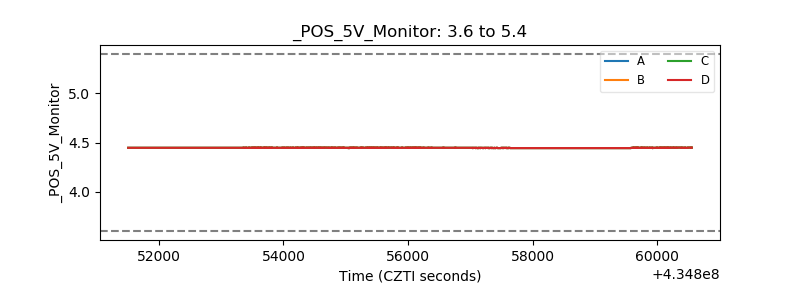 |
| _ROLL_ROT | 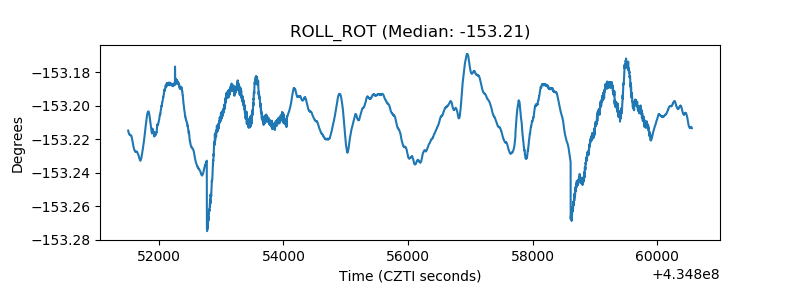 |
| _Roll_DEC | 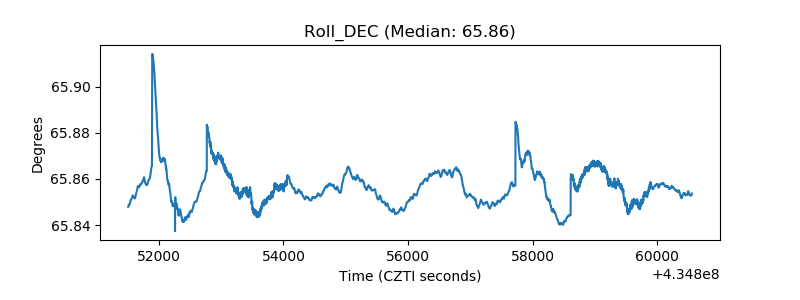 |
| _Roll_RA | 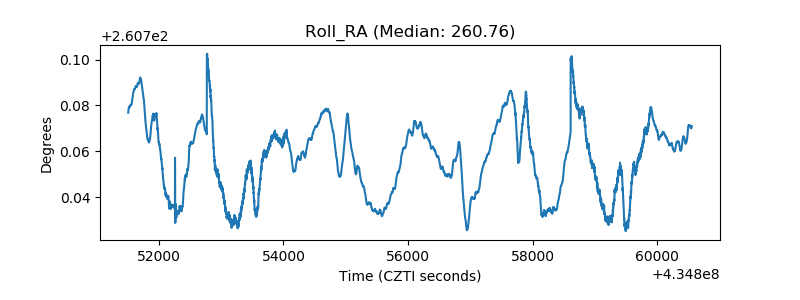 |
| Veto Counter | 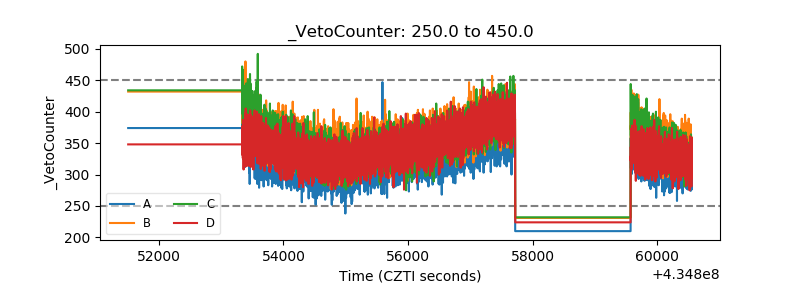 |