| Param | Original file | Final file |
|---|---|---|
| Filename | modeM0/AS1A12_018T01_9000005874_43478cztM0_level2.fits | modeM0/AS1A12_018T01_9000005874_43478cztM0_level2_quad_clean.evt |
| Size (bytes) | 486,639,360 | 86,158,080 |
| Size | 464.1 MB | 82.2 MB |
| Events in quadrant A | 6,072,910 | 519,758 |
| Events in quadrant B | 2,717,662 | 616,163 |
| Events in quadrant C | 2,616,491 | 592,180 |
| Events in quadrant D | 6,166,955 | 484,249 |
| Mode M0 | |||
|---|---|---|---|
| Quadrant | BADHDUFLAG | Total packets | Discarded packets |
| A | 0 | 21896 | 2 |
| B | 0 | 12124 | 2 |
| C | 0 | 11486 | 2 |
| D | 0 | 22307 | 2 |
| Mode M9 | |||
|---|---|---|---|
| Quadrant | BADHDUFLAG | Total packets | Discarded packets |
| A | 0 | 22 | 0 |
| B | 0 | 22 | 0 |
| C | 0 | 23 | 0 |
| D | 0 | 23 | 0 |
| Mode SS | |||
|---|---|---|---|
| Quadrant | BADHDUFLAG | Total packets | Discarded packets |
| A | 0 | 116 | 0 |
| B | 0 | 116 | 0 |
| C | 0 | 116 | 0 |
| D | 0 | 116 | 0 |
| Quadrant | Total seconds | Saturated seconds | Saturation percentage |
|---|---|---|---|
| A | 5660 | 1058 | 18.692580% |
| B | 5660 | 40 | 0.706714% |
| C | 5660 | 5 | 0.088339% |
| D | 5660 | 777 | 13.727915% |
Noise dominated data is calculated using 1-second bins in cleaned event files. If a bin has >2000 counts, and if more than 50% of those come from <1% of pixels, then it is considered to be noise-dominated and hence unusable.
| Quadrant | # 1 sec bins | Bins with >0 counts | Bins with >2000 counts | High rate bins dominated by noise | Noise dominated (total time) | Noise dominated (detector-on time) | Marked lightcurve |
|---|---|---|---|---|---|---|---|
| A | 7183 | 5661 | 721 | 721 | 10.04% | 12.74% | 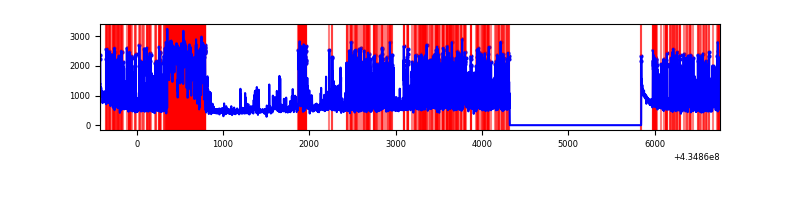 |
| B | 7183 | 5661 | 26 | 26 | 0.36% | 0.46% | 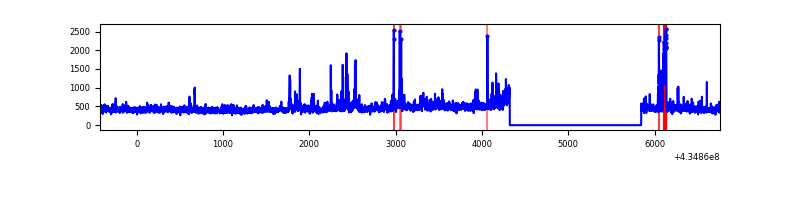 |
| C | 7183 | 5661 | 3 | 3 | 0.04% | 0.05% | 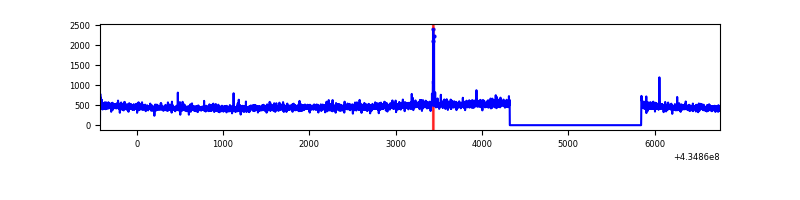 |
| D | 7183 | 5661 | 780 | 780 | 10.86% | 13.78% | 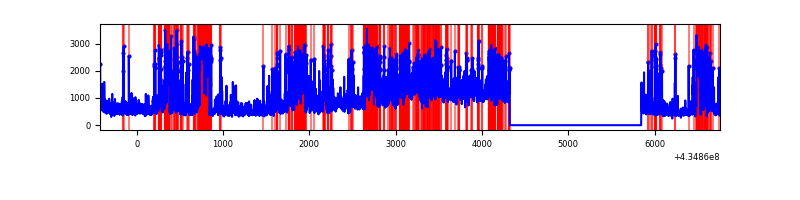 |
Top three noisy pixels from each quadrant. If the there are fewer than three noisy pixels in the level2.evt file, extra rows are filled as -1
| Pixel properties | Quadrant properties | ||||||
|---|---|---|---|---|---|---|---|
| Quadrant | DetID | PixID | Counts | Sigma | Mean | Median | Sigma |
| A | 15 | 222 | 2243636 | 19256.74 | 562 | 550 | 116.5 |
| A | 15 | 237 | 1027766 | 8818.58 | 562 | 550 | 116.5 |
| A | 10 | 83 | 614766 | 5273.0 | 562 | 550 | 116.5 |
| B | 5 | 255 | 87309 | 756.75 | 595 | 580 | 114.6 |
| B | 0 | 190 | 74379 | 643.93 | 595 | 580 | 114.6 |
| B | 0 | 245 | 59148 | 511.03 | 595 | 580 | 114.6 |
| C | 15 | 214 | 249877 | 1824.45 | 582 | 584 | 136.6 |
| C | 3 | 233 | 89832 | 653.16 | 582 | 584 | 136.6 |
| C | 13 | 61 | 3994 | 24.96 | 582 | 584 | 136.6 |
| D | 13 | 249 | 1246813 | 9232.07 | 549 | 530 | 135.0 |
| D | 2 | 16 | 922922 | 6832.79 | 549 | 530 | 135.0 |
| D | 1 | 52 | 888163 | 6575.31 | 549 | 530 | 135.0 |
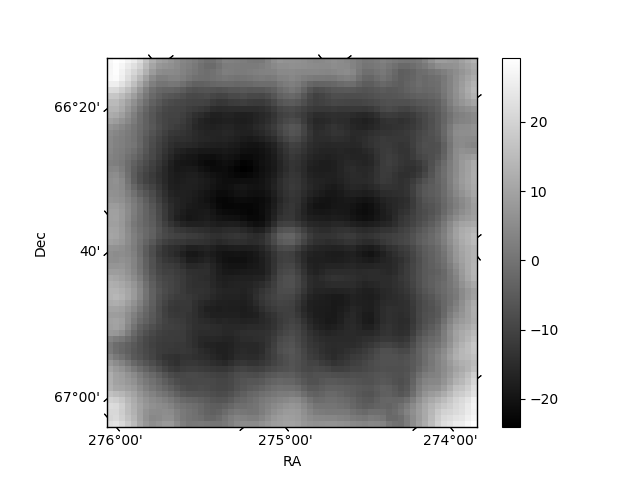
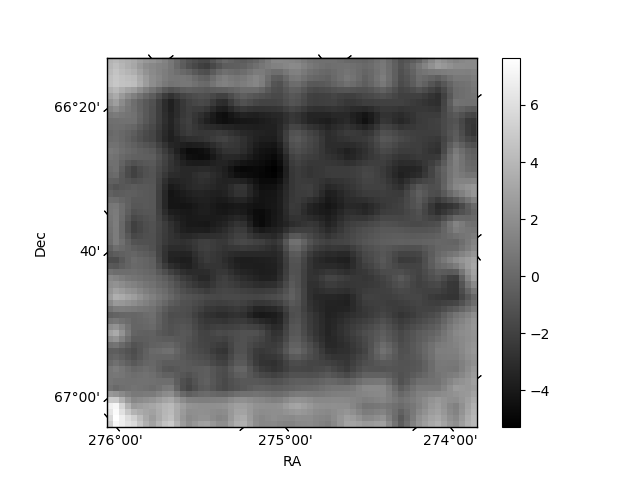
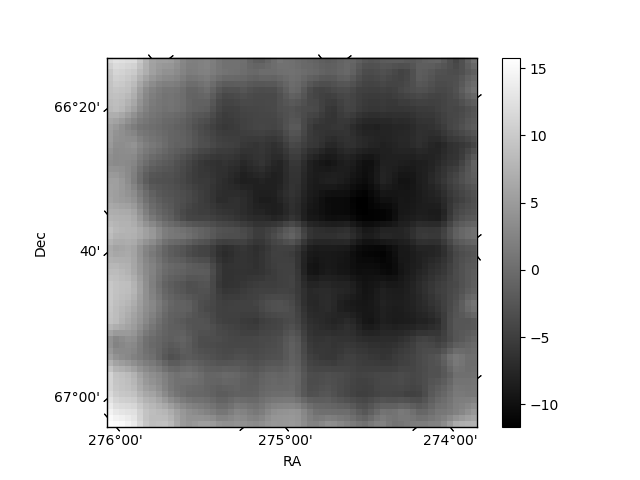
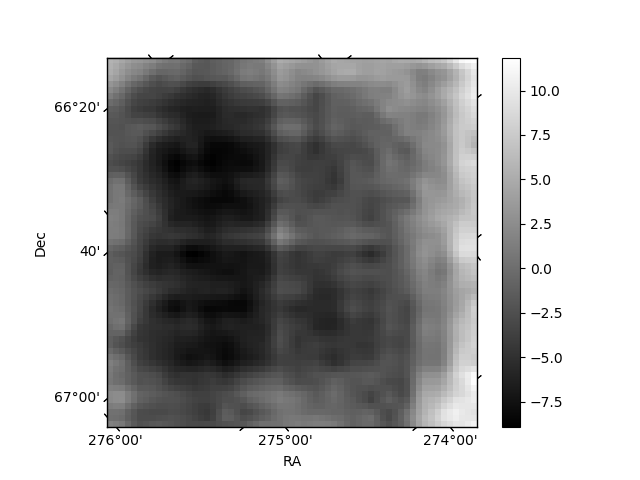
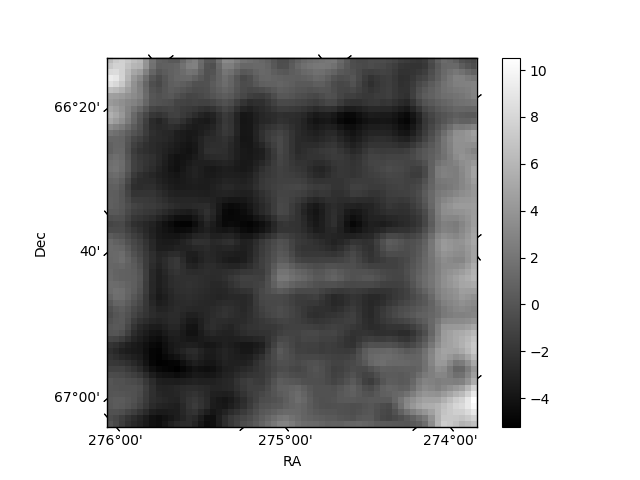
Histogram calculated using DETX and DETY for each event in the final _common_clean file
| Quadrant A | 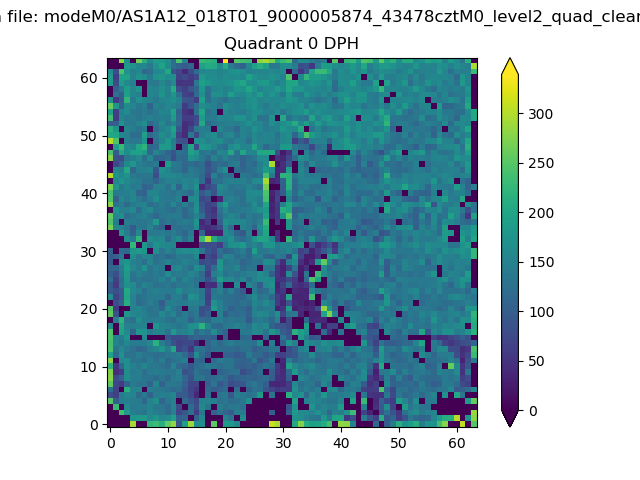 |
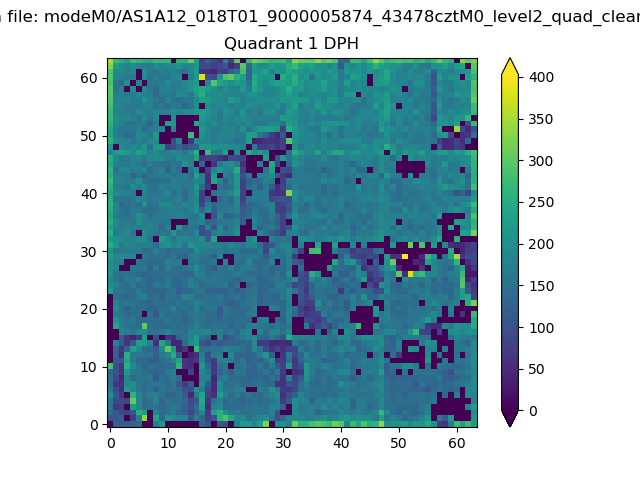 |
Quadrant B |
|---|---|---|---|
| Quadrant D | 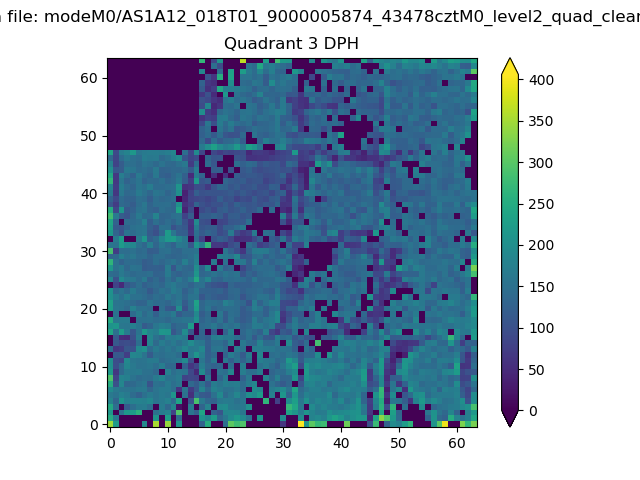 |
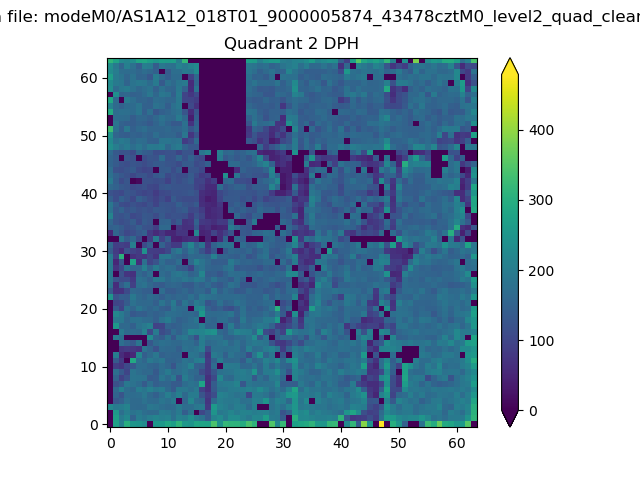 |
Quadrant C |
| Plot type | Count rate plots | Images |
|---|---|---|
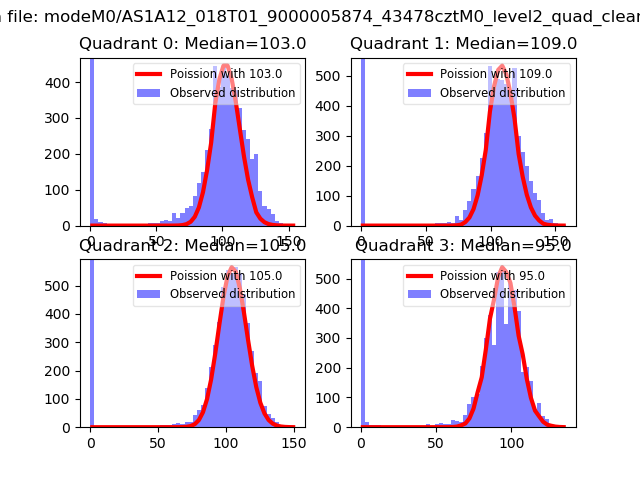
| Comparison with Poisson distribution Blue bars denote a histogram of data divided into 1 sec bins. Red curve is a Poisson curve with rate = median count rate of data. |
 |
 |
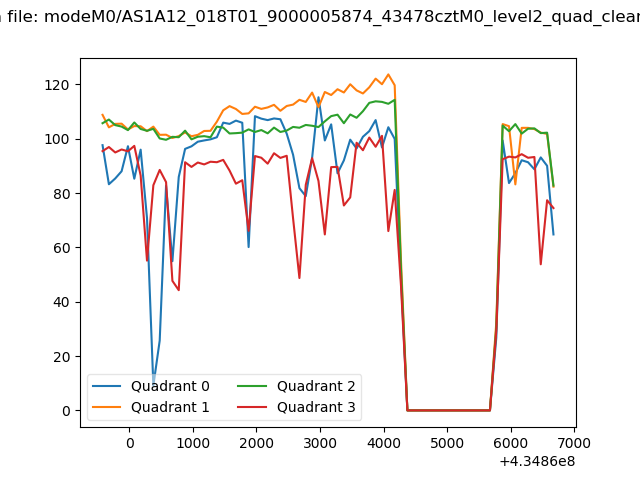
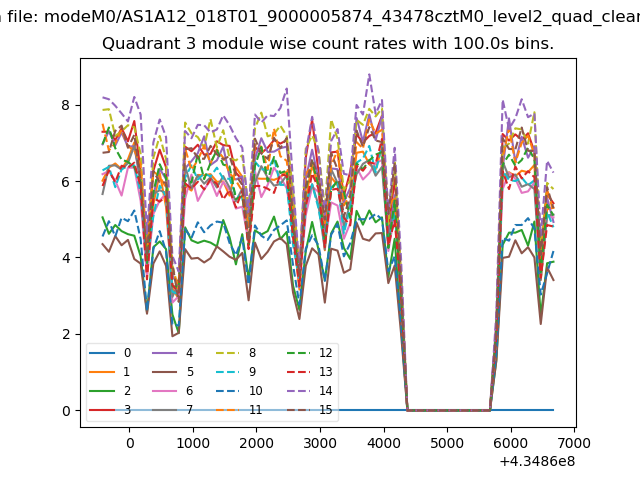
| Quadrant-wise count rates Data is divided into 100 sec bins |
 |
|
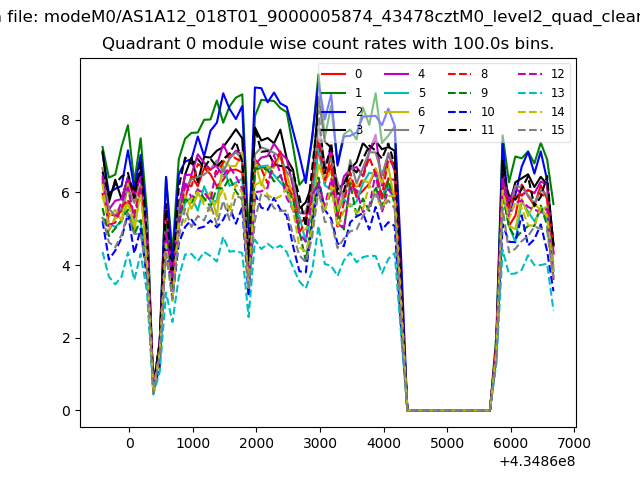
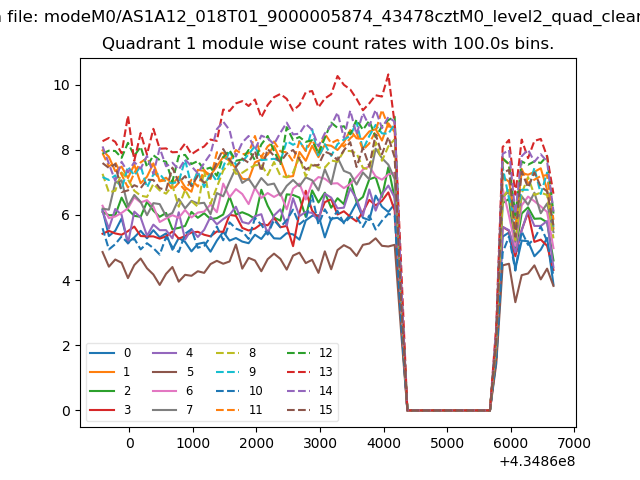
| Module-wise count rates for Quadrant A Data is divided into 100 sec bins |
 |
 |
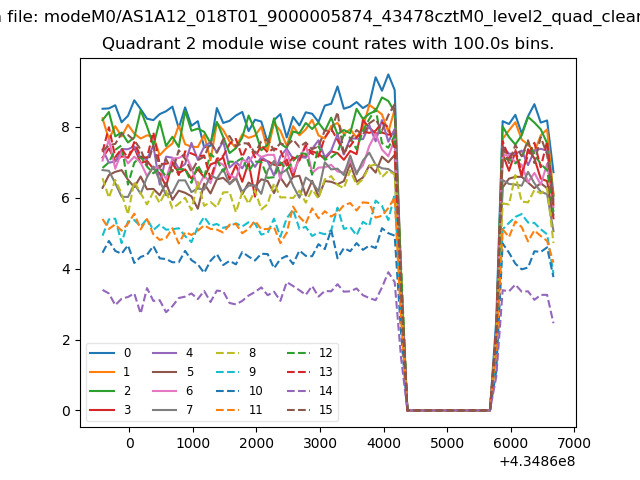
| Module-wise count rates for Quadrant B Data is divided into 100 sec bins |
 |
 |
| Module-wise count rates for Quadrant C Data is divided into 100 sec bins |
 |
 |
| Module-wise count rates for Quadrant D Data is divided into 100 sec bins |
 |
 |
| Parameter | Plot |
|---|---|
| CZT HV Monitor | 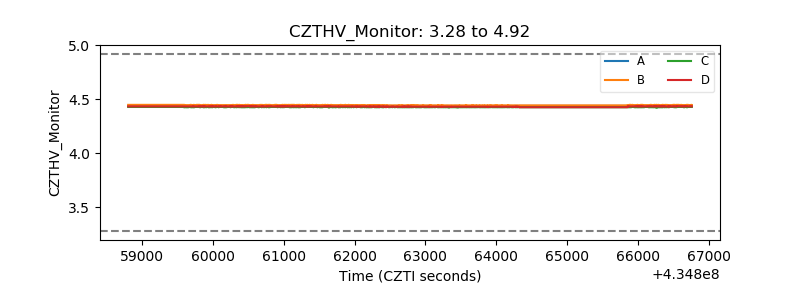 |
| D_VDD | 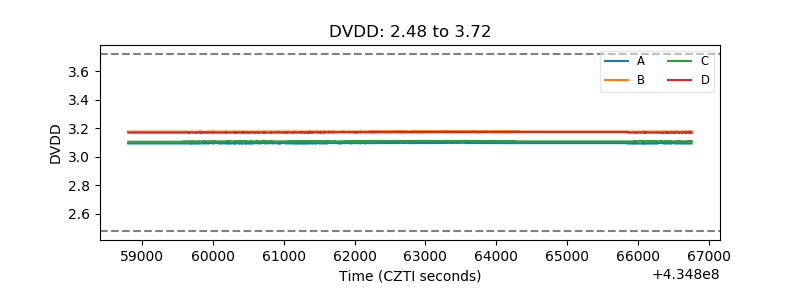 |
| Temperature 1 | 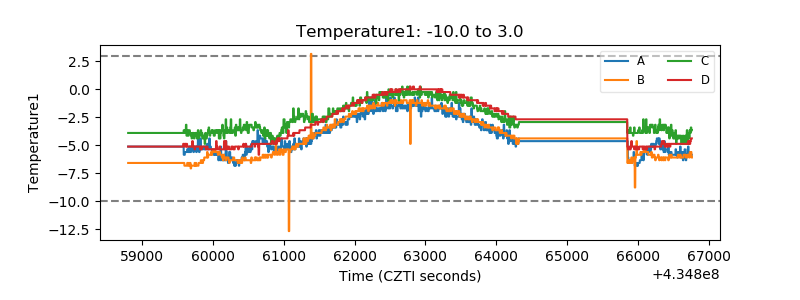 |
| Veto HV Monitor | 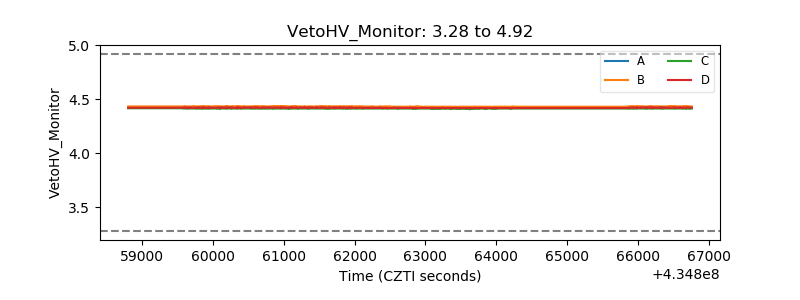 |
| Veto LLD | 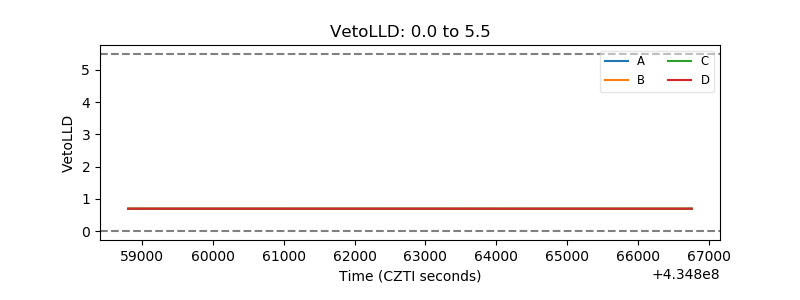 |
| Alpha Counter |  |
| _CPM_Rate | 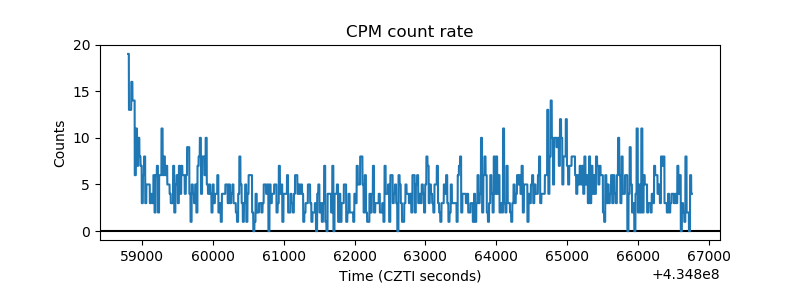 |
| CZT Counter | 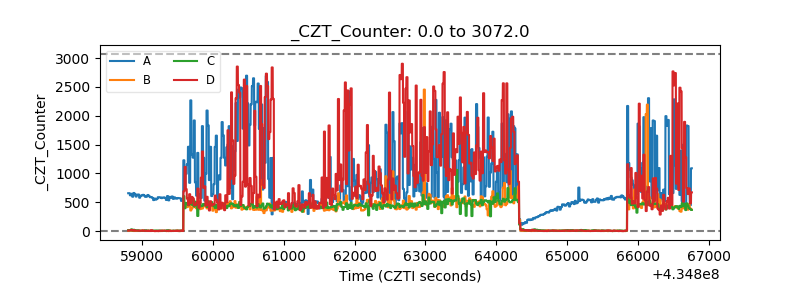 |
| +2.5 Volts monitor | 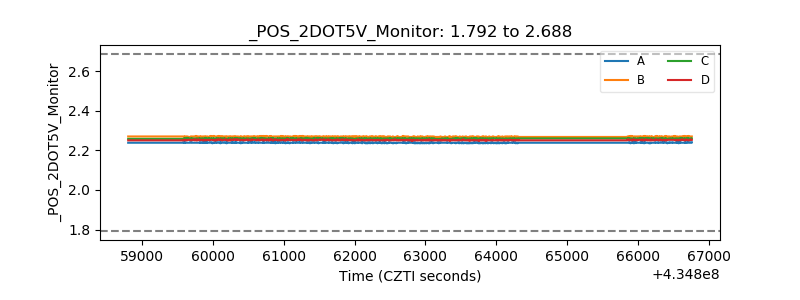 |
| +5 Volts monitor | 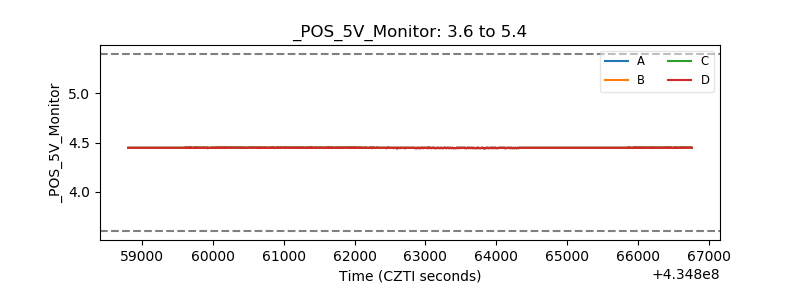 |
| _ROLL_ROT | 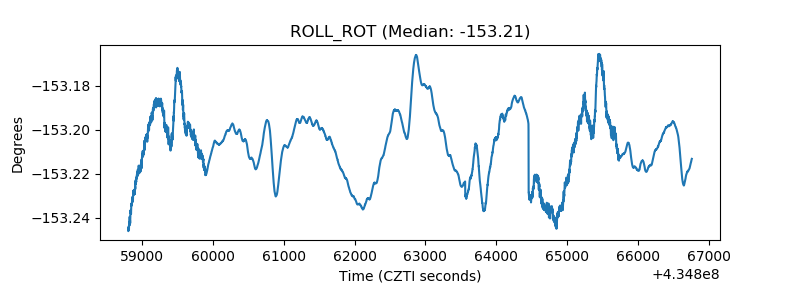 |
| _Roll_DEC | 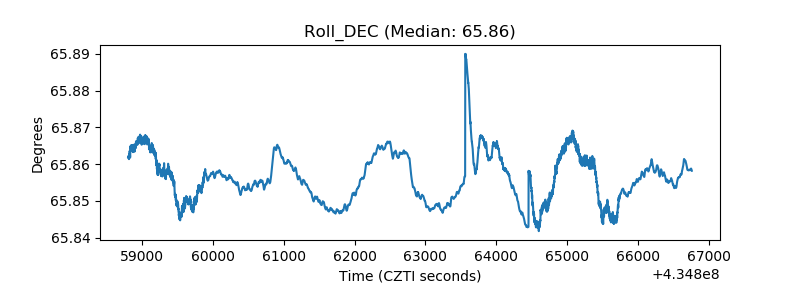 |
| _Roll_RA | 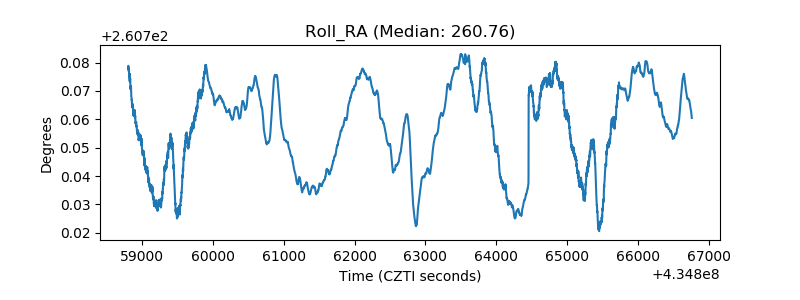 |
| Veto Counter | 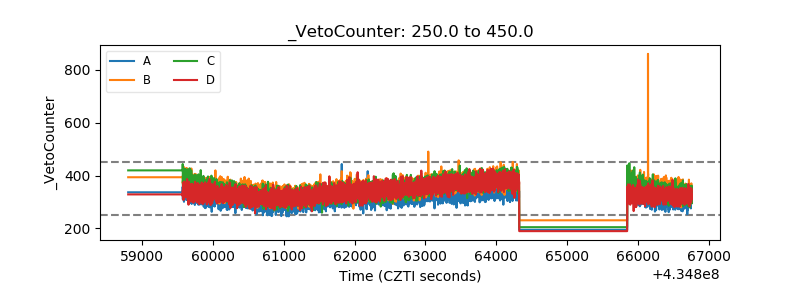 |