| Param | Original file | Final file |
|---|---|---|
| Filename | modeM0/AS1A12_018T01_9000005874_43479cztM0_level2.fits | modeM0/AS1A12_018T01_9000005874_43479cztM0_level2_quad_clean.evt |
| Size (bytes) | 447,814,080 | 88,997,760 |
| Size | 427.1 MB | 84.9 MB |
| Events in quadrant A | 5,058,736 | 576,194 |
| Events in quadrant B | 3,241,624 | 612,917 |
| Events in quadrant C | 2,639,176 | 592,941 |
| Events in quadrant D | 5,192,810 | 512,981 |
| Mode M0 | |||
|---|---|---|---|
| Quadrant | BADHDUFLAG | Total packets | Discarded packets |
| A | 0 | 18853 | 1 |
| B | 0 | 13588 | 1 |
| C | 0 | 11582 | 1 |
| D | 0 | 19435 | 1 |
| Mode M9 | |||
|---|---|---|---|
| Quadrant | BADHDUFLAG | Total packets | Discarded packets |
| A | 0 | 14 | 0 |
| B | 0 | 14 | 0 |
| C | 0 | 14 | 0 |
| D | 0 | 14 | 0 |
| Mode SS | |||
|---|---|---|---|
| Quadrant | BADHDUFLAG | Total packets | Discarded packets |
| A | 0 | 114 | 0 |
| B | 0 | 114 | 0 |
| C | 0 | 114 | 0 |
| D | 0 | 114 | 0 |
| Quadrant | Total seconds | Saturated seconds | Saturation percentage |
|---|---|---|---|
| A | 5718 | 524 | 9.164043% |
| B | 5718 | 129 | 2.256034% |
| C | 5719 | 5 | 0.087428% |
| D | 5719 | 436 | 7.623710% |
Noise dominated data is calculated using 1-second bins in cleaned event files. If a bin has >2000 counts, and if more than 50% of those come from <1% of pixels, then it is considered to be noise-dominated and hence unusable.
| Quadrant | # 1 sec bins | Bins with >0 counts | Bins with >2000 counts | High rate bins dominated by noise | Noise dominated (total time) | Noise dominated (detector-on time) | Marked lightcurve |
|---|---|---|---|---|---|---|---|
| A | 7061 | 5719 | 250 | 250 | 3.54% | 4.37% | 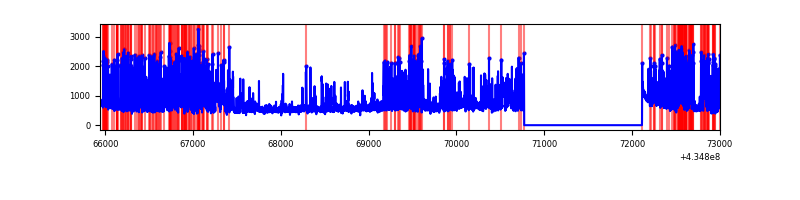 |
| B | 7061 | 5719 | 116 | 116 | 1.64% | 2.03% | 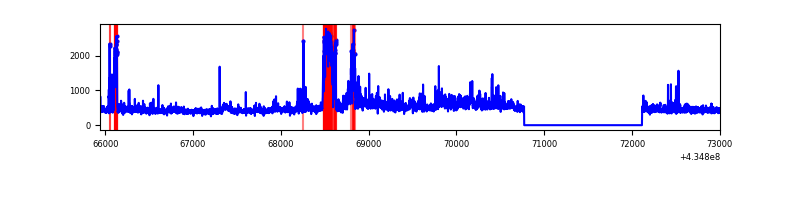 |
| C | 7062 | 5720 | 3 | 3 | 0.04% | 0.05% | 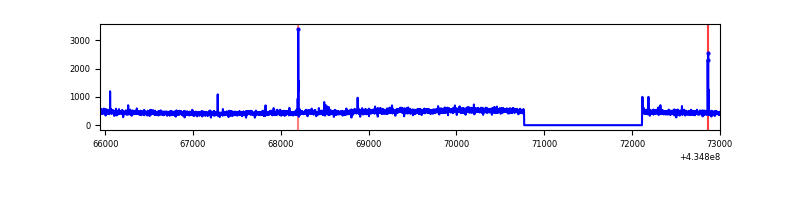 |
| D | 7062 | 5720 | 438 | 438 | 6.20% | 7.66% | 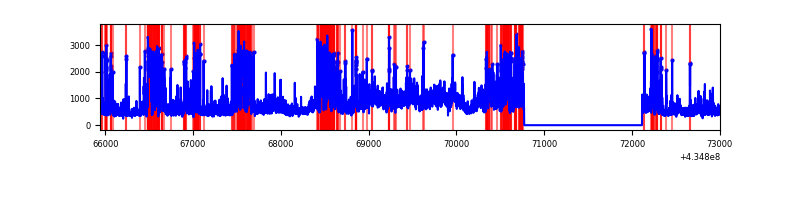 |
Top three noisy pixels from each quadrant. If the there are fewer than three noisy pixels in the level2.evt file, extra rows are filled as -1
| Pixel properties | Quadrant properties | ||||||
|---|---|---|---|---|---|---|---|
| Quadrant | DetID | PixID | Counts | Sigma | Mean | Median | Sigma |
| A | 15 | 222 | 1968968 | 16067.29 | 593 | 581 | 122.5 |
| A | 10 | 83 | 592649 | 4832.85 | 593 | 581 | 122.5 |
| A | 15 | 237 | 179174 | 1457.8 | 593 | 581 | 122.5 |
| B | 15 | 36 | 271165 | 2292.51 | 605 | 588 | 118.0 |
| B | 0 | 245 | 138330 | 1167.04 | 605 | 588 | 118.0 |
| B | 5 | 255 | 112212 | 945.75 | 605 | 588 | 118.0 |
| C | 15 | 214 | 244808 | 1753.55 | 593 | 596 | 139.3 |
| C | 3 | 233 | 63019 | 448.22 | 593 | 596 | 139.3 |
| C | 14 | 254 | 11923 | 81.33 | 593 | 596 | 139.3 |
| D | 13 | 249 | 1249261 | 8822.91 | 573 | 555 | 141.5 |
| D | 2 | 16 | 782312 | 5523.61 | 573 | 555 | 141.5 |
| D | 1 | 52 | 429799 | 3032.88 | 573 | 555 | 141.5 |
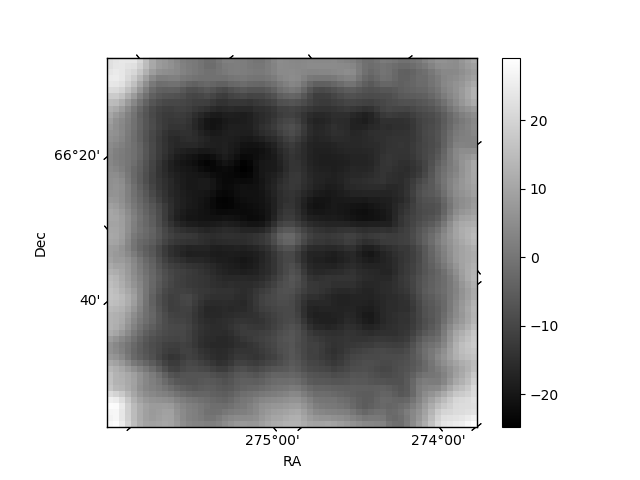
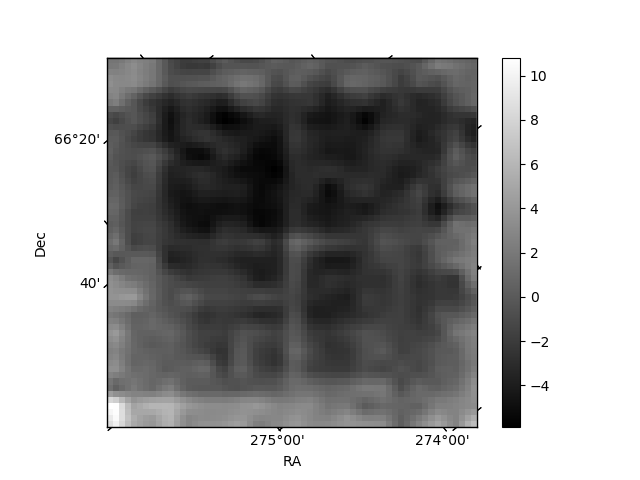
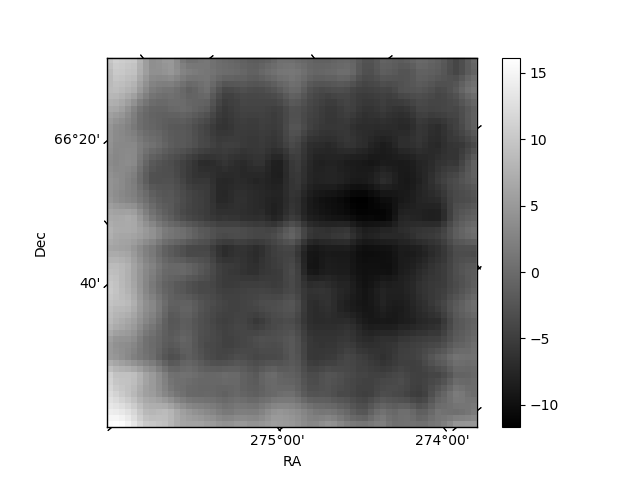
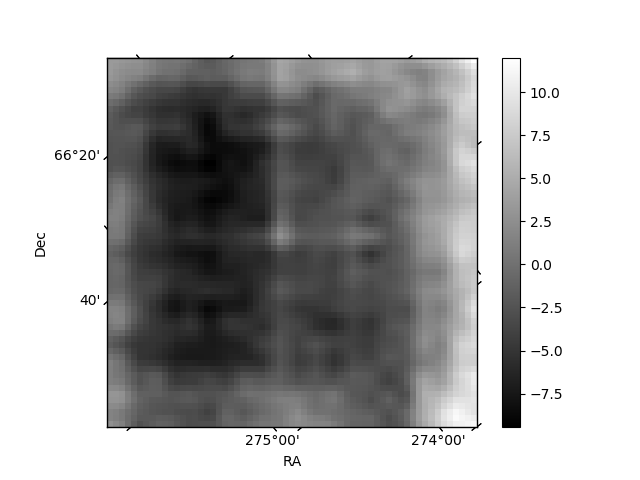
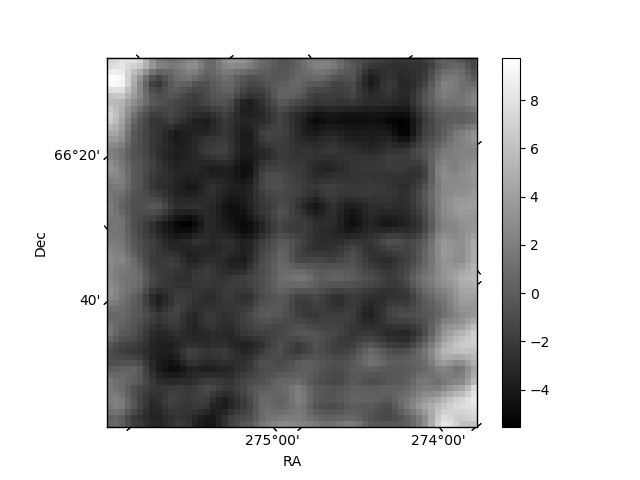
Histogram calculated using DETX and DETY for each event in the final _common_clean file
| Quadrant A | 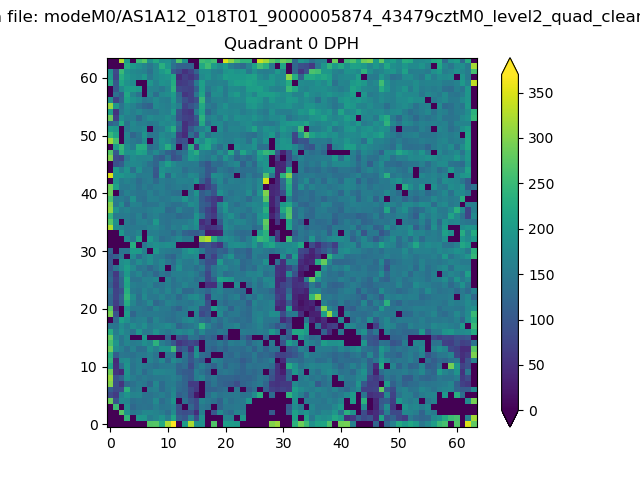 |
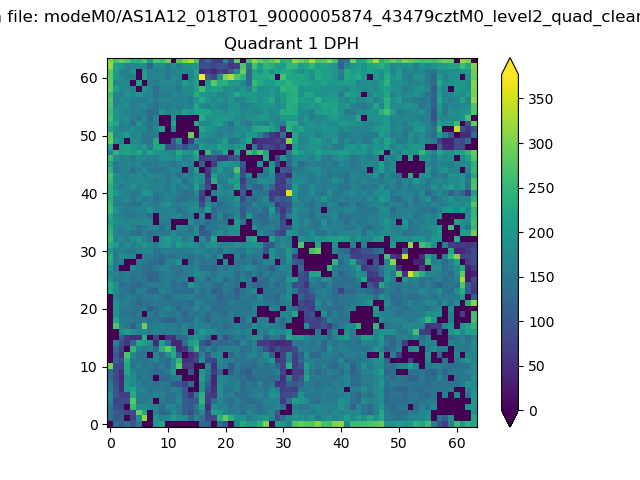 |
Quadrant B |
|---|---|---|---|
| Quadrant D | 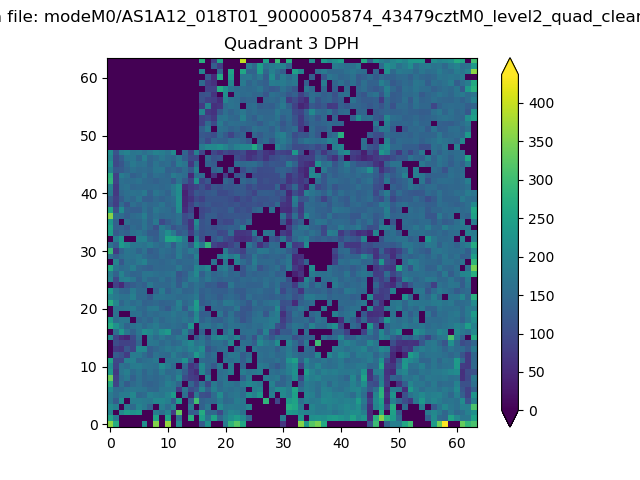 |
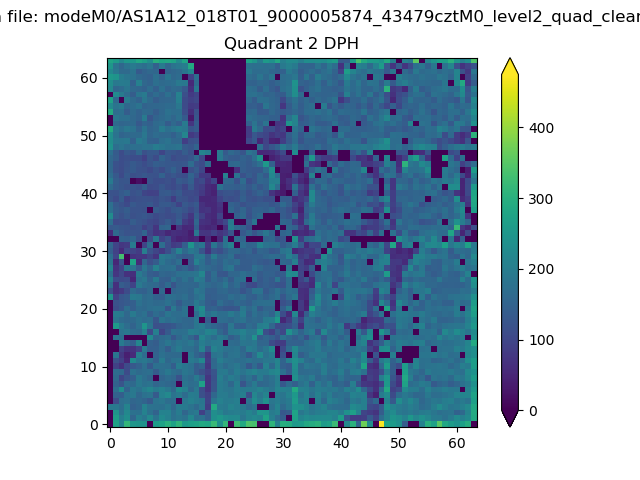 |
Quadrant C |
| Plot type | Count rate plots | Images |
|---|---|---|
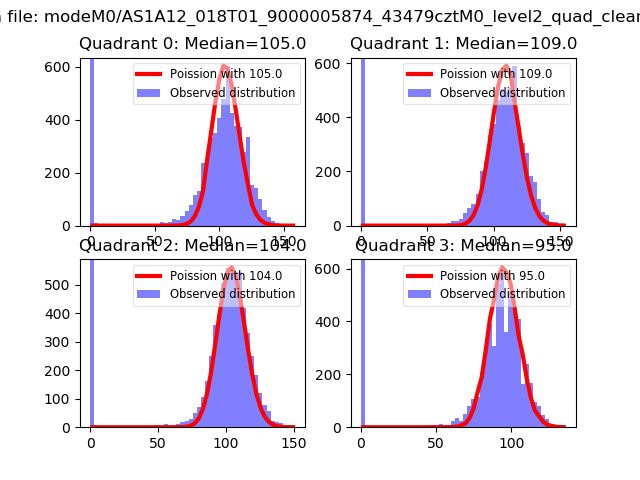
| Comparison with Poisson distribution Blue bars denote a histogram of data divided into 1 sec bins. Red curve is a Poisson curve with rate = median count rate of data. |
 |
 |
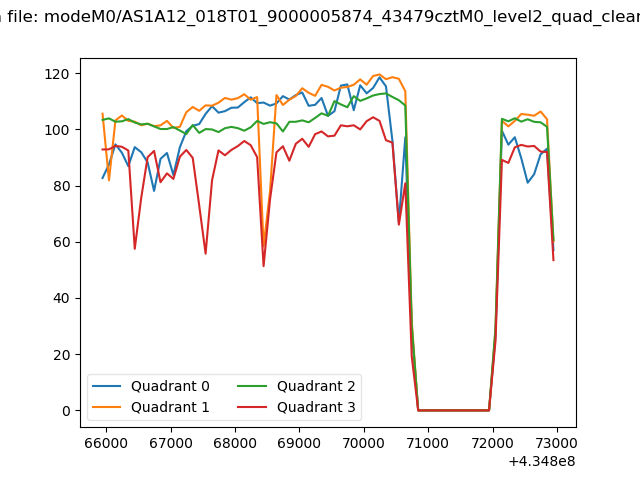
| Quadrant-wise count rates Data is divided into 100 sec bins |
 |
|
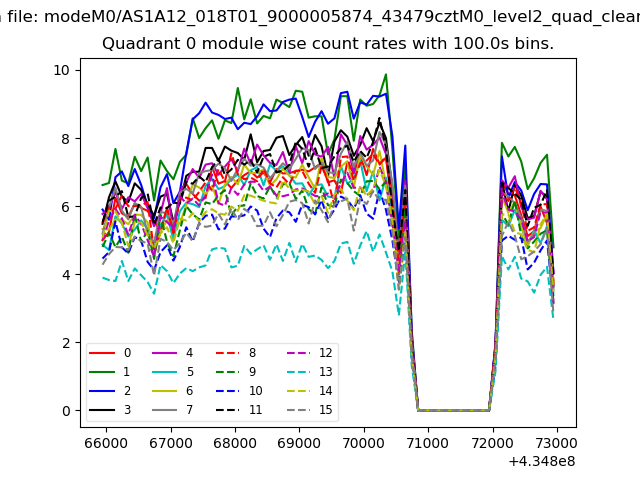
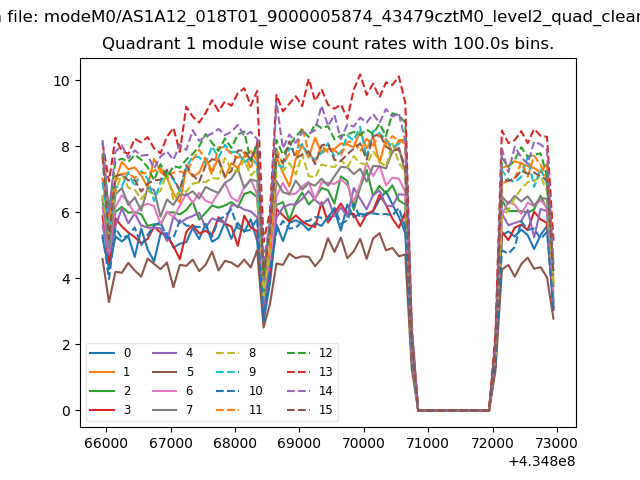
| Module-wise count rates for Quadrant A Data is divided into 100 sec bins |
 |
 |
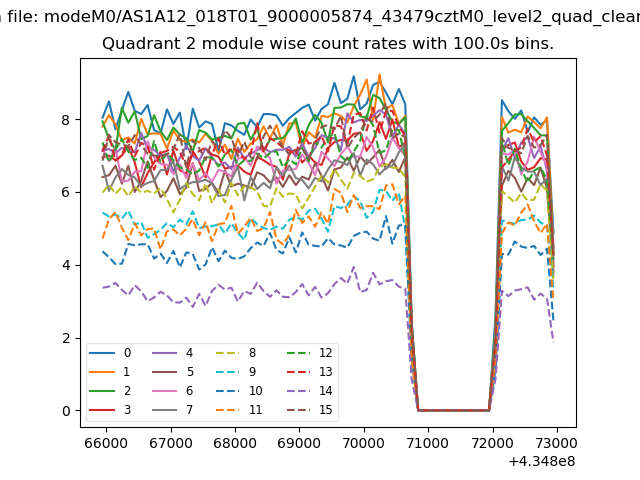
| Module-wise count rates for Quadrant B Data is divided into 100 sec bins |
 |
 |
| Module-wise count rates for Quadrant C Data is divided into 100 sec bins |
 |
 |
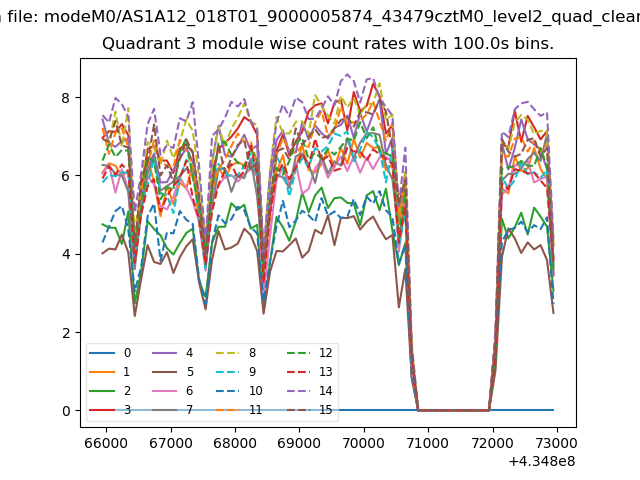
| Module-wise count rates for Quadrant D Data is divided into 100 sec bins |
 |
 |
| Parameter | Plot |
|---|---|
| CZT HV Monitor | 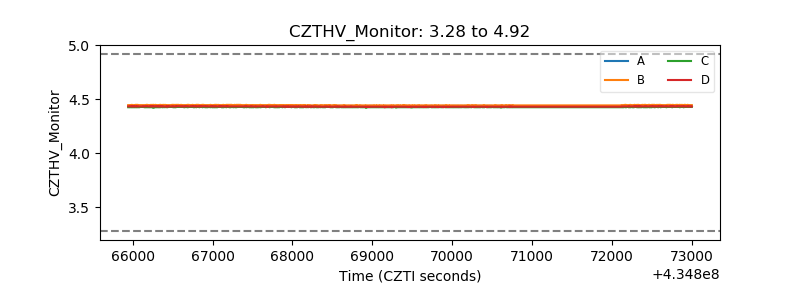 |
| D_VDD | 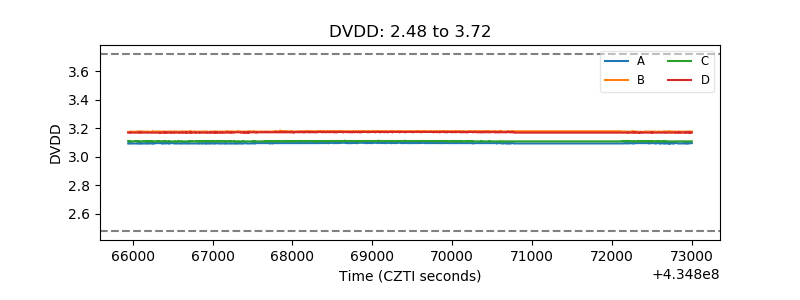 |
| Temperature 1 | 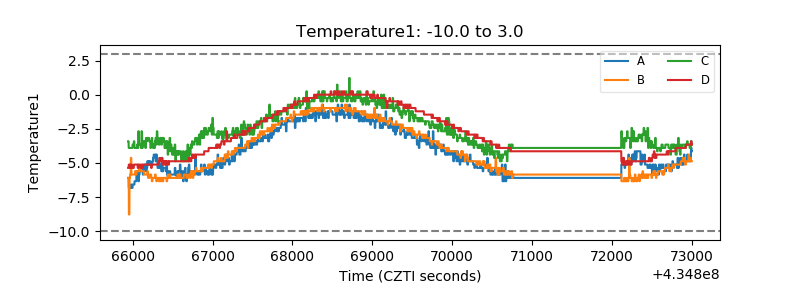 |
| Veto HV Monitor | 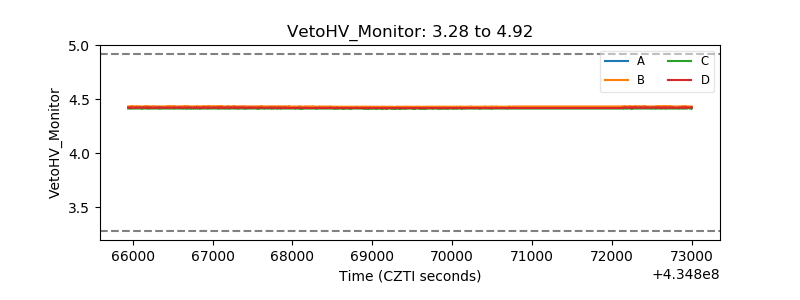 |
| Veto LLD | 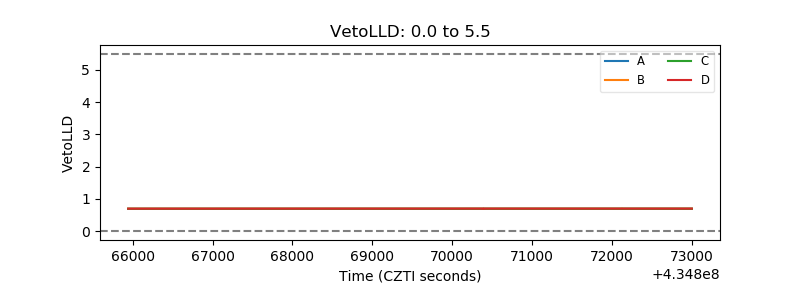 |
| Alpha Counter | 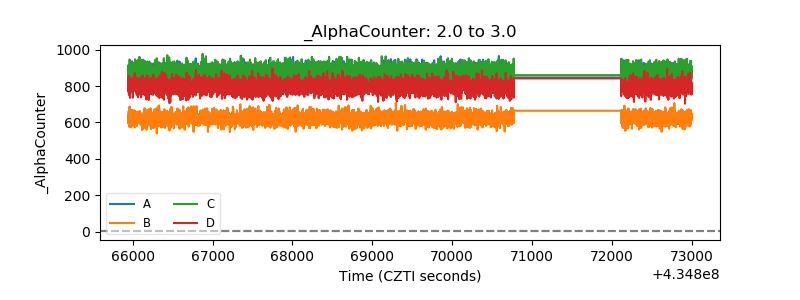 |
| _CPM_Rate | 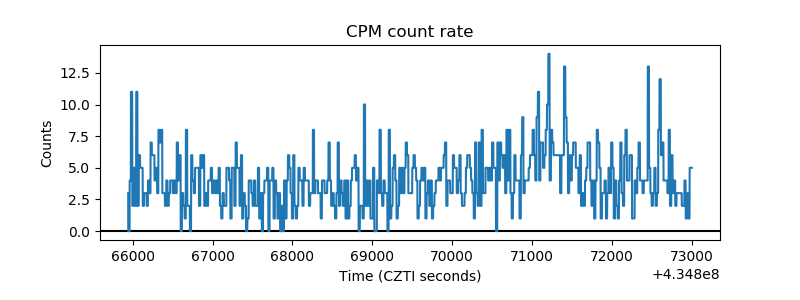 |
| CZT Counter | 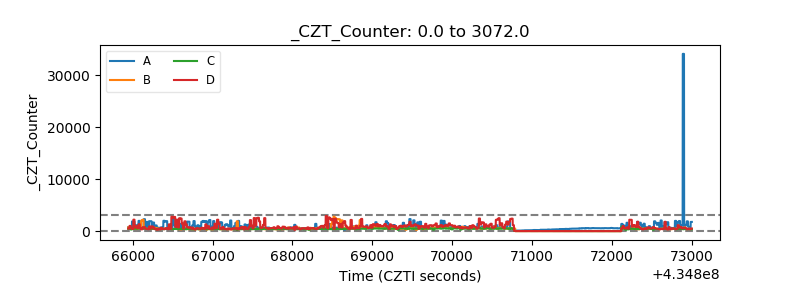 |
| +2.5 Volts monitor | 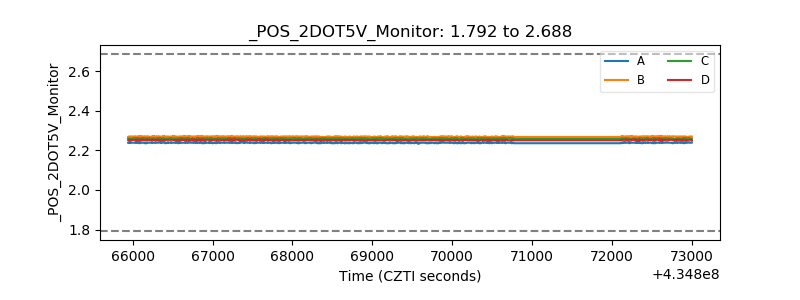 |
| +5 Volts monitor | 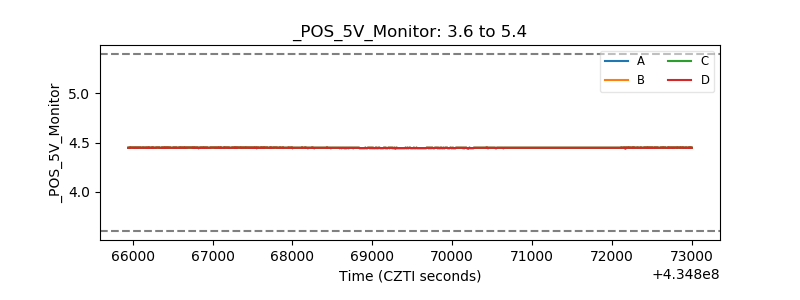 |
| _ROLL_ROT | 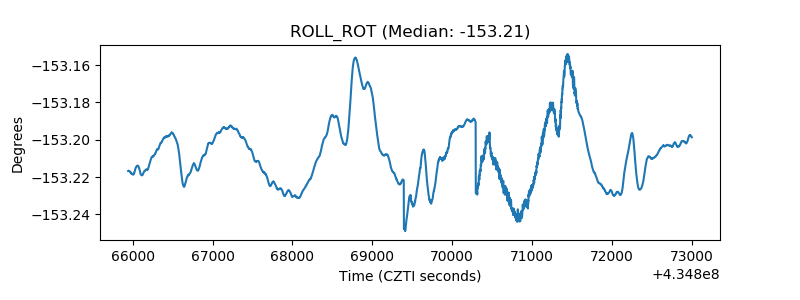 |
| _Roll_DEC | 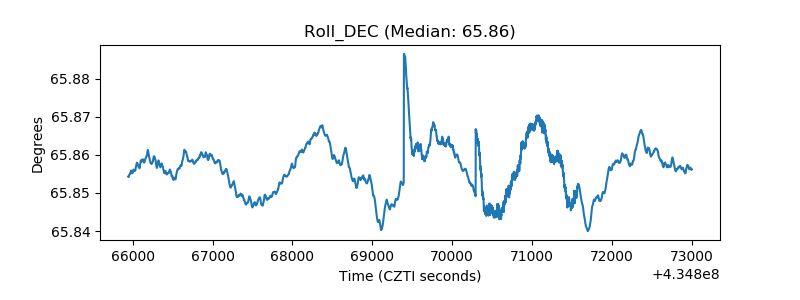 |
| _Roll_RA | 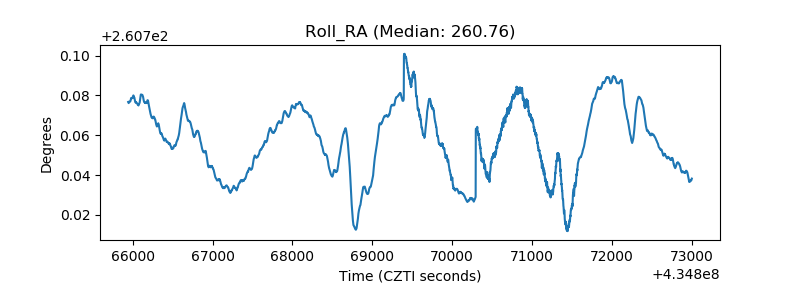 |
| Veto Counter | 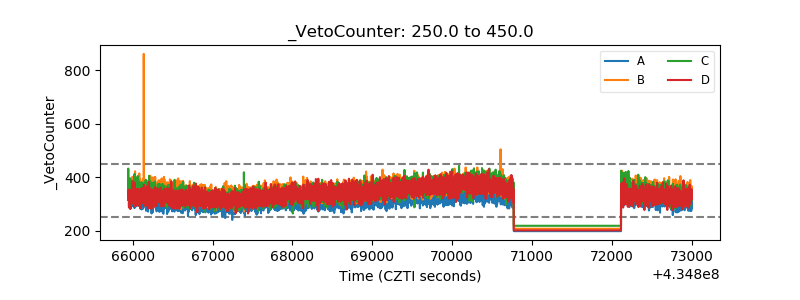 |