| Param | Original file | Final file |
|---|---|---|
| Filename | modeM0/AS1A12_018T01_9000005874_43480cztM0_level2.fits | modeM0/AS1A12_018T01_9000005874_43480cztM0_level2_quad_clean.evt |
| Size (bytes) | 486,509,760 | 95,204,160 |
| Size | 464.0 MB | 90.8 MB |
| Events in quadrant A | 5,715,834 | 616,045 |
| Events in quadrant B | 3,156,728 | 663,216 |
| Events in quadrant C | 2,807,572 | 629,675 |
| Events in quadrant D | 5,859,169 | 550,689 |
| Mode M0 | |||
|---|---|---|---|
| Quadrant | BADHDUFLAG | Total packets | Discarded packets |
| A | 0 | 21342 | 2 |
| B | 0 | 13475 | 2 |
| C | 0 | 12285 | 2 |
| D | 0 | 21641 | 2 |
| Mode M9 | |||
|---|---|---|---|
| Quadrant | BADHDUFLAG | Total packets | Discarded packets |
| A | 0 | 18 | 0 |
| B | 0 | 19 | 0 |
| C | 0 | 19 | 0 |
| D | 0 | 19 | 0 |
| Mode SS | |||
|---|---|---|---|
| Quadrant | BADHDUFLAG | Total packets | Discarded packets |
| A | 0 | 122 | 0 |
| B | 0 | 122 | 0 |
| C | 0 | 122 | 0 |
| D | 0 | 122 | 0 |
| Quadrant | Total seconds | Saturated seconds | Saturation percentage |
|---|---|---|---|
| A | 6056 | 535 | 8.834214% |
| B | 6056 | 34 | 0.561427% |
| C | 6056 | 15 | 0.247688% |
| D | 6056 | 386 | 6.373844% |
Noise dominated data is calculated using 1-second bins in cleaned event files. If a bin has >2000 counts, and if more than 50% of those come from <1% of pixels, then it is considered to be noise-dominated and hence unusable.
| Quadrant | # 1 sec bins | Bins with >0 counts | Bins with >2000 counts | High rate bins dominated by noise | Noise dominated (total time) | Noise dominated (detector-on time) | Marked lightcurve |
|---|---|---|---|---|---|---|---|
| A | 7339 | 6057 | 343 | 343 | 4.67% | 5.66% | 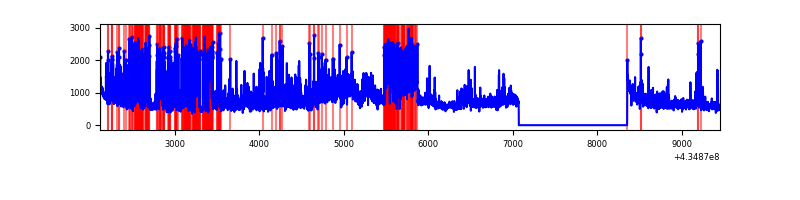 |
| B | 7339 | 6057 | 25 | 25 | 0.34% | 0.41% | 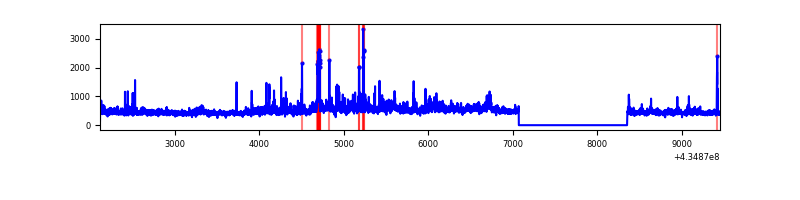 |
| C | 7339 | 6057 | 10 | 10 | 0.14% | 0.17% | 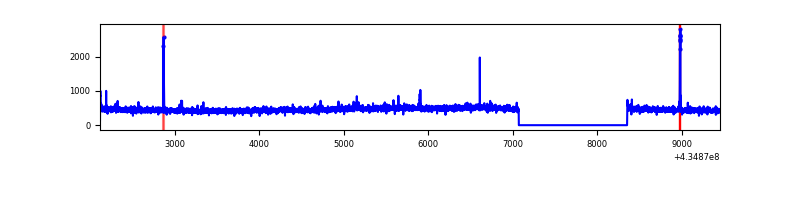 |
| D | 7338 | 6056 | 381 | 381 | 5.19% | 6.29% | 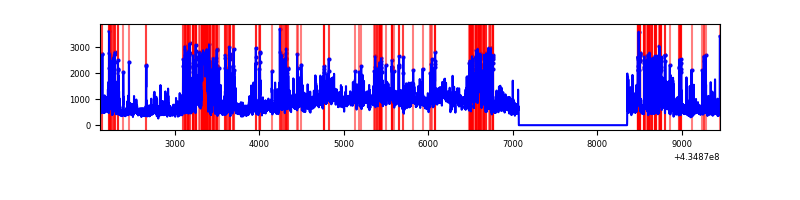 |
Top three noisy pixels from each quadrant. If the there are fewer than three noisy pixels in the level2.evt file, extra rows are filled as -1
| Pixel properties | Quadrant properties | ||||||
|---|---|---|---|---|---|---|---|
| Quadrant | DetID | PixID | Counts | Sigma | Mean | Median | Sigma |
| A | 15 | 222 | 2445835 | 18663.25 | 634 | 621 | 131.0 |
| A | 10 | 83 | 672009 | 5124.41 | 634 | 621 | 131.0 |
| A | 15 | 237 | 74350 | 562.74 | 634 | 621 | 131.0 |
| B | 0 | 245 | 210110 | 1661.0 | 647 | 630 | 126.1 |
| B | 0 | 189 | 105438 | 831.04 | 647 | 630 | 126.1 |
| B | 0 | 190 | 92198 | 726.06 | 647 | 630 | 126.1 |
| C | 15 | 214 | 252292 | 1710.39 | 629 | 634 | 147.1 |
| C | 3 | 233 | 65164 | 438.58 | 629 | 634 | 147.1 |
| C | 15 | 159 | 25656 | 170.06 | 629 | 634 | 147.1 |
| D | 2 | 16 | 1170600 | 7739.32 | 612 | 593 | 151.2 |
| D | 13 | 249 | 944210 | 6241.81 | 612 | 593 | 151.2 |
| D | 1 | 52 | 581131 | 3840.12 | 612 | 593 | 151.2 |
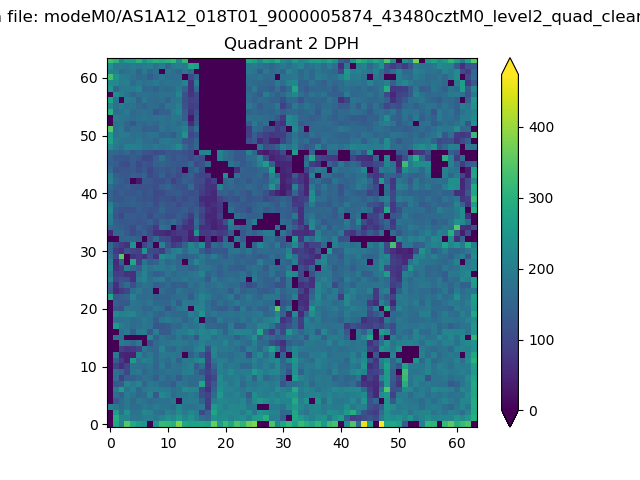
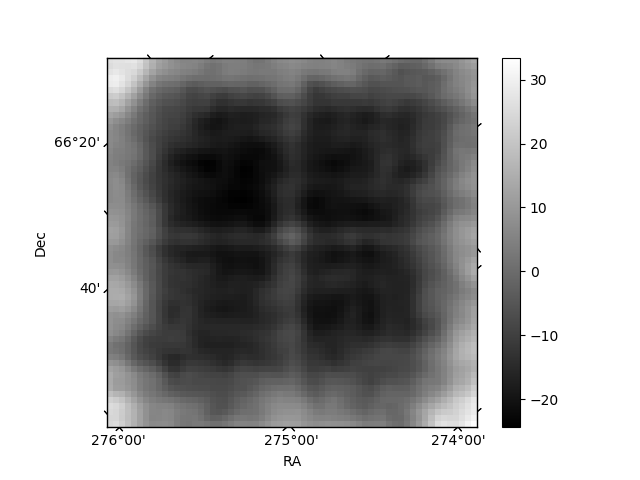
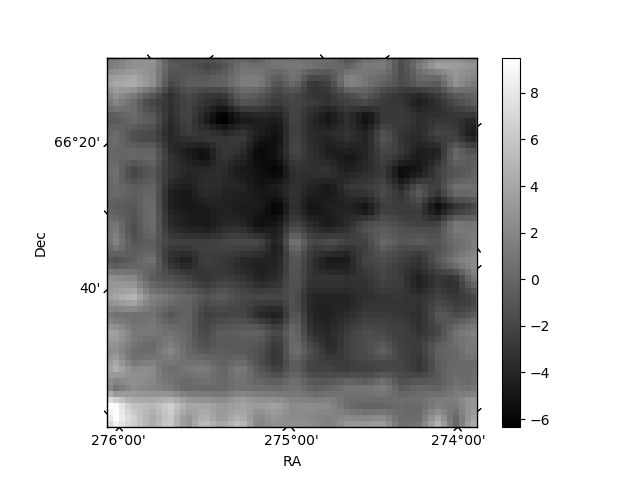
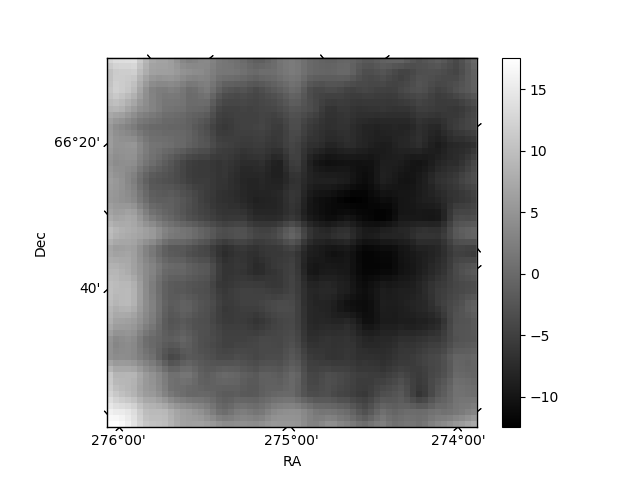
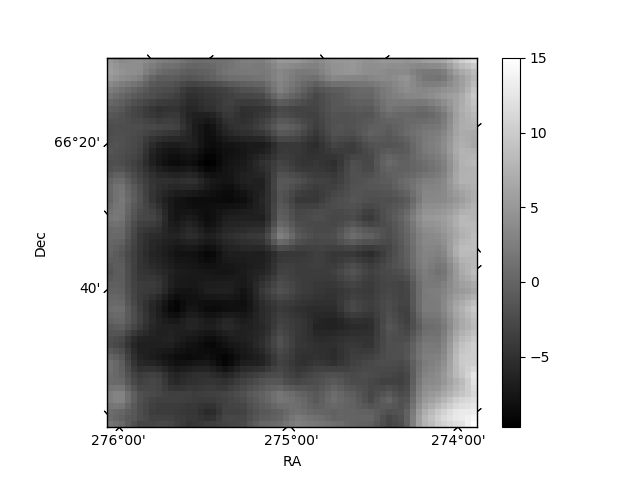
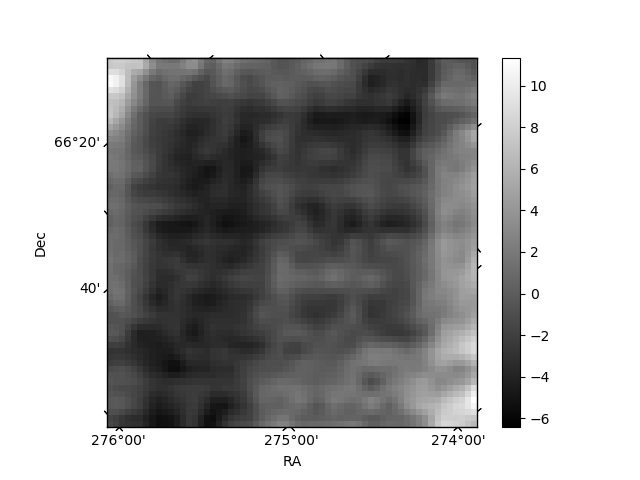
Histogram calculated using DETX and DETY for each event in the final _common_clean file
| Quadrant A | 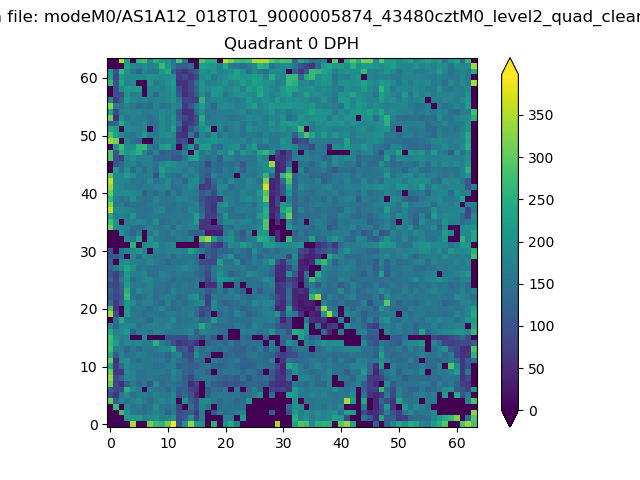 |
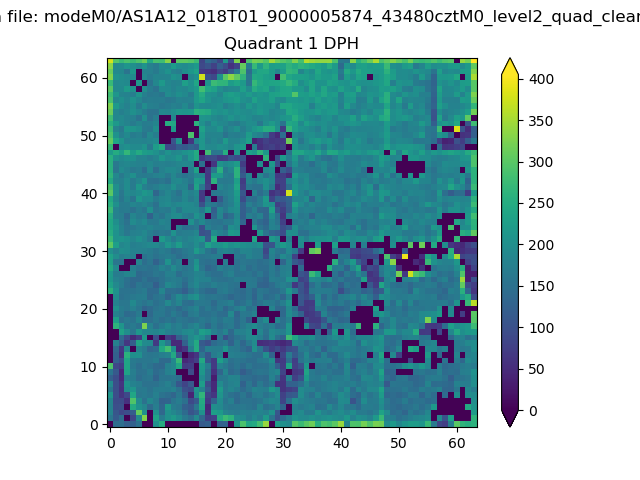 |
Quadrant B |
|---|---|---|---|
| Quadrant D | 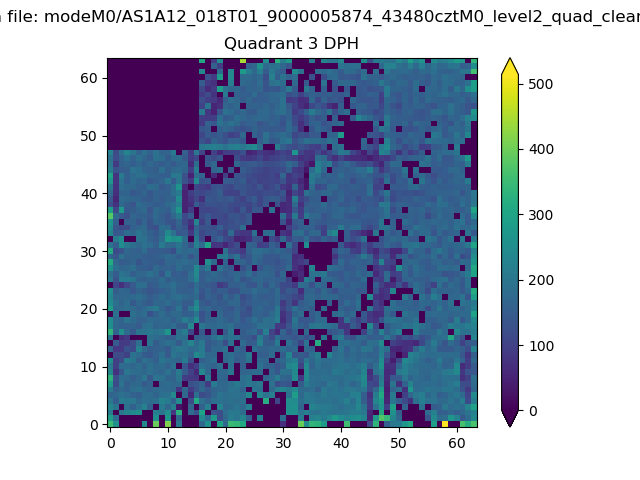 |
 |
Quadrant C |
| Plot type | Count rate plots | Images |
|---|---|---|
| Comparison with Poisson distribution Blue bars denote a histogram of data divided into 1 sec bins. Red curve is a Poisson curve with rate = median count rate of data. |
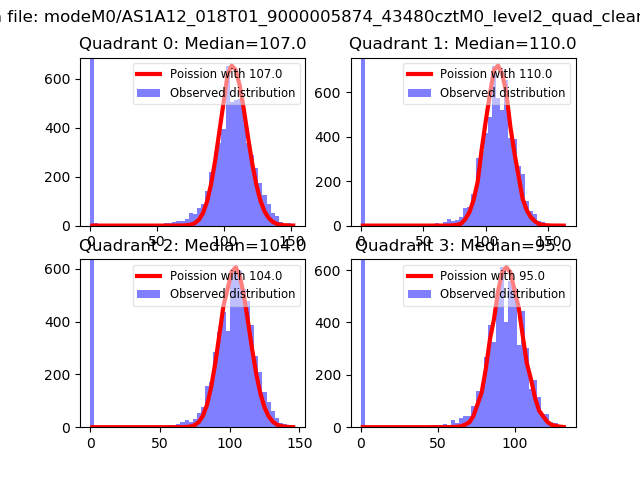 |
 |
| Quadrant-wise count rates Data is divided into 100 sec bins |
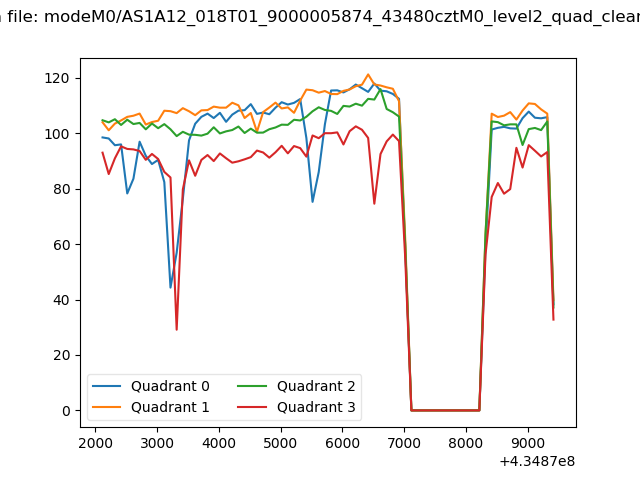 |
|
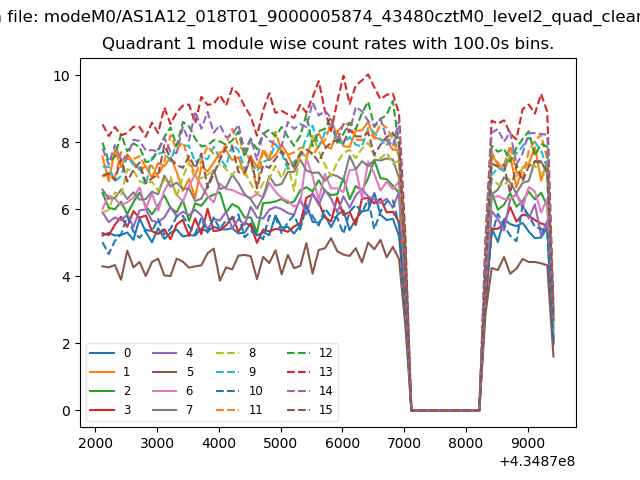
| Module-wise count rates for Quadrant A Data is divided into 100 sec bins |
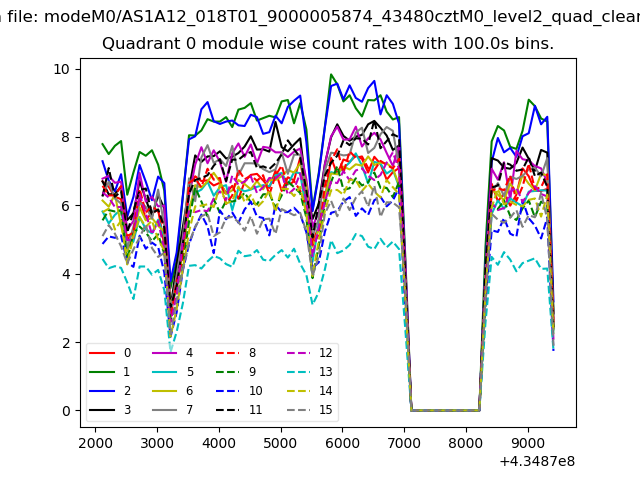 |
 |
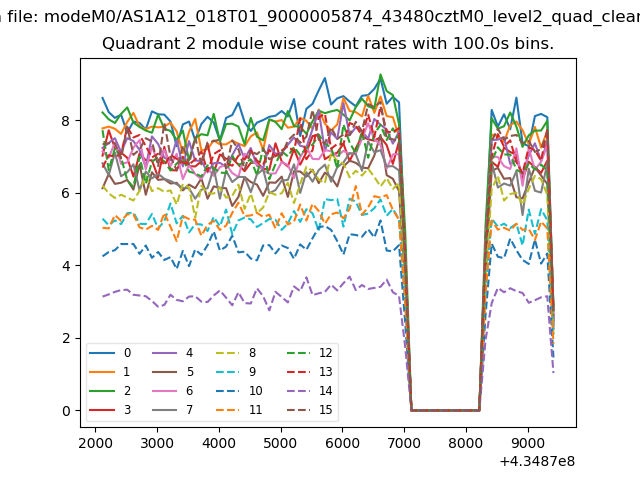
| Module-wise count rates for Quadrant B Data is divided into 100 sec bins |
 |
 |
| Module-wise count rates for Quadrant C Data is divided into 100 sec bins |
 |
 |
| Module-wise count rates for Quadrant D Data is divided into 100 sec bins |
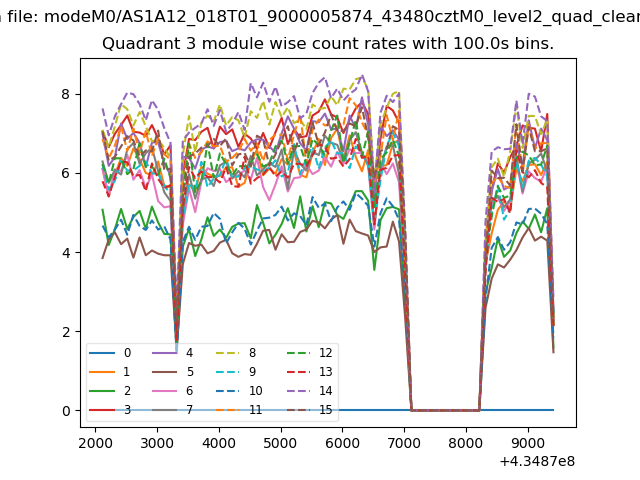 |
 |
| Parameter | Plot |
|---|---|
| CZT HV Monitor | 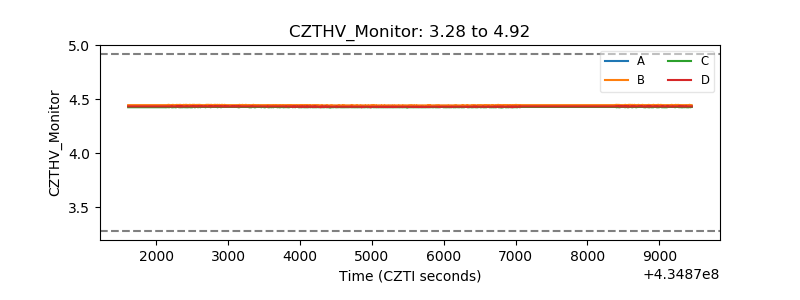 |
| D_VDD | 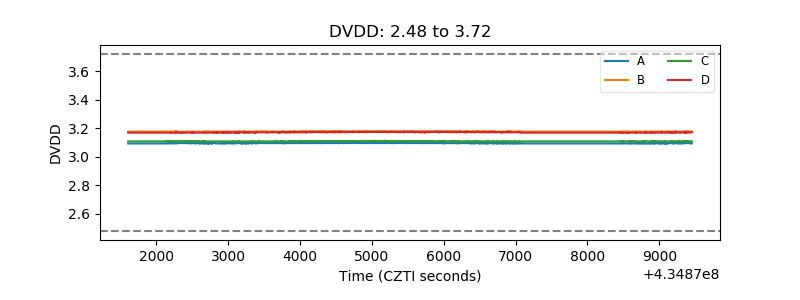 |
| Temperature 1 | 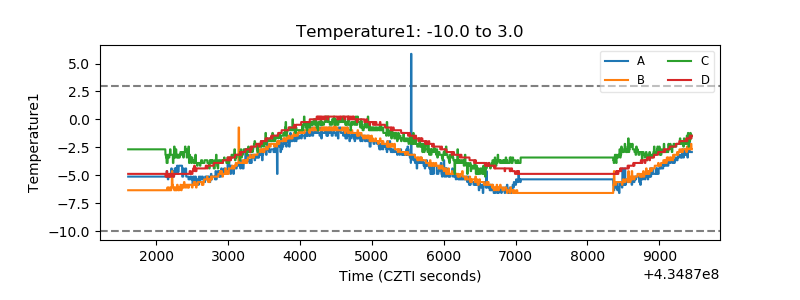 |
| Veto HV Monitor | 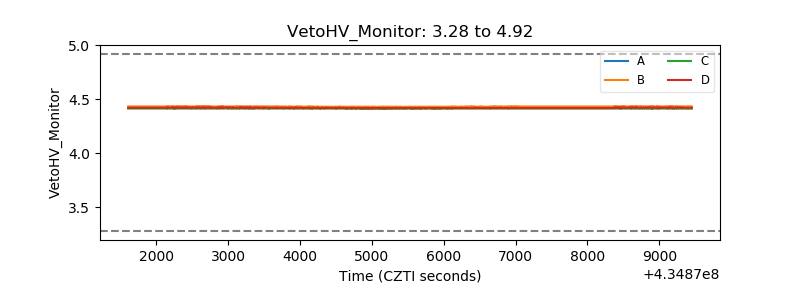 |
| Veto LLD | 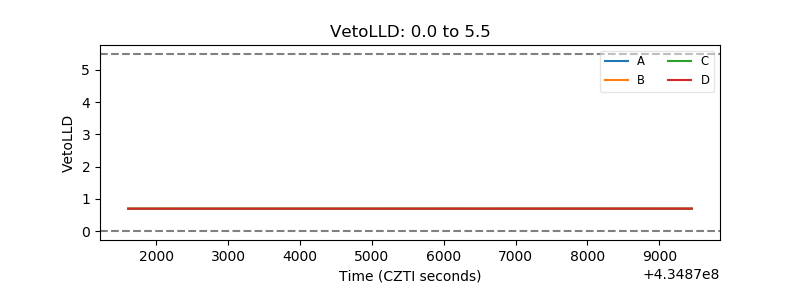 |
| Alpha Counter | 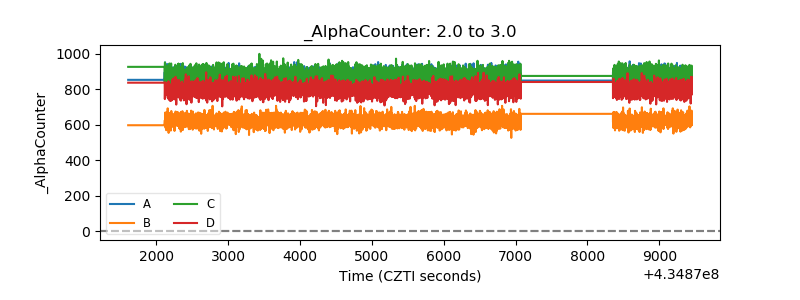 |
| _CPM_Rate | 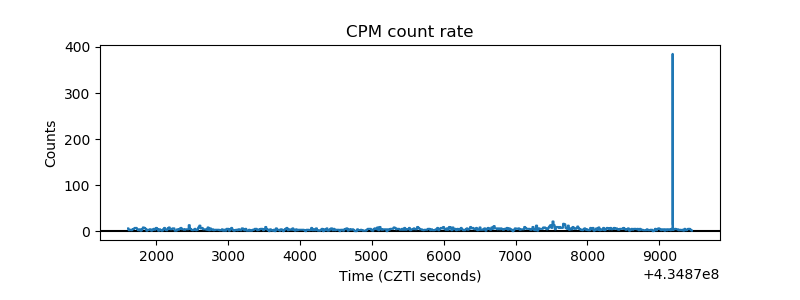 |
| CZT Counter | 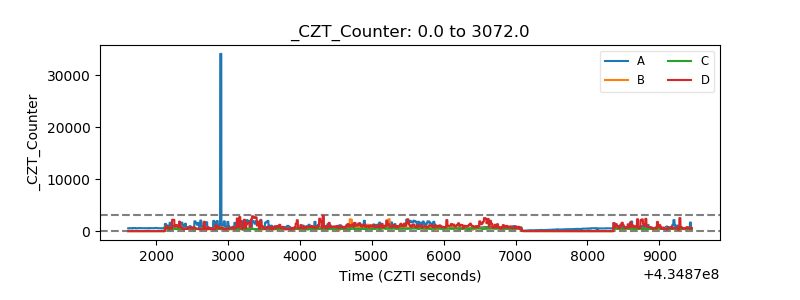 |
| +2.5 Volts monitor | 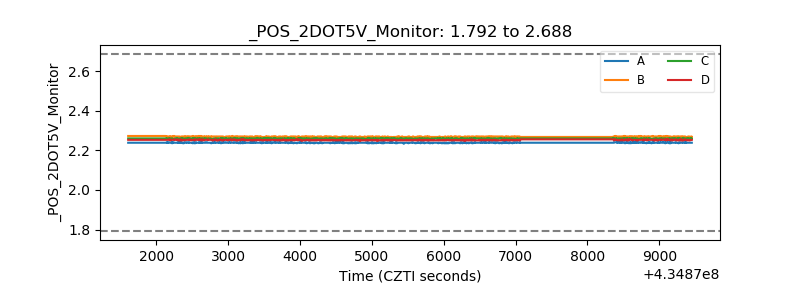 |
| +5 Volts monitor | 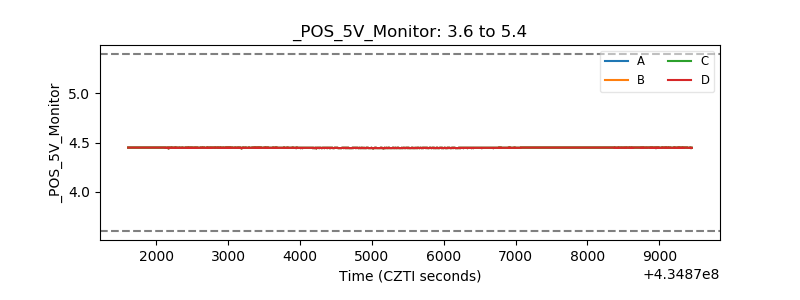 |
| _ROLL_ROT | 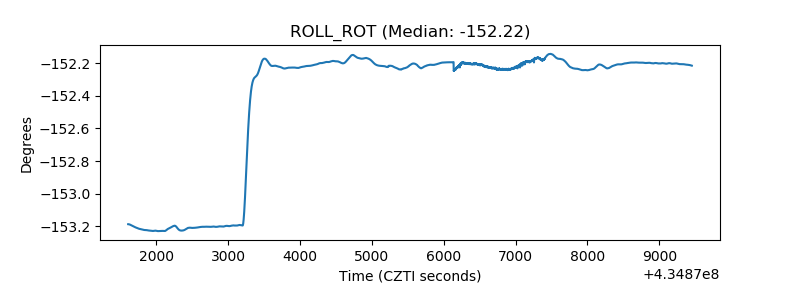 |
| _Roll_DEC | 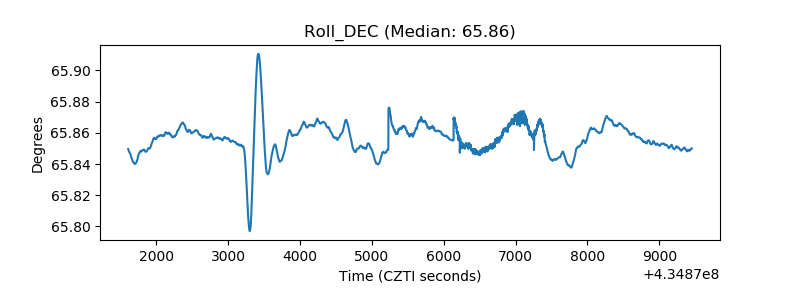 |
| _Roll_RA |  |
| Veto Counter | 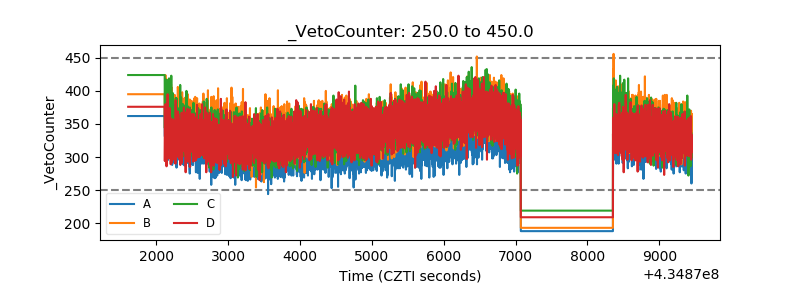 |