| Param | Original file | Final file |
|---|---|---|
| Filename | modeM0/AS1A12_018T01_9000005874_43482cztM0_level2.fits | modeM0/AS1A12_018T01_9000005874_43482cztM0_level2_quad_clean.evt |
| Size (bytes) | 840,081,600 | 169,274,880 |
| Size | 801.2 MB | 161.4 MB |
| Events in quadrant A | 7,706,291 | 1,147,710 |
| Events in quadrant B | 5,570,224 | 1,181,183 |
| Events in quadrant C | 5,084,413 | 1,110,765 |
| Events in quadrant D | 11,897,485 | 934,291 |
| Mode M0 | |||
|---|---|---|---|
| Quadrant | BADHDUFLAG | Total packets | Discarded packets |
| A | 0 | 30838 | 3 |
| B | 0 | 23577 | 3 |
| C | 0 | 22059 | 3 |
| D | 0 | 42908 | 3 |
| Mode M9 | |||
|---|---|---|---|
| Quadrant | BADHDUFLAG | Total packets | Discarded packets |
| A | 0 | 30 | 0 |
| B | 0 | 30 | 0 |
| C | 0 | 31 | 0 |
| D | 0 | 31 | 0 |
| Mode SS | |||
|---|---|---|---|
| Quadrant | BADHDUFLAG | Total packets | Discarded packets |
| A | 0 | 220 | 0 |
| B | 0 | 220 | 0 |
| C | 0 | 220 | 0 |
| D | 0 | 220 | 0 |
| Quadrant | Total seconds | Saturated seconds | Saturation percentage |
|---|---|---|---|
| A | 10847 | 183 | 1.687102% |
| B | 10847 | 36 | 0.331889% |
| C | 10846 | 19 | 0.175180% |
| D | 10846 | 1294 | 11.930666% |
Noise dominated data is calculated using 1-second bins in cleaned event files. If a bin has >2000 counts, and if more than 50% of those come from <1% of pixels, then it is considered to be noise-dominated and hence unusable.
| Quadrant | # 1 sec bins | Bins with >0 counts | Bins with >2000 counts | High rate bins dominated by noise | Noise dominated (total time) | Noise dominated (detector-on time) | Marked lightcurve |
|---|---|---|---|---|---|---|---|
| A | 13623 | 10849 | 144 | 144 | 1.06% | 1.33% | 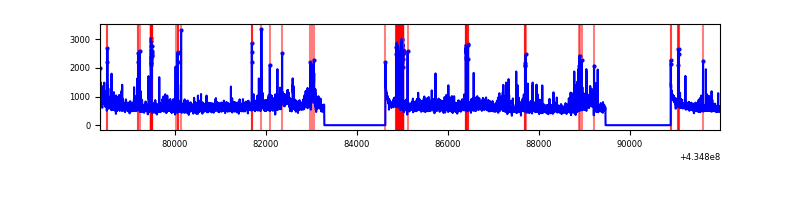 |
| B | 13623 | 10849 | 14 | 14 | 0.10% | 0.13% | 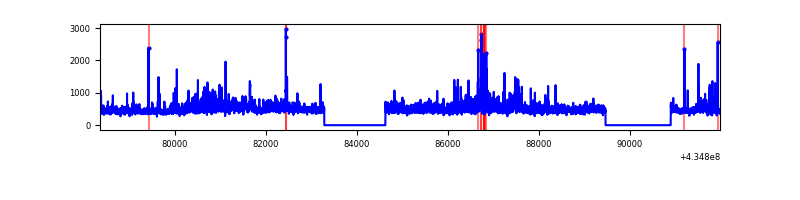 |
| C | 13622 | 10848 | 16 | 16 | 0.12% | 0.15% | 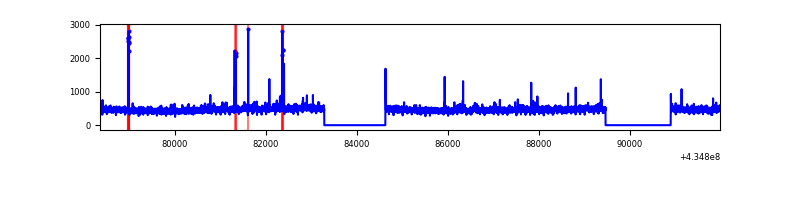 |
| D | 13621 | 10847 | 1258 | 1258 | 9.24% | 11.60% | 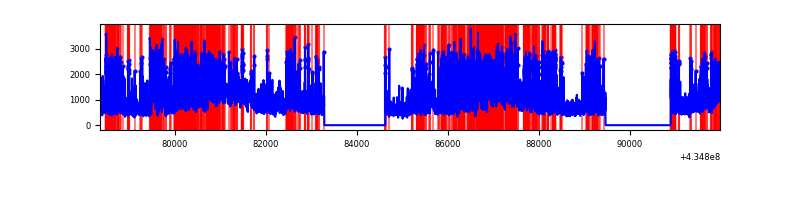 |
Top three noisy pixels from each quadrant. If the there are fewer than three noisy pixels in the level2.evt file, extra rows are filled as -1
| Pixel properties | Quadrant properties | ||||||
|---|---|---|---|---|---|---|---|
| Quadrant | DetID | PixID | Counts | Sigma | Mean | Median | Sigma |
| A | 15 | 222 | 1258082 | 5331.32 | 1158 | 1132 | 235.8 |
| A | 10 | 83 | 1177307 | 4988.72 | 1158 | 1132 | 235.8 |
| A | 15 | 237 | 493470 | 2088.24 | 1158 | 1132 | 235.8 |
| B | 0 | 245 | 226366 | 1007.27 | 1159 | 1126 | 223.6 |
| B | 0 | 190 | 207961 | 924.97 | 1159 | 1126 | 223.6 |
| B | 0 | 189 | 191403 | 850.92 | 1159 | 1126 | 223.6 |
| C | 15 | 214 | 450981 | 1711.9 | 1131 | 1136 | 262.8 |
| C | 3 | 233 | 147517 | 557.06 | 1131 | 1136 | 262.8 |
| C | 15 | 159 | 49990 | 185.92 | 1131 | 1136 | 262.8 |
| D | 1 | 52 | 2940066 | 11049.8 | 1083 | 1048 | 266.0 |
| D | 13 | 249 | 1268457 | 4765.07 | 1083 | 1048 | 266.0 |
| D | 2 | 16 | 1245908 | 4680.29 | 1083 | 1048 | 266.0 |
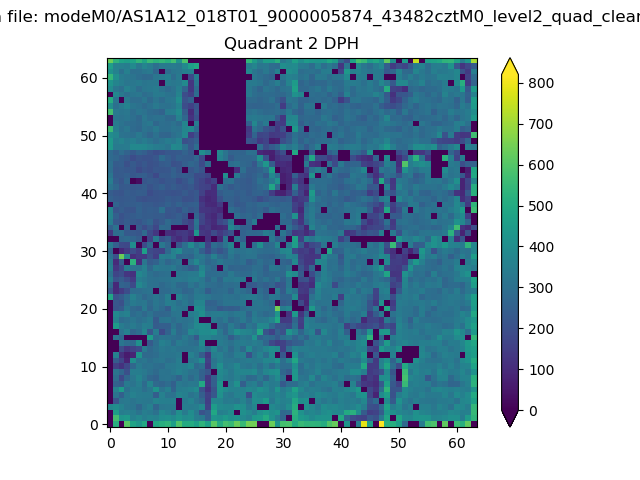
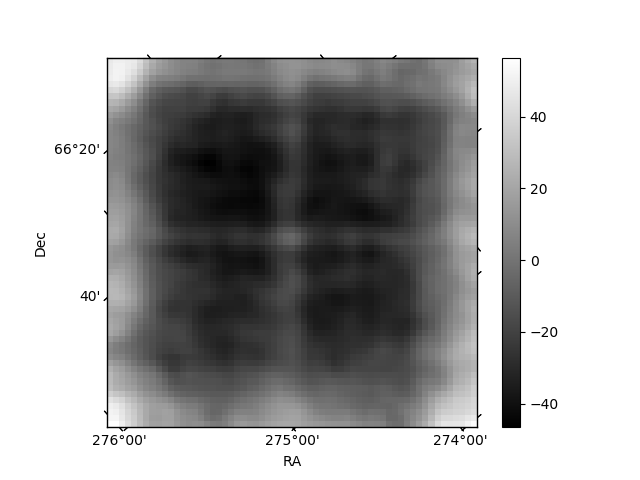
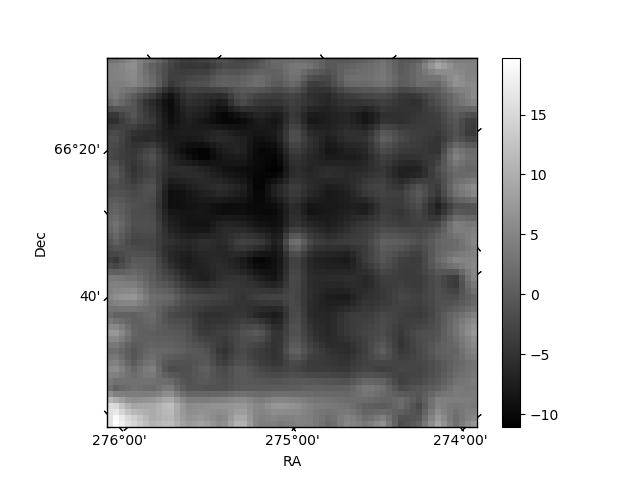
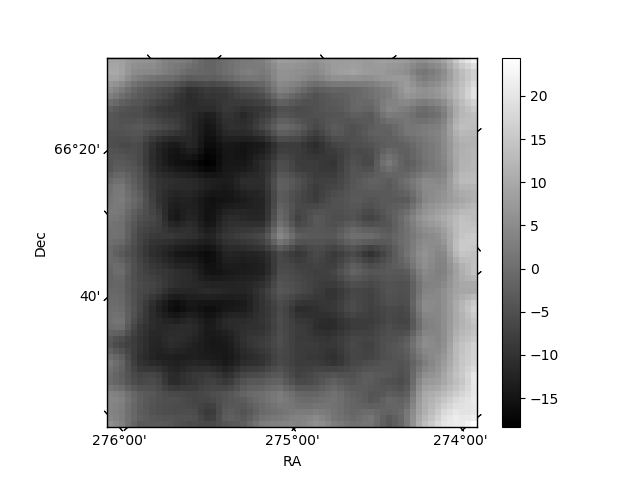
Histogram calculated using DETX and DETY for each event in the final _common_clean file
| Quadrant A | 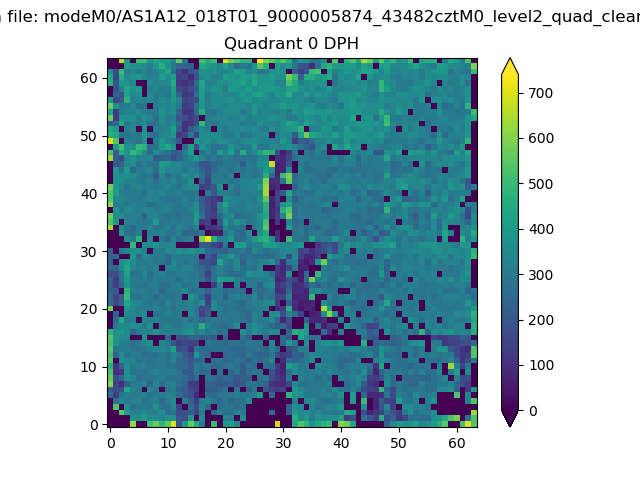 |
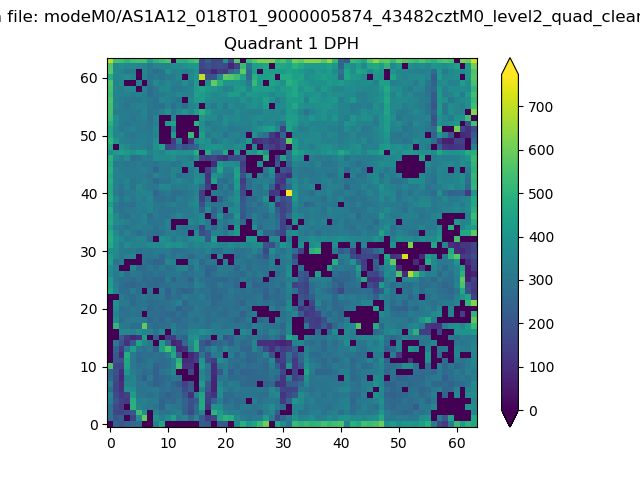 |
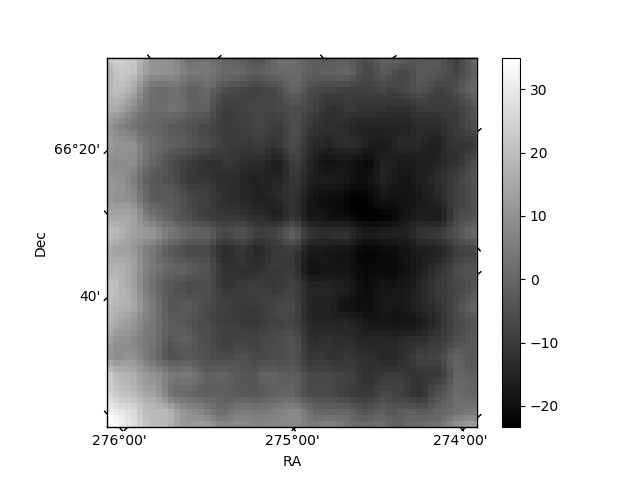
Quadrant B |
|---|---|---|---|
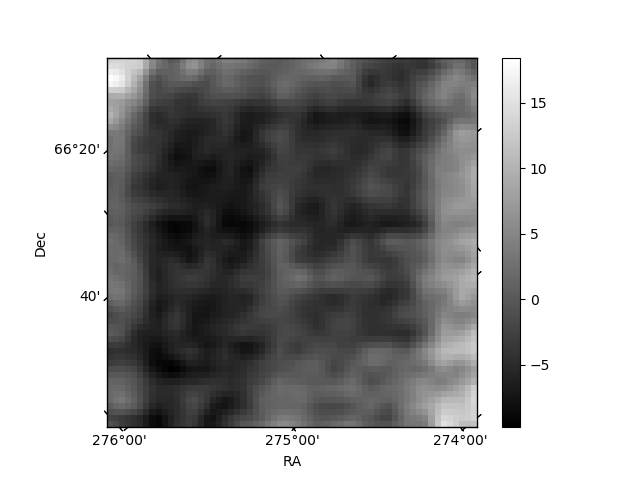
| Quadrant D | 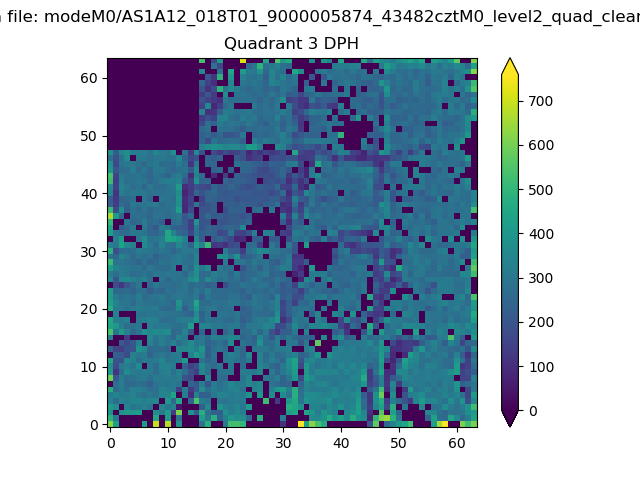 |
 |
Quadrant C |
| Plot type | Count rate plots | Images |
|---|---|---|
| Comparison with Poisson distribution Blue bars denote a histogram of data divided into 1 sec bins. Red curve is a Poisson curve with rate = median count rate of data. |
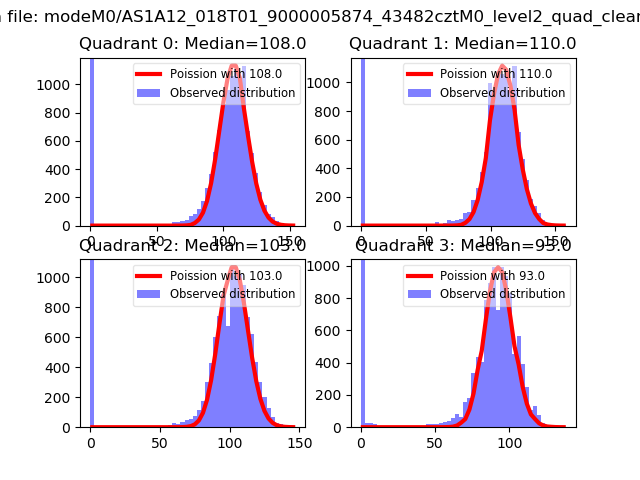 |
 |
| Quadrant-wise count rates Data is divided into 100 sec bins |
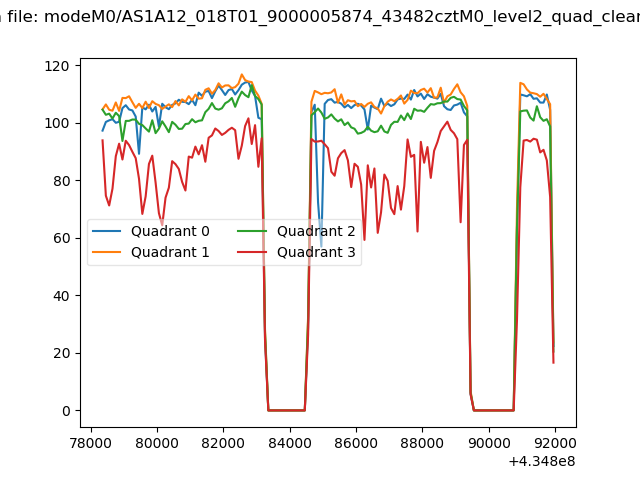 |
|
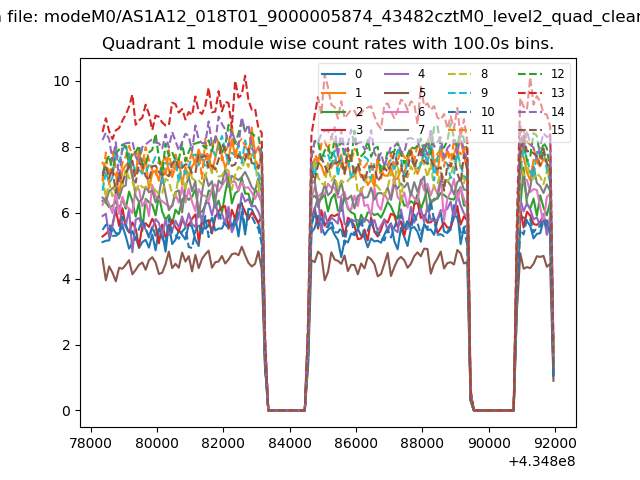
| Module-wise count rates for Quadrant A Data is divided into 100 sec bins |
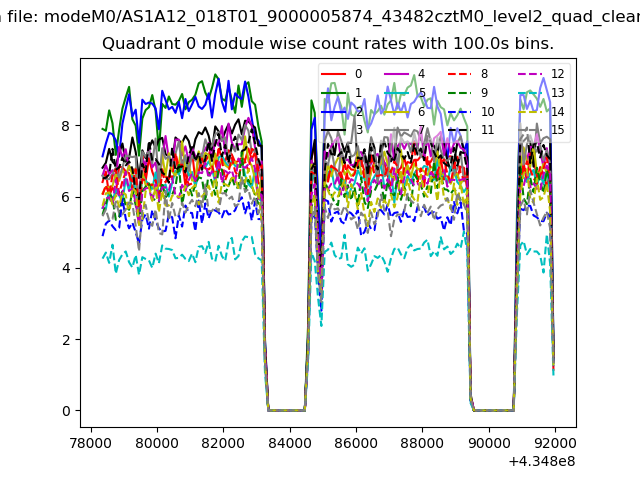 |
 |
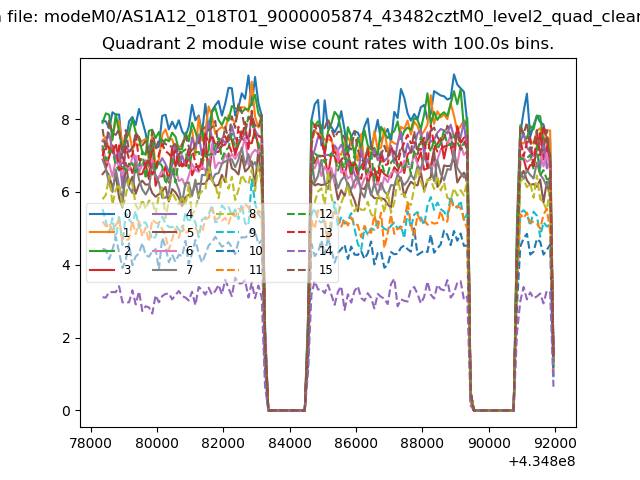
| Module-wise count rates for Quadrant B Data is divided into 100 sec bins |
 |
 |
| Module-wise count rates for Quadrant C Data is divided into 100 sec bins |
 |
 |
| Module-wise count rates for Quadrant D Data is divided into 100 sec bins |
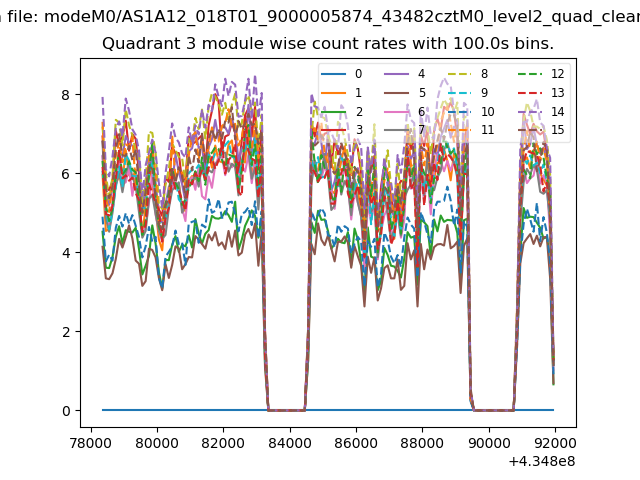 |
 |
| Parameter | Plot |
|---|---|
| CZT HV Monitor | 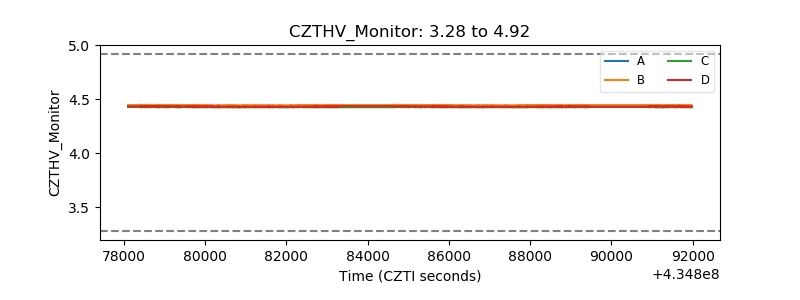 |
| D_VDD | 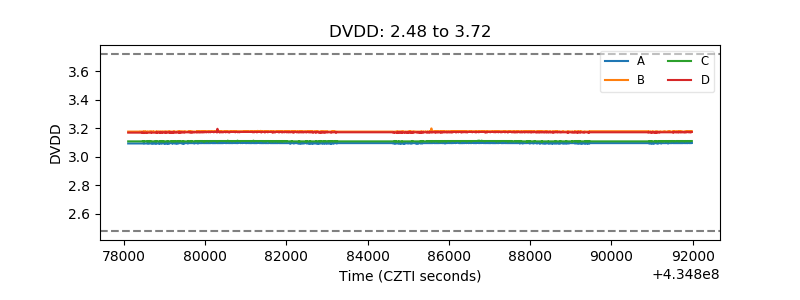 |
| Temperature 1 | 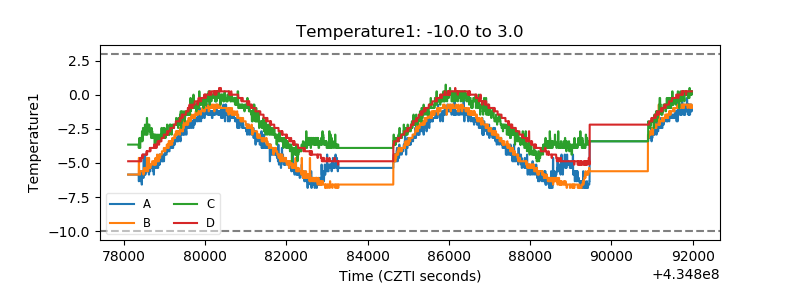 |
| Veto HV Monitor | 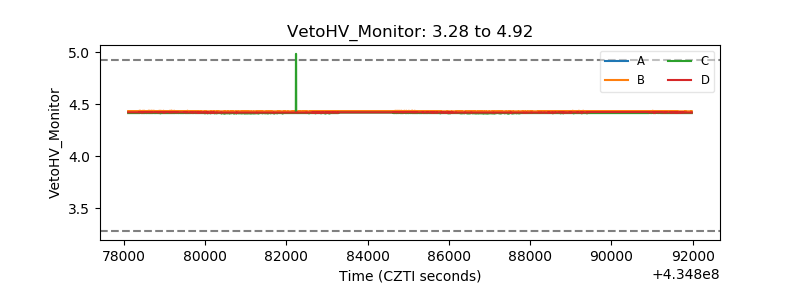 |
| Veto LLD | 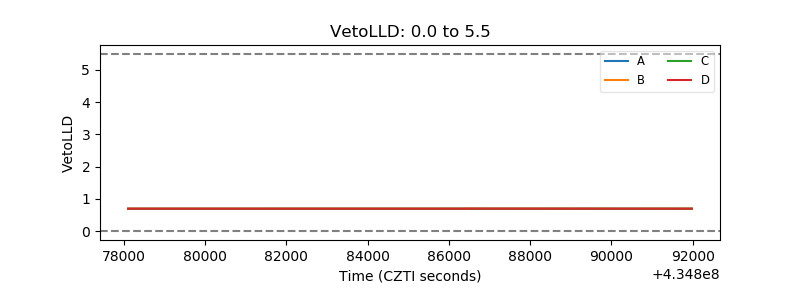 |
| Alpha Counter | 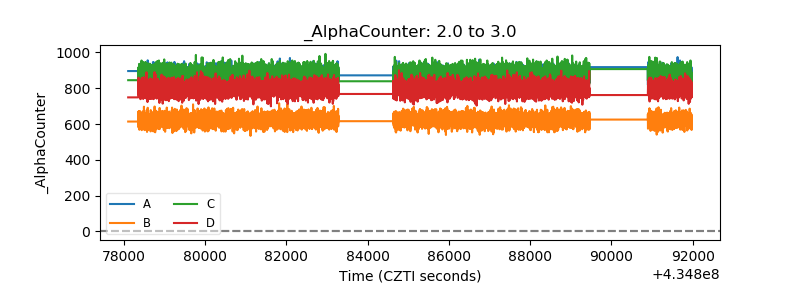 |
| _CPM_Rate | 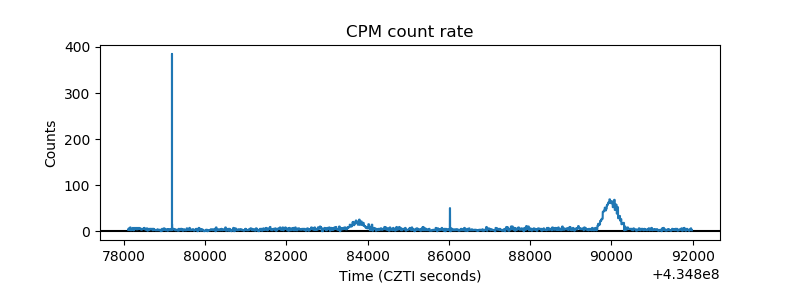 |
| CZT Counter | 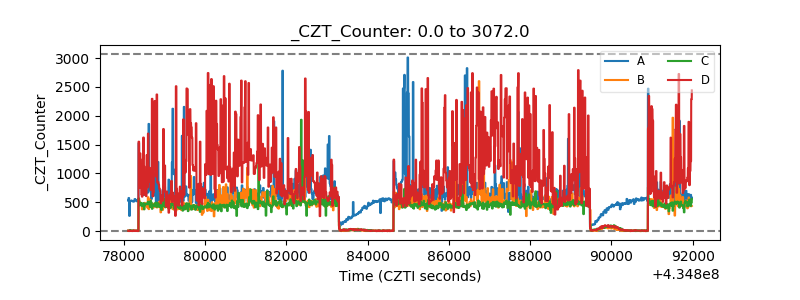 |
| +2.5 Volts monitor | 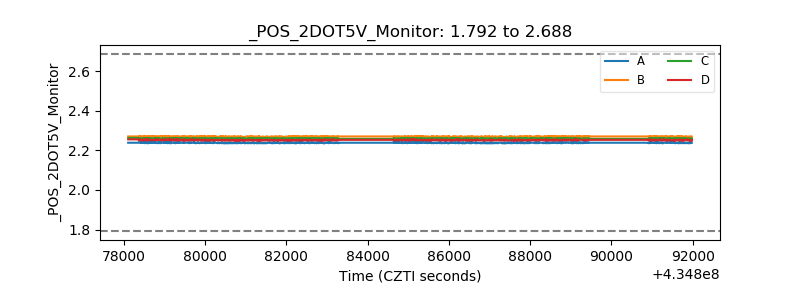 |
| +5 Volts monitor | 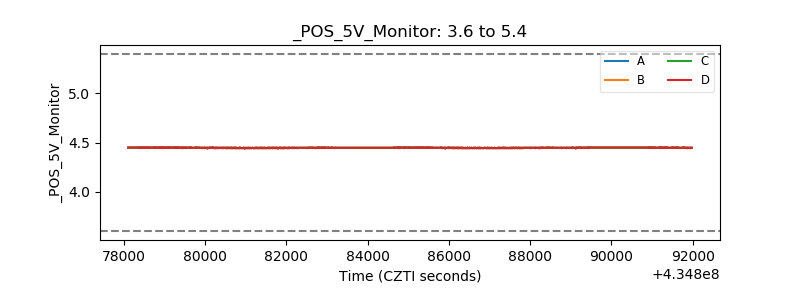 |
| _ROLL_ROT |  |
| _Roll_DEC | 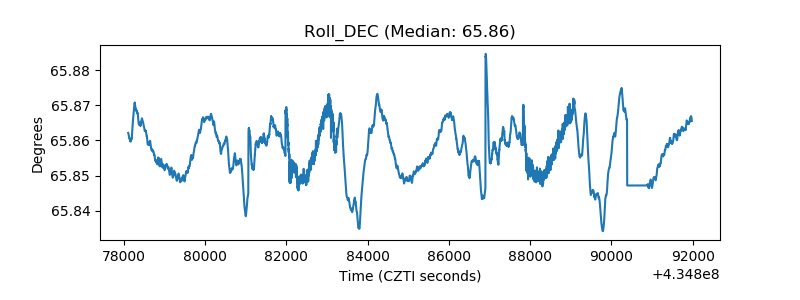 |
| _Roll_RA | 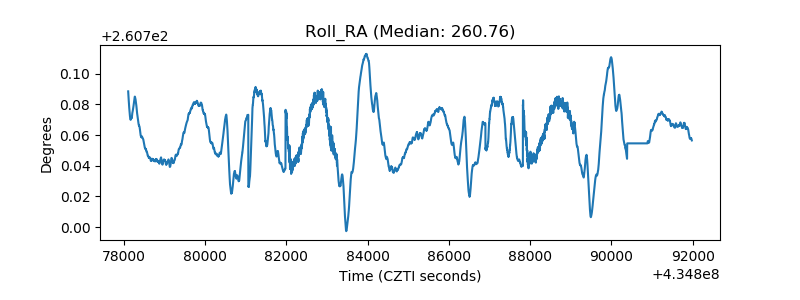 |
| Veto Counter | 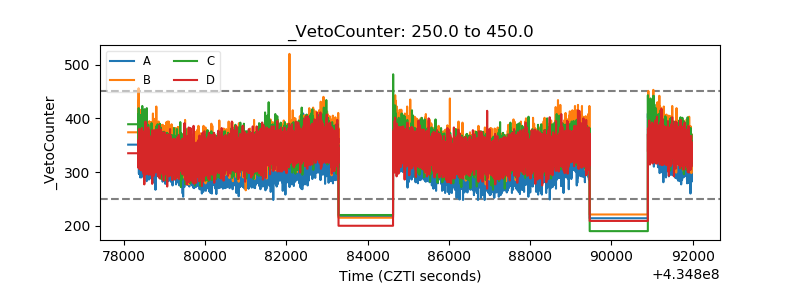 |